Kor. J. Hort. Sci. Technol. 29(3):232-239, 2011
Analysis of Genetic Diversity of Korean Accessions of the Genus Acorus Using RAPD Markers and NIR Spectroscopy
Ja-Hyun Lee1,2, In-Seon Kim3, Seong-Gene Lee4, Kwang-Sub Rim5, Sunggil Kim1,2, and Tae-Ho Han1,2*
1Department of Horticulture, Chonnam National University, Gwangju 500-757, Korea
2Institution of Agricultural Science and Technology, Chonnam National University, Gwangju 500-757, Korea
3Department of Biological Chemistry, Chonnam National University, Gwangju 500-757, Korea
4Department of Molecular Biotechnology, Bioenergy Research Center, Chonnam National University, Gwangju 500-757, Korea
5Hampyeong County Agricultural Technology Center, Hampyeong 525-811, Korea
Abstract. The genus Acorus is known as an indigenous medicinal plant. Genetic diversity of thirteen accessions of A. calamus and eight of A. gramineus, with an accession of Colocasia antiquorum and two of Iris pseudacorus as outgroups, were evaluated using RAPD markers for cluster analysis and principal coordinate analysis, and NIR spectroscopic profiles for principal component analysis.A total of 371 polymorphic bands were obtained by using the selected 12 random primers. The genetic distances were estimated from 0.03 to 0.31 within A.
calamus and from 0.03 to 0.51 within A. gramineus. The dendrogram and three-dimensional plot separated the accessions into four distinct groups (A. calamus, A. gramineus, C. antiquorum, and I. pseudacorus). Moreover, for the diversity among genus Acorus, eleven A. calamus accessions, one A. gramineus accession, and two I. pseudacorus accessions were non-destructively analyzed from their leaves by NIR spectroscopy, which discriminated Acorus accessions like the RAPD analysis. Interestingly, thirteen accessions of A. calamus were clustered into two groups based on RAPD and NIR analyses, which indicates that there are two ecotypes of A. calamus in Korea. An accession (CZ) of A. calamus with yellow stripe on leaves was closely grouped with another (CX) at a genetic distance (GD) of 0.03, which shows that the stripe trait might be generated by chimeric mutation. The genetic distance between A. calamus and A. gramineus was revealed to be farthest from 0.80 to 0.88 GD. In genus Acorus the genetic diversity and genetic variation were identified by using RAPD marker technique and non-destructive NIRs.
Additional key words: Acoraceae, cluster analysis, near infrared spectroscopy (NIRs), principal component analysis, principal coordinate analysis
*Corresponding author: [email protected]
※ Received 27 April 2010; Accepted 16 April 2011. This study was carried out with the support of “Cooperative Research Projects for Developing of Substitute Crop for Rice (RIMS No. 20070101033054)”, RDA, Republic of Korea.
Introduction
Genus Acorus is a monocot and a perennial aquatic herb.
This genus initially belonged to the Araceae family, but recently separated from this family and is placed in its own family Acoraceae (APG II, 2003; Grayum, 1987; Thompson, 1995). There are two Acorus species, A. calamus and A.
gramineus in Korea. A. calamus grows gregariously in marsh or shallow water. Its rhizome creeps beneath the land surface and its leaf grows erect. A. gramineus has thin rhizome and its narrow and short leaf is curved compared with A. calamus.
A. gramineus grows in the crannies of the rock and is an evergreen plant but A. calamus is a deciduous plant.
The genus Acorus is one of the best oldest plants including
two species. They are different in the morphological and ecological characteristics for adaptation to environments during the evolution. RAPD analysis using the genomic DNA showed a clear separation between the A. calamus and A. gramineus, but the analysis of chloroplast showed very close apomitic habit of genus Acorus (APG II, 2003; Duvall et al., 2008).
There have been some recent studies on the anti-cancer effect (Oh et al., 2007), antispasmodic effect (Gilani et al., 2006), anti-Alzheimer effect (Han, 2003), antioxidative activity (Ka et al., 2005), antimicrobial activity (Ghosh, 2006, Phongpaichit, 2005), insecticidal effect (Park et al., 2003), volatile flavor components (Choi, 2004), and hair protective effect (Hwang, 2004) of Acorus.
The knowledge of genetic variation and genetic similarities
CS CA
CC1
GJM IPN GCCN CC2
GH GMGY IPH
GW CHA-CHF
Unknown2 CX, CZ GX, GZ COL
A. calamus A. gramineus
C. colocasia I. pseudacorus Fig. 1. Accessions of Acorus calamus, A. gramineus, Colocasia
antiquorum and Iris pseudacorus used in RAPD and NIR analysis. zThese were purchased from a market as in Gwangju.
within individuals or populations are useful for estimating the practical value of genetic resources in a breeding program (Yűzbaşıoğlu et al., 2008). The genetic diversity study of genus Acorus is rather restricted on the study of A. gramineus in Taiwan (Liao and Hsiao, 1998) and study of A. calamus in southeast Ohio (Pai, 2005) using DNA marker system.
Near infrared spectroscopy (NIRs) is an effective method, in particular, for non-destructive analysis of sample without pre-treatment. It has been applied to cultivar identification (Li et al., 2007; Seregélya et al., 2004; Shao et al., 2007), origin discrimination (Galtier et al., 2007), viable and nonvi- able discrimination of seeds (Min and Kang, 2003; Mulualem, 2003), and differentiation and quantitative determination of various components (Bramble et al., 2006; Jaillaisa et al., 2005;
Kim et al., 2007; Liu et al., 2007).
The objective of present study was to explore the genetic diversity of genus Acorus (A. calamus and A. gramineus) by using RAPD marker system and to apply analysis of inter- and intraspecific genetic relationship. Moreover, samples were non-destructively analyzed using NIR spectroscopy for estimating diversity and relationship of genus Acorus. This study will provide fundamental information on Acorus breeding program in Korea.
Materials and Methods
Plant Materials
Thirteen A. calamus and eight A. gramineus, together with two Iris pseudacorus and one Colocasia antiquorum as outgroups were collected from various areas in Korea (Fig. 1). All collected accessions were maintained in a greenhouse at Chonnam National University.
DNA Extraction
Young leaves of 24 collected accessions were prepared for DNA extraction. They were washed with distilled water, and surface water was removed. Fifty mg of fresh leaves of each accession were collected in 2 mL tube after they were pulverized with liquid nitrogen in pestle. Genomic DNA was isolated by using Gentra Puregene Cell Kit for Plant (Qiagen Inc., USA) with minor modifications. The DNA extract was quantified by using a spectrophotometer, ND-100 (Nanodrop Tech., USA).
DNA Amplification
DNA amplifications were conducted with 10-mer primers from Bioneer Inc. (Korea) and Operon Inc. (USA). All ampli- fication reactions were performed as reported by Williams et al. (1990) with minor modification. Controls were made
by replacing DNA with water. The reaction mixtures (20 µL) contained DNA 30 ng・µL-1, dNTPs 1 mM, 10 X reaction buffer 2 µL, 10 bp random primer 10 pM, and Taq polymerase 1 unit.
A PTC-200 Peltier thermal cycler (MJ research, USA) was used with the following temperature profile: 94℃ for 2 min;
45 cycles of 94℃ for 20 sec, 36℃ for 20 sec, 72℃ for 2 min; 72℃ for 7 min; 4℃ end. PCR products were separated by electrophoresis in a 1% agarose gel made from 1 X TAE buffer included EtBr. The 1 kb DNA ladder (Bioneer Inc., Korea) was used as molecular size marker to estimate sizes of amplified PCR products. The electrophoresis was run for 1 h at 150 V. After electrophoresis, DNA band patterns were observed with a UV transilluminator and photographed with a digital camera under UV light.
NIR Spectroscopy Measurement
A total of 14 accessions, 11 principal accessions (CHA, CHB, CHC, CHD, CHE, CC1, CC2, CN, CS, CX, and CZ) of A. calamus, 1 accession (GH) of A. gramineus, and 2 accessions (IPH and IPN) of I. pseudacorus were selected to estimate the relationship of accessions by using NIRs as non-destructive analysis. Their fresh leaves were harvested, washed, and removed surface water. Then, they were cut at an interval of 1 × 1 cm. They were analyzed by using an IRPrestige-21 (Shimadzu co., Japan) attaching IntegratIR.
Table 1. Selected primers for RAPD analysis in Acorus calamus, A. gramineus, Colocasia antiquorum, and Iris pseudacorus.
Primer Sequencem (5'→3') GC content (%) Total band number
N8002 N8006 N8007 N8009 N8010 N8012 N8021 N8028 OPB15 OPC6 OPC11 OPD13
CAATCGCCGT AGCCAGCGAA GTGACGTAGG GGGTAACGCC CTGAGACGGA TACAACGAGG AATCGGGCTG CCCGCCGTTG GGAGGGTGTT GAACGGACTC AAAGCTGCGG GGGGTGACGA
60 60 60 70 60 50 60 80 60 60 60 70
42 28 32 25 28 27 32 43 23 26 42 23
Total 371
Absorption spectra were obtained from each accession slice.
Each spectrum was created by 25 scans for 3 times with 4 cm-1 of spectral resolution.
Data Analysis
The RAPD fingerprints were scored by assigning ‘1’ for the presence and ‘0’ for the absence for each genotype. Ex- cluding indistinguishable or low intensity bands, unambiguously visible and polymorphic RAPD bands were scored, and converted into a binary matrix as a raw data. The genetic distances between species were based on pair-wise comparisons and calculated according to the equation: GDxy = 1 - [2Nxy
/ (Nx+ Ny)], where Nxy is the number of fragments shared in lanes x and y, Nx the number of fragments in lane x, and Ny is the number of fragments in lane y (Nei and Li, 1979). The cluster analysis (Sneath and Sokal, 1973) was performed to construct dendrogram of genus Acorus using UPGMA (the unweighted pair-group method with arithmetical averages) with 1000 bootstrap sub-samples based on Nei’s genetic distances by using the software package TREECON (ver. 1.3b) (Van De Peer and De Wachter, 1993). The bootstrap analysis was used to measure the reliability of each branch in a dendrogram (Efron and Gong, 1983; Felsenstein, 1985).
The cophenetic correlation based on genetic distances of cluster analysis was computed as a measure of goodness of fit (Rohlf and Sokal, 1981). The principal coordinate analysis according to Gower (1966) was performed to estimate both interspecific and intraspecific relationships of genus Acorus based on the genetic distance matrix by using the procedures of the NTSYS-pc (Rohlf, 1997).
The original NIR spectral points were pre-processed 3 point baseline and smooth including program package IRsolution of IRPrestige-21 (Shimadzu co., Japan). They were transformed
into numerical values for data analysis. The principal com- ponentanalysis (PCA) was performed by using UnscramblerⓇ 9.6 trial version (CAMO Inc., India).
Results
RAPD Analysis
In order to obtain reproducible and clear banding patterns which could discriminate accessions and determine genetic relationship among genus Acorus, we tested 45 random 10-mer primers. Twelve primers, N8002, N8006, N8007, N8009, N8010, N8012, N8028, N8021, OPB15, OPC6, OPC11, and OPD13 showed polymorphism and a number of bands were scored by using primer screening (Table 1 and Fig. 2). The fragment size of RAPD products of A. calamus, A. gramineus, C. antiquorum, and I. pseudacorus were observed from 300 to 4,000 bp, 200 to 4,000 bp, 300 to 6,000 bp, and 300 to 4,000, respectively. The number of scored bands for each primer was various from 23 to 43, with an average of 31 bands per primer.
A total of 371 reproducible and polymorphic bands were scored by using 12 primers and used for statistical analysis (Table 1). A. calamus, A. gramineus, C. antiquorum, and I.
pseudacorus showed distinctive band patterns. In 24 accessions used in this study, 70-92 (on average 83) bands were scored. In A. calamus, A. gramineus, C. antiquorum, and I. pseudacorus, 83-92 (on average 87), 70-82 (on average 77), 84, and 74-76 (on average 75) bands were scored, respectively.
Genetic Diversity Analysis
In order to evaluate the genetic relationship of genus Acorus, the UPGMA cluster analysis and principal coordinate analysis were performed based on genetic distance using Nei’s coeffi-
A
B
Fig. 2. RAPD profiles obtained from Acorus calamus, A. gramineus, Colocasia antiquorum and Iris pseudacorus with the primers, OPC11 (A) and N8009 (B). CHA, CHB, CHC, CHD, CHE, CHF, CN, CA, CC1, CC2, CS, CX, and CZ: A. calamus; GC, GH, GM, GW, GX, GY, and GZ: A. gramineus; COL: C. antiquorum; IPH and IPN: I. pseudacorus; M: size marker.
Table 2. Genetic distance matrix of 24 accessions of Acorus calamus, A. gramineus, Colocasia antiquorum, and Iris pseudacorus based on Nei’s coefficients calculated from RAPD analysis.
CHA CHB CHC CHD CHE CHF CA CS CN CC1 CC2 CX CZ GM GY GJM GH GX GW GZ GC COL IPH IPN CHA 0.00
CHB 0.24 0.00 CHC 0.05 0.26 0.00 CHD 0.26 0.08 0.28 0.00 CHE 0.25 0.10 0.25 0.16 0.00 CHF 0.26 0.27 0.24 0.31 0.25 0.00 CA 0.26 0.26 0.27 0.26 0.27 0.27 0.00 CS 0.25 0.28 0.25 0.31 0.28 0.27 0.31 0.00 CN 0.22 0.25 0.24 0.28 0.26 0.30 0.26 0.22 0.00 CC1 0.25 0.30 0.24 0.30 0.31 0.26 0.29 0.24 0.18 0.00 CC2 0.26 0.27 0.27 0.28 0.25 0.22 0.26 0.27 0.22 0.21 0.00 CX 0.21 0.23 0.24 0.27 0.21 0.24 0.27 0.20 0.20 0.26 0.28 0.00 CZ 0.21 0.23 0.23 0.27 0.22 0.24 0.28 0.20 0.19 0.25 0.25 0.03 0.00 GM 0.86 0.86 0.86 0.84 0.84 0.84 0.86 0.84 0.87 0.83 0.85 0.85 0.86 0.00 GY 0.85 0.84 0.85 0.83 0.82 0.83 0.85 0.83 0.85 0.81 0.83 0.84 0.84 0.03 0.00 GJM 0.83 0.83 0.84 0.81 0.81 0.81 0.83 0.81 0.84 0.80 0.82 0.82 0.83 0.07 0.06 0.00 GH 0.85 0.85 0.85 0.83 0.83 0.83 0.85 0.83 0.85 0.82 0.84 0.84 0.85 0.06 0.09 0.09 0.00 GX 0.82 0.81 0.81 0.80 0.81 0.81 0.85 0.81 0.85 0.82 0.85 0.81 0.81 0.49 0.48 0.51 0.46 0.00 GW 0.88 0.84 0.88 0.82 0.83 0.83 0.85 0.81 0.84 0.83 0.84 0.84 0.85 0.17 0.17 0.18 0.15 0.47 0.00 GZ 0.84 0.88 0.85 0.85 0.87 0.86 0.86 0.86 0.87 0.85 0.86 0.86 0.85 0.36 0.35 0.37 0.34 0.50 0.36 0.00 GC 0.85 0.83 0.86 0.81 0.81 0.81 0.84 0.80 0.82 0.81 0.83 0.83 0.84 0.15 0.17 0.16 0.13 0.51 0.09 0.37 0.00 COL 0.83 0.79 0.82 0.80 0.82 0.86 0.87 0.86 0.82 0.82 0.82 0.80 0.80 0.90 0.90 0.89 0.90 0.87 0.91 0.90 0.92 0.00 IPH 0.90 0.90 0.89 0.88 0.91 0.91 0.87 0.86 0.90 0.89 0.89 0.89 0.89 0.85 0.85 0.86 0.87 0.91 0.87 0.88 0.87 0.89 0.00 IPN 0.91 0.92 0.90 0.89 0.93 0.93 0.89 0.88 0.91 0.90 0.90 0.90 0.90 0.86 0.85 0.87 0.87 0.92 0.87 0.88 0.89 0.88 0.11 0.00
cients calculated from RAPD data (Table 2, Figs. 3, 4, and 5). The genetic distances (GD) were calculated from 0.03 to 0.31 GD within A. calamus, from 0.03 to 0.51 GD within A.
gramineus, and 0.11 GD within I. pseudacorus. The genetic distance between A. calamus and A. gramineus was revealed to be farthest from 0.80 to 0.88 GD. The genetic distances
0.8 0.7 0.6 0.5 0.4 0.3 0.2 0.1 100%
100%
100%
100%
100%
100%
100%
100%
60%95%
94%
97%
75%
CX CZ CS HA HC CC2 CN CC1 HF CA HE HB HD COL GX GZ GW GC GH GJM GM GY IH IN
Group I
Group II A. calamus
C. antiquorum
A. gramineus
I. pseudacorus 61%
65%
Fig. 3. Dendrogram of 24 accessions of Acorus calamus, A. gramineus, Colocasia antiquorum, and Iris pseudacorus resulting from a UPGMA cluster analysis based on Nei’s genetic distances calculated from RAPD data. The bootstrap analysis was conducted using TREECON (ver. 1.3b) with 1000 bootstrap subsamples of the data matrix. Bootstrap values for those branches greater than 60% of the topologies are reported.
A. gramineus C. antiquorum A. calamus
I. pseudacorus
Fig. 4. Relationships among 24 accessions of Acorus calamus, A. gramineus, Colocasia antiquorum and Iris pseudacorus by principal coordinate analysis based on Nei’s genetic distances calculated from RAPD data. The three principal coordinate accounted for 76.33% of the total variation. PC1, PC2, and PC3: 45.04% on the first principal coordinate axis, 23.67 % on the second, and 7.66% on the third.
between A. calamus and C. antiquorum and between A.
gramineus and C. antiquorum, were 0.79 to 0.87 GD and 0.87 to 0.92 GD, respectively. I. pseudacorus was separated from A. calamus and A. gramineus with 0.86 to 0.93 GD and 0.85 to 0.92 GD, respectively. The genetic distance between C. antiquorum and I. pseudacorus were 0.88 to 0.89 GD.
In the result of cluster analysis, the dendrogram clearly separated the accessions into four distinct groups by their taxonomic classification with a bootstrap value of 100%: A.
calamus, A. gramineus, C. antiquorum, and I. pseudacorus (Fig. 3). As a result of principal coordinate analysis, three- dimensional plot was also obviously divided into A. calamus, A. gramineus, C. antiquorum, and I. pseudacorus (Fig. 4).
In the cluster analysis using the genetic distance, the matrix correlation coefficients (r) was 0.9973 (data not shown).
A. calamus group was subdivided into two subgroups with 100% bootstrap value in the dendrogram and three-dimensional plot (Figs. 3 and 5). On average, the genetic distance of two sub-groups was estimated around 0.27 GD (Table 2).
Interestingly, one of A. calamus accession (CZ) with yellow stripeof leaves was tightly grouped with another A. calamus accession, CX with 0.03 GD (Table 2, Figs. 3 and 5). On the other hand, one accession (GZ) with yellow stripeleaves within A. gramineus was separated from other accessions with on average 0.36 GD (Table 2, Figs. 3 and 5). Moreover, analysis of eight accessions of A. gramineus by RAPD markers, one accession (GX) was isolated from other A.
gramineus accessions (Figs. 3 and 4). The genetic distances between GX and other A. gramineus accessions were from 0.46 to 0.51 GD (Table 2).
The variance of the first principal coordinate accounted for 76.33% of the total variation. PC1, PC2, and PC3, accounted for 45.04%, 23.67%, and 7.66% of the total varia- tion, respectively (Fig. 4). The first and second coordinates could resolve relationship of genus Acorus, A. calamus and
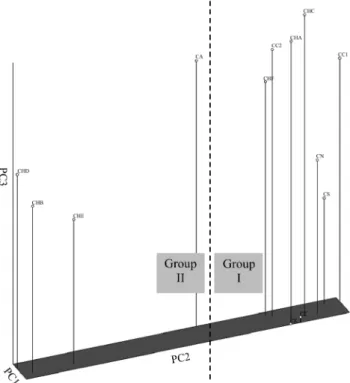
Fig. 5. Relationships among 13 accessions of Acorus calamus by principal coordinate analysis based on Nei’s genetic distances calculated from RAPD data. The three principal coordinate accounted for 85.48% of the total variation. PC1, PC2 and PC3: 77.6% on the first principal coordinate axis, 4.50% on the second, and 3.38% on the third.
Fig. 6. Plot of 14 accessions of Acorus calamus, A. gramineus, and Iris pseudacorus resulting from principal component analysis obtained from NIR.
A. gramineus, C. antiquorum was closely allocated with A.
gramineus in the first coordinate and with A. calamus in the second coordinate, respectively. Especially, the third coor- dinate could differentiate I. pseudacorus from other groups.
Non-destructive analysis by using NIR spectroscopy was applied to show its power in the diversity study of genus Acorus comparing with the result of RAPD analysis. Fourteen accessions were used for principal component analysis obtained from NIR spectral data. The two-dimensional plot was clearly divided into A. calamus, A. gramineus, and I. pseudacorus (Fig. 6). Two variances of principal components accounted for 98% of the total variation. PC1 and PC2 accounted for 84% and 14%, respectively. A. calamus accessions were separated from outgroups, A. gramineus and I. pseudacorus, by the first component (PC1). In the second component, A.
calamus could be subdivided into two subgroups, and out- groups could be also divided from A. gramineus and I.
pseudacorus. Interestingly, one accession (CZ) with yellow stripe leaves of A. calamus was allocated on the same position of CX in PC1. However, two accessions were allocated into PC2. A. gramineus was positioned in the similar point with I. pseudacorus in PC1, but they was clearly differentiated each other.
Discussion
The genus Acorus including A. calamus and A. gramineus, was previously placed within the family Araceae. But it is recently separated from the family and placed in its own family Acoraceae in order Acorales (APG II, 2003; Grayum, 1987). Molecular phylogenetic analysis suggested that Acorus is importantly sole genus of the oldest surviving line as original extant monocotyledon by sequencing chloroplast rbcL gene (Duvall et al., 1993). Duvall et al. (2008) discovered that A.
calamus and A. gramineuswere sister to each other in analysis of chloroplast, selected nuclear sequences and muligene studies.
In the present study, we investigated the genetic diversity among accessions of genus Acorus in Korea by using RAPD markers. In the dendrogram and three-dimensional plot derived from cluster analysis and principal coordinate analysis, the results showed that interspecific relationship between A.
calamus and A. gramineus was obviously elucidated with 0.80-0.88 GD (Table 2).
The intraspecific genetic distances of A. calamus and A.
gramineus were GD 0.03-0.31 (on average 0.21) and 0.03- 0.51 (on average 0.20), respectively (Table 2). The genetic distance showed relatively narrow variation below 0.3 GD on average except GX and GZ in A. gramineus. In Taiwan A. gramineus showed also less than 0.3 GD on average based on RAPD markers (Liao and Hsiao, 1998). Pai (2005) reported that A. calamus populations in southeast Ohio showed narrow genetic variation with 0.06-0.13 GD and homozygous. He suggested that A. calamus populations in southeast Ohio were primarily clonal in nature. Our results also supported this evidence. It seems that apomitic plants, intraspecies of genus
Acorus, resulted in a narrow genetic variation.
In the dendrogram of cluster analysis, A. calamus was remarkably subdivided into two subgroups (Group I and II) on average of GD 0.27 (Figs. 3 and 5). Group II had tall plant and narrow leaf width compared with Group I. The specific and distinct primers differentiated two groups in this study. As a result, we suggest that there are two ecotypes of A. calamus in Korea. It is worthwhile to study botanical, chemical, and chromosomal characteristics of two subgroups.
One accession (CZ) in A. calamus was located within this group, but the green leaves contained yellow stripe. This accession was closest to CX as a genetic distance of 0.03 (Table 2 and Fig. 3). The two accessions were not different in plant height, leaf width, and rhizome size except for yellow stripe of leaves. It gives an evidence that stripe trait (CZ) was probably generated by chimera from the normal type (CX).
On the other hand, one accession (GZ) with yellow stripe leaves within A. gramineus was separated from other accessions on average 0.36 GD. It seems that GZ might be a chimera obtained from an uncollected accession of A. gramineus. In addition, analysis of 8 accessions of A. gramineus by RAPD markers, one accession (GX) was distinctively isolated from other A. gramineus accessions. The genetic distances of GX were from 0.46 to 0.51 GD (Table 2, Figs. 3 and 4). The GX has short plant height and narrow leaf width compared with other accessions. Accessions including A. gramineus generally grow to 30-40 cm in height and 0.3-0.7 cm of leaf width. But GX is shorter than other accessions as about 10 cm tall and 0.1-0.2 cm wide. It verified clear separation compared to other lines. Further study like chloroplast DNA sequencing of GX and GZ might identify the origin of the accessions.
As a result of RAPD analysis, the cluster and principal coordinate analysis distinctly divided into four groups, A.
calamus, A. gramineus, C. antiquorum, and I. pseudacorus (Fig. 4). Remarkably, non-destructive NIR analysis separated the accessions as the result using RAPD data (Fig. 6). Lee and Kim (2005) reported that A. calamus and C. antiquorum were close with 0.37 GD. In this study, C. antiquorum and I. pseudacorus were used as outgroups. C. antiquorum was separated from A. calamus and A. gramineus with 0.79 to 0.87 GD and 0.87 to 0.92 GD, respectively. However, their study does not make a comparison with the present study due to the use of different primers. The genus Acorus is recently placed in its own family Acoraceae, separated from family Araceae (APG II, 2003; Grayum, 1987). The spathe protecting the spadix is not in existence, which supported the modification that Acorus is removed from Araceae (Ray, 1987). In addition, the genetic distances between A. calamus and
I. pseudacorus and between A. gramineus and I. pseudacorus, were 0.86 to 0.93 GD and 0.85 to 0.92 GD, respectively (Table 2). Meanwhile, Seregélya et al. (2004) computed were computed genetic distances of different melon genotypes in Hungary by DNA marker technique such as RAPD or SSR, but cultivar identification was limited. He reported that it was possible for NIRs to distinguish and identify several representative cultivars.
We conclude that the RAPD marker technique appears to be a reliable tool for identifying the genetic diversity and genetic variation in genus Acorus. Furthermore, NIR spectro- scopy using non-destructive sample analysis could be adequate to identify the diversity and relationship. This study will provide fundamental information on Acorus breeding program in Korea.
Literature Cited
Bramble, T., F.E. Dowell, and T.J. Herrman. 2006. Single-kernel near-infrared protein prediction and the role of kernel weight in hard red winter wheat. Appl. Eng. Agr. 22:945-949.
Choi, H.S. 2004. Aroma evaluation of an aquatic herb, Changpo (Acorus calamus var. angustatus Bess), by AEDA and SPME.
J. Agric. Food Chem. 52:8099-8104.
Duvall, M.R., G.H. Learn, L.E. Eguiarte, and M.T. Clegg. 1993.
Phylogenetic analysis of rbcL sequences identifies Acorus calamus as the primal extant monocotyledon. Proc. Natl.
Acad. Sci. USA 90:4641-4644.
Duvall, M.R., J.W. Robinson, J.G. Mattson, and A. Moore. 2008.
Phylogenetic analysis of two mitochondrial metabolic genes sampled in parallel from angiosperms find fundamental inter- locus incongruence. Amer. J. Bot. 95:871-884.
Efron, B. and G. Gong. 1983. A leisurely look at the bootstrap, the jacknife, and cross-validation. Amer. Stat. 37:36-48.
Felsenstein, J. 1985. Confidence limits on phylogenies: an approach using the bootstrap. Evolution 39:783-791.
Galtier, O., N. Dupuy, and Y. Le Dreau. 2007. Geographic origins and compositions of virgin olive oils determinated by chemo- metric analysis of NIR spectra. Analytica. Chimica. Acta.
595:136-144.
Gilani, A.H., A.J. Shah, M. Ahmad, and F. Shaheen. 2006. Anti- spasmodic effect of Acorus calamus Linn. is mediated through calcium channel blockade. Phytother. Res. 20:1080-1084.
Ghosh, M. 2006. Antifungal properties of haem peroxidase from Acorus calamus. Annal. Bot. 98:1145-1153.
Gower, J.C. 1966. Some distance properties of latent root and vector methods used in multivariate analysis. Biometrika 53:
325-338.
Grayum, M.H. 1987. A summary of evidence and arguments supporting the removal of Acorus from the Araceae. Taxon.
36:723-729.
Han, W.J. 2003. Comparative effects of Radix polygalae and rhizoma Acorus graminei on CT105-induced neuroblastoma cell lines. Wonkwang Univ., Korea p. 1-31.
Hwang, M.S. 2004. Hair protective effect of water extracts from
Acorus calamus leaf. Catholic Univ., Korea p. 1-24.
Jaillaisa, C., R. Pintob, A.S. Barrosb, and D.N. Rutledge. 2005.
Outer-product analysis (OPA) using PCA to study the influence of temperature on NIR spectra of water. Vibrat. Spectros.
39:50-58.
Ka, M.H., E.H. Choi, H.S. Chun, and H.G. Lee. 2005. Antioxidative activity of volatile extracts isolated from Angelica tenuissimae roots, peppermint leaves, pine needles, and sweet flag leaves.
J. Agric. Food Chem. 53:4124-4129.
Kim, K.S., S.H. Park, M.G. Choung, and Y.S. Jang. 2007. Use of near-infrared spectroscopy for estimating fatty acid com- position in intact seeds of rapeseed. J. Crop Sci. Biotech.
10:15-20.
Lee, J.S. and B.M. Kim. 2005. Analysis of genetic relationship among Arisaema species using RAPD. Kor. J. Hort. Sci.
Technol. 23:459-464.
Li, X., Y. He, and H. Fang. 2007. Non-destructive discrimination of Chinese bayberry varieties using vis/NIR spectroscopy. J.
Food Eng. 81:357-363.
Liao, L.C. and J.Y. Hsiao. 1998. Relationship between population genetic structure and riparian habitat as revealed by RAPD analysis of the rheophyte Acorus gramineus Soland. (Araceae) in Taiwan. Mol. Ecol. 7:1275-1281.
Liu, Y.D., Y.B. Ying, and X. Fu. 2007. Experiments on predicting sugar content in apples by FT-NIR technique. J. Food Eng.
80:986-989.
Min, G.T. and W.S. Kang. 2003. Nondestructive separation of viable and nonviable gourd (Lagenaria siceraria) seeds using single seed near infrared spectroscopy. J. Kor. Soc. Hort. Sci.
44:545-548.
Mulualem, T. 2003. Characterization of forest tree seed quality with near infrared spectroscopy and multivariate analysis.
Swedish Univ. Sweden p. 1-43.
Nei, M. and W.H. Li. 1979. Mathematical model for studying genetic variation in terms of restriction endonucleases. Proc.
Natl. Acad. Sci. USA 76:5269-5273.
Oh, C.H., N.S. Kim, K.H. Lee, T.H. Kim, J.B. Bae, S.G. Kim, H. Jeon, J.P. Kim, T.Y. Shin, C.H. Lee, S.I. Jeong, and, J.
Kwon. 2007. Immuno-regulatory and anti-cancer effect of Acorus gramineus Solander. Kor. J. Oriental. Physiol. Pathol.
21:869-873.
Pai, A. 2005. The population ecology of a perennial clonal herb Acorus calamus L. (Acoraceae) in southeast Ohio, USA.
Ph.D. Diss. Ohio Univ., USA p. 1-153.
Park, C., S.I. Kim, and Y.J. Ahn. 2003. Insecticidal activity of asarones identified in Acorus gramineus rhizome against three coleopteran stored-product insects. J. Stored Prod. Res.
39:333-342.
Phongpaichit, S., N. Pujenjob, V. Rukachaisirikul, and M. Ongsakul.
2005. Antimicrobial activities of the crude methanol extract of Acorus calamus Linn. Songklanakarin J. Sci. Technol.
27:517-523.
Ray, T.S. 1987. Leaf types in the Araceae. Amer. J. Bot. 74:
1359-1372.
Rohlf, F.J., 1997. NTSYS-pc numerical taxonomy and multivariate analysis system, ver. 2.0. Exeter Pub., New York.
Rohlf, F.J. and R.R. Sokal. 1981. Comparing numerical taxonomic studies. Systematic Zool. 30:459-490.
Seregélya, Z., T. Deák, and G.D. Bisztrayö. 2004. Distinguishing melon genotypes using NIR spectroscopy. Chemom. Intell.
Lab. Syst. 72:195-203.
Shao, Y., Y. He, A.H. Gómez, A.G. Pereir, Z. Qiu, and Y. Zhang.
2007. Visible/near infrared spectrometric technique for nonde- structive assessment of tomato ‘Heatwave’ (Lycopersicume sculentum) quality characteristics. J. Food Eng. 81:672-678.
Sneath, P.H.A. and R.R. Sokal. 1973. Numerical taxonomy: the principles and practice of numerical classification. San Francisco:
W.H. Freeman. p. 573.
The Angiosperm Phylogeny Group (APG II). 2003. An update of the angiosperm phylogeny group classification for the orders and families of flowering plants. Bot. J. Linn. Soc.
141:399-436.
Thompson, S.A. 1995. Systematics and biology of the Araceae and Acoraceae of temperate NorthAmerica. PhD diss., Illinois Univ., Urbana-Champaign. p. 124-127.
Van De Peer, Y. and R. De Wachter. 1993. TREECON: a software package for the construction and drawing of evolutionary trees.
Comput. Applic. Biosci. 9:177-182.
Williams, J.G.K., A.R. Kubelik, K.J. Livak, J.A. Rafalski, and, S.V. Tingey. 1990. DNA polymorphisms amplified by arbitrary primers are useful as genetic markers. Nucleic Acids Res.
18:6531-6535.
Yűzbaşıoğlu, E., M.Y. Dadand, and S. Őzcan. 2008. Natural hybridization between Phlomislycia D. Don × P. bourgaei Boiss., (Lamiaceae) revealed by RAPD markers. Genetica 133:13-20.