논문 2011-4-5
무선센서네트워크 기반의 자율 실내 조명 제어 시스템
Autonomous Indoor Lighting Device Control System Based on Wireless Sensor Network
이슬람 엠디 타히둘*, 구인수**
Mr. Tahidul Islam, Insoo Koo
요 약 본 논문에서는 실내 전력소모를 효율적으로 줄이기 위하여, 무선센서네트워크 기반의 자율 실내조명 제어 시 스템을 제안한다. 제안된 시스템에서는 먼저 출입문에 부착된 수동 적외선 (Passive Infrared: PIR) 센서를 이용하여 각 출입문을 통해 실내로 들어오고 나아가는 사람 수를 감지하다. 각 출입문에서 측정된 센서 값들은 무선센서네트워크 를 통해 중앙 제어장치로 전송된다. 중앙제어장치는 전송된 센서 값을 이용하여 실내에 사람의 존재 유무를 파악할 수 있는 제어 알고리즘을 통해 실내조명을 자율적으로 제어 한다. 비용분석 및 시뮬레이션을 통해 제안된 시스템이 일상생활에 적용될 경우 약 20%의 전기소모를 절약할 수 있음을 보였다.
Abstract In this paper, we propose an autonomous Indoor lighting control system in which indoor lighting devices are autonomously controlled such that electricity bills are minimized in our daily life. Our focus is to utilize Passive Infrared (PIR) sensors to detect the presence of human being indoor and automatically to control indoor lighting electric devices. A control algorithm is also devised to control the whole system. We justify the proposed system by demonstrating specific applications in our everyday life. Cost survey and experimental results also demonstrate the efficiency of the proposed system in real life.
Key Words : Indoor lighting device, autonomous control system, passive infrared sensor, wireless sensor network.
*준회원, 울산대학교, 전기공학부
**정회원, 울산대학교, 전기공학부 (교신저자) 접수일자 2011.5.23, 수정일자 2011.7.5 게재확정일자 2011.8.12
Ⅰ. Introduction
A wireless Sensor Network (WSN) is a wireless network that consists of several sensors to monitor physical or environmental conditions such as temperature, lighting, sound, vibration, pressure, motion or pollutant at different locations. Wide varieties of these applications have been enabled by the promise of inexpensive networks of wireless sensors. Dramatic advances in communication
systems, micro-electro mechanical systems (MEMS), and Integrated Circuit (IC) design reduce the cost of sensor nodes, which in turn enables the use of large scale WSN for a variety of monitoring and controlling of applications [1].
In recent time, WSNs have been applied to energy conservation applications such as light control [2] - [5]
. In the reference [2], authors proposed a light control system that considers both users’ preferences and energy conservation. However, in the system the basic limitation is that users must carry light sensors to measure their current light intensities.
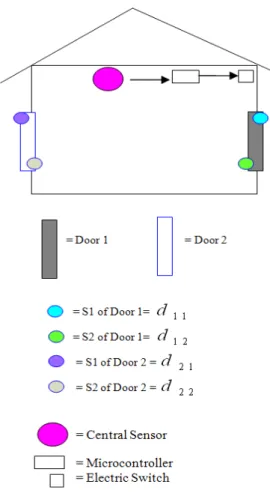
그림 1. 제안된 시스템의 예시도.
Fig. 1. An example for the proposed system.
In the reference[3], a WSN-based intelligent light control system for indoor environments is intended.
The whole system that was proposed in the reference[3] also requires control hosts to control the system, which are complicated and costly. Other possible applications of WSN include smart home applications[6], living space[7], environmental monitoring
[8],[9]
, etc. There are some alternatives such as vibration sensors, thermal sensors, etc. for detecting human presence in indoor environment. Unfortunately, such approaches still cannot provide satisfactory solutions to consider both user comfort and cost minimization so far.
This paper presents application of WSN to control
indoor electric devices at home, office or similar environment. Based on the controlling of electricity, this scheme provides the service of saving our electricity. For example, we have considered an environment of one room having two doors. A system model of this environment is shown in Fig. 1. At every door, two PIR sensors are set up, where one for detecting peoples’ entering into the room and another is to detect peoples’ exiting from the room. After getting the signal, all signals sensed by the sensors are sent to central sensor and central sensor sends signal to micro-controller to control the electric devices by a control algorithm.
Rest of the paper is structured as follows. Section II introduces the system model. Section III presents our control algorithm, Section IV deduces cost minimization, and Section V contains simulation result. Conclusions are drawn in Section VI.
Ⅱ. System Model
In order to illustrate the proposed system model, we consider a room having n number of doors. Each door has total two sensors. Thus the entire number of sensors is two times of total number of doors in the room, i.e. (2*n). Each sensor has a response to indicate the number of people in the room. Overall, we define a general matrix to summarize the responses of all sensors of the room, which is as follows:
(1)
The matrix has (i, j) entry where (i= 1 to n) and (j=1 to 2). In matrix , the entry designates
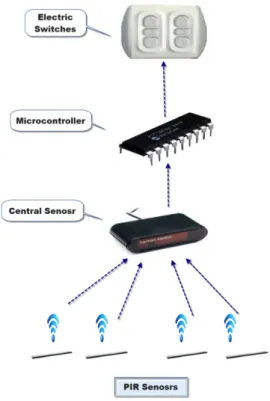
그림 2. 제안된 시스템의 전체 구성도.
Fig. 2. Architecture of the proposed system.
sensor (S1) and the entry specifies
sensor (S2) at the door. Since every door has two sensors, we utilized the S1 of each door to detect entering of people into the room and the S2 to detect exiting of people from the room (sensor’s detecting procedure will be clarified in later section). The response of S1 at all doors, which is denoted by
can have the value zero for no signal or greater than zero for any signal such that
≥ . On the other hand, the response of S2 at all doors, which is denoted by can have the value zero for no signal or smaller than zero for any signal such that ≤ .
To demonstrate a simplified model, we assume two doors (n=2) in the room. Therefore, the simplified form can be articulated by the following matrix,
(2)
If any person enters into the room by door1, then the response of S1 of door1 i.e. will be one, for two people’s entering in the room by door1 i.e.
will be two and so on. Again, if any person exits by door1 then the response of S2 of door1 i.e. will be one, for two people’s exiting from the room
will be two and so on. Moreover, if any person enters by door2 then the response of S1 of door 2 i.e.
will be one, for two people’s entering into the room
will be two and so on. Furthermore, if any person exits by door2 then the response of S2 of door2 i.e.
will be one, for two people’s exiting from the room will be two and so on.
For the above example, no people’s entering into the room can be expressed by the following summation,
(3)
In addition, for one or more people’s entering into the room the response can be conveyed by the following summation,
(4)
For example, let us assume that, one person enters through door2, so = 1 and if that person exits through door1 then = -1, which forms the matrix we get,
(5)
For the above case the response of all sensors,
, which indicates no person is at room.
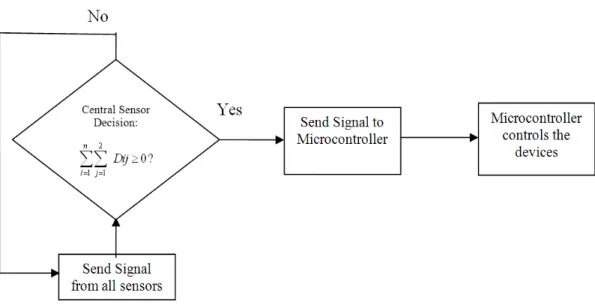
그림 3. 실내 조명 장치를 제어하기 위한 제안된 제어 알고리즘의 전체 흐름도.
Fig. 3. The flow chart of the control algorithm to handle with lighting devices.
In addition to that, let us assume that two people enter through the door2, thus = 2. If one person exits through the door1 then = -1. In this case the matrix is
(6)
Here
, which indicates one
person is still now at room.
In general, people’s absence for all doors can be stated as,
(7)
Furthermore, for one or more peoples presence at home for all doors can be stated as,
(8)
Ⅲ. Control Algorithm
In this model, Passive infrared (PIR) sensor is utilized. All objects constantly exchange thermal energy in the form of electromagnetic radiations with their surroundings. The characteristics of the radiations depend on the object and its surroundings’
absolute temperature and can be analyzed using black body radiations curve governed by Plank’s law [11]. Human bodies also emit radiation and the wavelength of these radiations can be calculated using Wien’s law, which is given by (9),
(9)
where is wavelength of the emission in nanometer, is absolute temperature in K.
Substituting = 310 K (370 C normal human body temperature) in (9), yields a value for of 9348 nm or approximately 10 μm. In fact, radiation from the human body is considered to lie in the range of 8-14 μm, hence infrared sensors that are sensitive in this range would be able to detect humans within their
detection area. The standard infrared detectors photodiodes, phototransistors etc. work well outside this range, hence not suitable for human detection. A patterned fresnel lens or a mirror is placed in front of the infrared sensor that is sensitive to the radiations emitted by human bodies. The passive infrared sensor works on the principle of pyro-electricity. The principle is based on the fact that certain crystals become electrically charged when their temperature changes. They are essentially capacitors whose dielectric is made from a crystal that has been spontaneously polarized. When the dielectric absorbs infrared radiations, increase in temperature reduces the polarization and the voltage across the sensor changes [10].
As stated before, there are two sensors at every door. The S1 at every door is set up near the outer position of door and the S2 is set up near the inner position of door by keeping small distance between them. When any person enters through the door, S1 gets the signal first and S2 gets the signal after few milliseconds (according to the velocity of person). By comparing the both signals in time delay the S1 decides that any person enters through the door, So S1 value increased by 1 i.e. the response of S1 at any door, =1 (n=1 for door1 or 2 for door2). If another person enters then there is a very small gap between two persons, thus sensors do not get signal in this gap and sensors decide that again another person enters. So S1 value increased by one again i.e. the response of S1 at any door, = 2 (i=1 and 2 for door1 and door2 respectively and so on). Now when any person exits, S2 gets the signal first and S1 gets the signal later. By comparing the signals of both sensor, S2 detects that one-person exits i.e. = -1 (i=1 for door1 or 2 for door2 and so on).
There is a central sensor at every room. The topology that is used here is star topology. If any sensor gets the signal, it sends to central sensor and it decides by summing the results of every sensor (as stated before), therefore central sensor sends signal to
micro-controller, which controls the electric device/devices. If any person stops at door and does not enter, by comparing the signals (with 1st and 2nd sensors) sensors can apprehend the person’s not entering through the door.
According to the Eqn.(1), from all sensors if central
sensor gets
, then it decides that,
no people is in the room. Thus, it sends signal to micro-controller, and the micro-controller controls the electric devices to switch off.
In addition to that, from all sensors if central sensor
gets
then it decides that, one or
more people is in the room. Therefore, the signal is transmitted to micro-controller and devices are switched on by getting this signal.
Ⅳ. Cost minimization
A 100-watt bulb when used for 10 hours consumes 1 Kilo Watt/Hour or one unit of electricity (100 watt*10 hours =1000 watt/H =1K Watt/H=1Unit). It is assumed that for domestic consumer, 1 Unit costs 0.05172 $ and for commercial user 1 Unit costs 0.08714 $ including vat. If we properly and economically use our household electrical appliances, we can save our electricity bill by minimum 20%.
Again, our household equipment will last more. The load shedding will be minimized and the country as a whole will be benefited.
In our model it is supposed a building that has six floors, every floor has five flats, every flat has three rooms and each room has two electric bulb of each 100 watt/H and one electric fan of 100 watt/H.
According to the above measurement it is obtained 270 electric devices at every building each consuming 100 watt/H. Every day (in 24 hours), it is considered that device active time is 20 hours i.e. in 24 hours the devices are used for 20 hours. Therefore, the total
electricity consumption in a day by all devices in a building is 540 K. Watt/H. The electricity consumption is clarified in the Table 1: The electricity bill (US$) measurement is also illustrated in Table 2:
Day Electricity Consumption 1 270*2=540 K. Watt/H 7 540*7=3780 K. Watt/H 30 540*30=16200 K. Watt/H 60 540*60=32400 K. Watt/H 365 540*365=197100 K. Watt/H Therefore, the 20% of total consumption in year
= 39420 K. Watt/H.
표 1. 전기 소비량 측정.
Table 1. Electricity consumption measurement
Day Electricity Bill (US$) 1 270*2=540*0.67554=364.791 US$
7 540*7=3780*0.67554=2553.54 US$
30 540*30=16200 *0.67554=10943.75 US$
60 540*60=32400*0.67554 =21884.26
365 540*365=197100*0.67554
=133148.94 US$
Therefore, the 20% of total consumption in year
=26629.79 US$.
표 2. 전기 요금 측정.
Table 2. Electricity bill measurement.
그림 4. 제안된 시스템의 전기 소비량.
Fig. 4. Electricity consumption of the proposed system.
Ⅴ. Simulation Result
We exploit some simulations to verify our result. In Fig. 4, it is shown electricity consumption, as stated before, in our system it is considered only 3 electric devices, each having power consumption of 100 Watt/H. There are total 270 electric devices in a building, each having power consumption of 100 Watt/H.
There are three curves in Fig. 4 where first one (with blue color) indicates usual electricity consumption without controlling electricity wastage, 2nd curve (with cyan color) points up reduced electricity consumption if wastage is controlled and the 3rd curve (with red color) illustrates total power saving at different duration in a building. From the Fig .4, it is explicated apparently that electricity consumption is saved by the amount of 108 K.
Watt/H, 756 K. Watt/H, 3240 K. Watt/H and 39420 K.
Watt/H in a day, a week, one-month and one year respectively.
그림 5. 제안된 시스템의 전기 요금량.
Fig. 5. Electricity bill of the proposed system.
Fig. 5 illustrates calculation of electricity bill in US$
at different schemes. The Fig. 5 contains three curves as well, where first one (with blue color) exemplifies usual electricity bill without controlling electricity devices, 2nd curve (with cyan color) indicates reduced
electricity bill if wastage is controlled and the 3rd curve (with red color) illustrates total electricity bill at different duration in a building. From the Fig. 5, it is clear that electricity consumption in a building is saved by the amount of 72.95 US$, 510.708 US$, 2188.4256 US$ and 26625.844 US$ in a day a week, one month and one year respectively.
Ⅵ. Conclusion
We have demonstrated an autonomous electric device control system for indoor environment by using PIR sensor. Control algorithm is proposed for controlling the system. We evaluate our simulation result for usual electricity consumption and saving under different configurations, which demonstrates the efficiency of the system. If we properly and economically use our household electrical appliances, we can save our electricity bill minimum 20% by using the proposed system.
References
[1] M. Youssef, and N. El-Sheimy, “Wireless sensor network: research vs. reality design and deployment Issues,” Fifth Annual Conference on Communication Networks and Services Research (CNSR'07), 2007.
[2] L.-Wu Yeh, C.-Yen Lu, C.-Wai Kou, Y.-Chee Tseng, and C.-Wei Yi, “Autonomous Light Control by Wireless Sensor and Actuator Networks,” IEEE Sensors Journal, Vol. 10, No. 6, June 2010.
[3] M.-S. Pan, L.-W. Yeh, Y.-A. Chen, Y.-H. Lin, and Y.-C. Tseng, “A WSN-based intelligent light control system considering user activities and profiles,” IEEE Sensors J., vol. 8, pp. 1710–1721, 2008.
[4] H. Park, M. B. Srivastava, and J. Burke, “Design
and implementation of a wireless sensor network for intelligent light control,” in Proc. Int. Symp.
Inf. Process. Sensor Networks (IPSN), 2007, pp.
370–379.
[5] V. Singhvi, A. Krause, C. Guestrin, J. H. Garrett, and H. S. Matthews, “Intelligent light control using sensor networks,” in Proc. ACM Int. Conf.
Embedded Networked Sensor Syst. (SenSys), 2005, pp. 218–229.
[6] Y.-Ping Tsou, J.-Wei Hsieh, C.-Ting Lin, C.-Yu Chen, “Building a remote supervisory control network system for smart home applications,”
IEEE International Conference on Systems, Man, and Cybernetics October 8-11, 2006, Taipei, Taiwan
[7] X. Wang, J. S. Dong, C. Chin, S. Hettiarachchi, and D. Zhang, “Semantic space: An infrastructure for smart spaces,” IEEE Pervasive Computing, vol. 3, no. 3, pp. 32–39, 2004.
[8] A. Mainwaring, D. Culler, J. Polastre, R. Szewczyk, and J. Anderson, “Wireless sensor networks for habitat monitoring,” in Proc. ACM Int. Workshop on Wireless Sensor Networks and Appl. (WSNA), 2002, pp. 88–97.
[9] G. Werner-Allen, J. Johnson, M. Ruiz, J. Lees, and M. Welsh, “Monitoring volcanic eruptions with a wireless sensor network,” in Proc. Eur. Workshop on Sensor Networks (EWSN), 2005, pp. 108–120.
[10] A. R Kaushik, B. G celler, “ Characterization of passive infrared sensors for monitoring occupancy pattern,” Proceedings of the 28th IEEE, EMBS Annual International Conference, New York City, USA, Aug 30-Sept 3, 2006.
[11] M. Plank, On the law of distribution of energy in the normal spectrum. Annalen der Physik, 1901.
4: p. 533.
저자 소개
Mr. Tahidul Islam 이슬람 엠디 타히둘(준회원)
∙ 2008년 International Islamic University Chittagong (IIUC) 졸업 (학사)
∙ 2011년 ~ 현재 : 울산대학교 전기공 학부 석박사통합과정
<주관심분야 : 사물간통신, 스마트그리 드>
구 인 수 (정회원)
∙ 1996년 : 건국대학교 전자공학과 졸 업 (학사)
∙ 1998년 : 광주과학기술원 정보통신공 학과 졸업(석사)
∙ 2002년 : 광주과학기술원 정보통신공 학과 졸업(박사)
∙ 2005년 ~ 현재 : 울산대학교 전기공 학부 교수
<주관심분야 :무선 센서네트워크, 무선인지시스템>