J. Kor. Soc. Fish. Tech., 44(1), 20 30, 2008 DOI:10.3796/KSFT.2008.44.1.020
Evaluation of biodegradability according to bait type for crab pots
Byung Gon JEONG, Ho Young CHANG1* and Jae Geun KOO2
Environmental Engineering Major, Kunsan National University, Kunsan, Jeonbuk, 573-701, Korea
1Marine Scinece & Production Major, Kunsan National University, Jeonbuk, 573-701, Korea
2Food Science & Biotechnology Major, Kunsan National University, Jeonbuk, 573-701, Korea
In order to evaluate the biodegradability of bait used in the pot for swimming crab, water tank experiments were conducted. Mackerel is the most commonly used natural form of bait to catch the swimming crabs, and therefore was used in this experiment for the biodegradability according to the manufacturing process of the bait. From the biodegradability test on chemical oxygen demand(COD), total nitrogen(T N), total phosphorus(T P), ammoniac nitrogen, nitrite nitrogen and nitrate nitrogen per unit weight of the bait based on the production rate and the accumulated amount of pollutants, it was concluded that the smaller the size of the mackerel pieces, the higher the production rate and accumulated amount of organic matter and nutrients which was unfavorable to water pollution. The amount of pollutants released from the intestine of the tuna was similar with that from the whole mackerel. For the operation period of 111 days, the accumulated concentrations of tested pollutants from the tuna which were 67.3 mgCOD/g d, 86.4 mgT N/g d, 3.1 mgT P/g d, were almost half comparing with those from the mackerel which were 65.7 94.4 mgCOD/g d, 83.8 109.4 mgT N/g d, 3.1 5.2 mgT P/g d. The amount of pollutants released from the intestine of the tuna was slightly less than that from the mackerel that was cut into 8 pieces. but more than that from the mackerel which was not cut into pieces. Therefore, it can be concluded that the key factor in determining water pollution potential is not the kind of bait, but the processing or preparation method used.
Key words : Biodegradability, Swimming crab, Pot, Bait, Water tank experiment
*Corresponding author: [email protected], Tel: 82-63-469-1819, Fax: 82-63-469-1811
,
,
,
(Chang et al., 2003).
(Ko and Kim, 1984; Ko and Kwon, 1987;
Kim and Ko, 1987a, 1987b, 1990a, 1990b, 1990c).
. ,
(Kim and Lee, 1990; Seo et al., 1977; Youm et al., 1990a, 1990b).
3 6 ,
,
,
.
, ,
.
, . ,
,
.
.
.
,
. ,
.
,
.
,
. ,
Table 1
5 , . ,
(A 1)
(A 2) .
A 1 2 (A
3), 4 (A 4), 8 (A 5)
.
(B 1) ,
.
28cm
, 275g .
.
10l
. 12 ,
1m3/m2 day .
,
1 m/d
.
.
Fig. 1 .
15
.
(aeration) (DO)
. Standard
method(APHA, 1998) ,
Table 2 .
,
, 111 .
pH DO Table 3 .
Table 1. Shape of natural bait(mackerel)
Classification Bait type Weight(g)
A 1 Raw fish 55.03
A 2 Removing fish skin 61.14
A 3 2 pieces 53.31
A 4 4 pieces 51.44
A 5 8 pieces 54.17
B 1 Tuna s intestines 61.45
Table 2. Analytical method and instruments
Item Analytical method Analytical instruments
Temp.( ) Electrometric method YSI 85 DO meter
pH Electrometric method ORION 920A pH meter
DO(mg/l) Electrometric method YSI 85 DO meter
COD Acidic potassium permanganate method
NH4 N Indophenol method CARY 1E
NO2 N Diazotization method CARY 1E
NO3 N Brucine method CARY 1E
T N UV VIS spectrophotometric method CARY 1E
PO4 P Ascorbic acid method CARY 1E
T P Ascorbic acid method CARY 1E
Fig. 1. Schematic diagram of experimental unit.
160mm
550mm Sampling port
Influent
Aeration pump Bait
Fig. 2 .
COD 5
,
. , ,
A 1,
A 2, 2 4 A 3
A 4 Table 3. Range of pH and DO during experiments
Classification pH DO(mg/l)
A 1 7.19 4.46 2.21 4.62 [3.11]
A 2 6.99 7.4 51.47 3.69 [2.88]
A 3 7.16 7.7 02.74 4.87 [3.39]
A 4 7.03 7.4 21.76 4.80 [2.64]
A 5 7.09 7.4 22.35 2.89 [2.62]
B 1 7.04 8.2 11.22 4.63 [2.65]
* [ ] : mean value
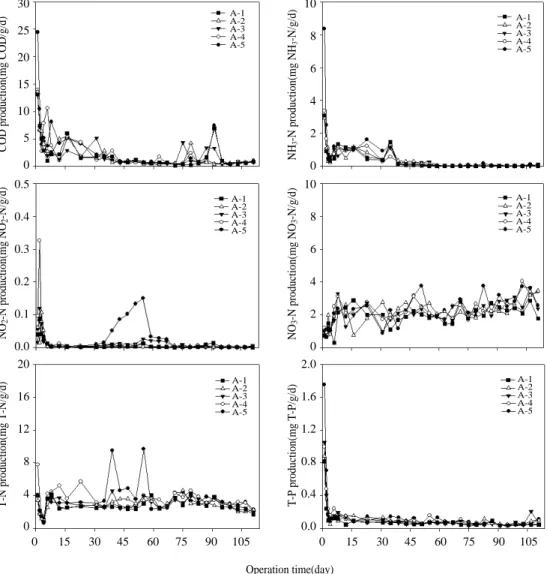
Fig. 2. Variation of pollutant loading according to operation time and preparation method of mackerel bait.
30 25 20 15 10 5 0
COD production(mg COD/g/d) NH3-N production(mg NH3-N/g/d)
NO2-N production(mg NO2-N/g/d) NO3-N production(mg NO3-N/g/d)
T-N production(mg T-N/g/d) T-P production(mg T-P/g/d)
Operation time(day) 0.5
0.4 0.3 0.2 0.1 0.0 20 16 12 8 4 0
2.0 1.6 1.2 0.8 0.4 0.0 10 8 6 4 2 0
0 15 30 45 60 75 90 105 0 15 30 45 60 75 90 105
10 8 6 4 2 0
A-1 A-2 A-3 A-4 A-5
A-1 A-2 A-3 A-4 A-5
A-1 A-2 A-3A-4 A-5
A-1 A-2 A-3 A-4 A-5
A-1 A-2 A-3 A-4 A-5
A-1 A-2 A-3 A-4 A-5
(13.1 14.0 mgCOD/g d)
, 8 A 5
2 24.4 mgCOD/g d .
, 1 mgCOD/g d
,
A 1 43
, 39
. (NH3 N)
, 0.05 0.2 mg/l (Colt &
Amstrong, 1981; Colt & Tchobanoglous, 1978).
5 1
,
.
1 , A 5 8.4 mgNH3/
g d ,
(2.94 3.36
mgNH3/g d) ,
. (NO2 N)
.
0.012 mg/l (Westin, 1974)
. Fig. 2
5 ,
.
(NO3 N)
, Colt & Tchobanoglous
(1978) 96 hr LC50 1,000
2,000 mg/l .
2 mg/g d
.
,
.
(T N) ,
75 . ,
,
. (T P)
,
.
Fig. 3 .
A 1 A 2
.
2 , 4
A 3, A 4 1
13 mgCOD/g d
, 8 A 5 COD
. 111 COD
, A 1 65.7
mgCOD/g d , A 2, A 3, A 4 67.6, 69.8, 75.4 mgCOD/g d
COD
, A 5 94.4 mgCOD/g
d .
COD .
111 , A 1
A 2 12.11 12.11mgNH3 N/g d
. A 3, A 4, A 5 13.25,
13.70, 20.92 mgNH3 N/g d COD
.
0.32
mgNO2 N/g d , A 2, A 3, A 4,
A 5 0.35, 0.44, 0.65, 0.87mgNO2
N/g d
.
, 111
Fig. 3. Profile of accumulative pollutant loading according to time depending on preparation method of mackerel bait.
A-1 A-2 A-3 A-4 A-5
A-1 A-2 A-3 A-4 A-5
A-1 A-2 A-3 A-4 A-5 A-1
A-2 A-3 A-4 A-5
A-1 A-2 A-3 A-4 A-5
A-1 A-2 A-3 A-4 A-5
Cumulative COD production (mg COD/g/d) Cumulative NH3-N production (mg NH3-N/g/d)
100 80 60 40 20 0
24 20 16 12 8 4 0
Cumulative NO2-N production (mg NO2-N/g/d)
Operation time(day) Cumulative NO3-N production (mg NO3-N/g/d) 1.0
0.8 0.6 0.4 0.2 0.0
80
60
40
20
0
Cumulative T-N production (mg T-N/g/d) Cumulative T-P production (mg T-P/g/d)
120 100 80 60 40 20 0
6 5 4 3 2 1 0
0 15 30 45 60 75 90 105 0 15 30 45 60 75 90 105
A 1 56.9 mgNO3 N/g
d A 2, A 3, A 4, A 5
63.4, 63.7, 67.7, 68.1 mgNO3 N/g d
.
A 1, A 2
83.8 85.6 mgT N/g d , A 3, A 4, A 5 89.8, 106.3, 109.4 mgT N/g d
, .
COD A 1
A 5
A 1 3.08 mgT P/g d, A 2 3.51 mgT P/g d , A 3, A 4, A 5 3.80, 4.21, 5.17 mgT P/g d
.
A 1 A 5
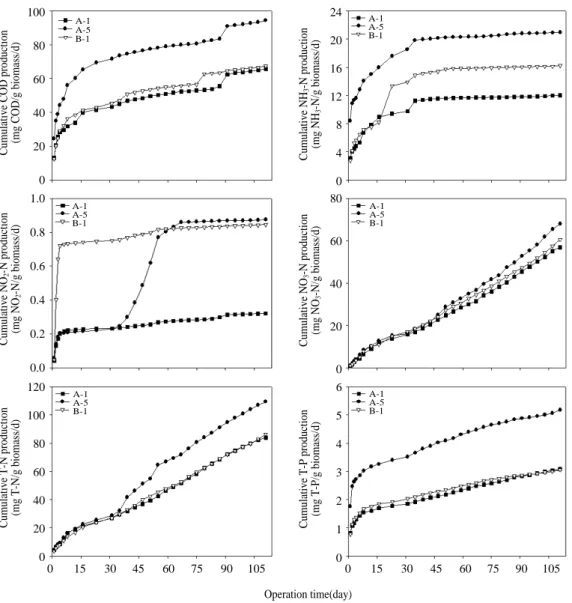
B 1 . Fig. 4
, Fig. 5
.
Fig. 4 , COD
B 1 12.6 mgCOD/g
d A 1 13.2 mgCOD/g d
, A 5 24.4 mgCOD/g d
. , 1 mgCOD/g d
A 5 39 , A 1
B 1 43
. Fig. 5
, COD, T
N, T P A 1
,
A 1 A 5
,
A 5 . , COD
111 B 1 67.3
mgCOD/g d, A 1 65.7 mgCOD/g d
A 5 94.4 mgCOD/g d . T N
B 1 86.4 mgT N/g d, A 1
83.8 mgT N/g d A 5 109.4
mgT N/g d . T P B 1
3.1 mgT P/g d, A 1 3.1 mgT P/g d
A 5 5.2 mgT P/g d .
, B 1 16.3
mgNH3 N/g d A 1 12.0 mgNH3 N/g d A 5 20.9 mgNH3 N/g d
, B 1
60.6 mgNO3 N/g d A 1 56.9
mgNO3 N/g d A 5 68.1 mgNO3 N/g
d .
B 1 0.8 mgNO2 N/g d A 5 0.9 mgNO2 N/g d , A 1 0.3 mgNO2 N/g d
.
,
A 1 B 1 3.1 2.3 mgNH3
N/g d , A 5 8.4 mgNH3
N/g d 2.7 .
0.1 mgNH3
N/g d
, B 1 55
, A 1 43 , A 5
39
. ,
.
B 1 3.4 mgT N/g d A 1
4.0 mgT N/g d, A 5 4.1 mgT N/g d ,
A 5 A 1
.
B 1 A 1
. ,
A 1
, 8 A 5
.
Fig. 4. Variation of pollutant loading depending on operation time between 2 different traits made of mackerel and tuna intestines.
COD production(mg COD/g/d)
30 25 20 15 10 5
0 NH-N production(mg NH-N/g/d)33
10 8 6 4 2 0
NO2-N production(mg NO2-N/g/d) 0.5 0.4 0.3 0.2 0.1
0.0 NO-N production(mg NO-N/g/d)33
10 8 6 4 2 0
T-N production(mg T-N/g/d)
16 14 12 10 8 6 4 2 0
T-P production(mg T-P/g/d)
2.0 1.6 1.2 0.8 0.4 0.0
Operation time(day)
0 15 30 45 60 75 90 105 0 15 30 45 60 75 90 105
A-1 A-5 B-1
A-1 A-5 B-1
A-1 A-5 B-1
A-1 A-5 B-1 A-1 A-5 B-1 A-1 A-5 B-1
.
.
COD
T N, T P, ,
,
111 ,
Fig. 5. Profile of accumulative pollutant loading depending on operation time between 2 different traits made of mackerel and tuna intestines.
A-1 A-5 B-1
A-1 A-5 B-1
A-1 A-5 B-1 A-1
A-5 B-1
A-1 A-5 B-1
A-1 A-5 B-1
Cumulative COD production (mg COD/g biomass/d) Cumulative NH3-N production (mg NH3-N/g biomass/d)
100 80 60 40 20 0
24 20 16 12 8 4 0
Cumulative NO2-N production (mg NO2-N/g biomass/d)
Operation time(day) Cumulative NO3-N production (mg NO3-N/g biomass/d) 1.0
0.8 0.6 0.4 0.2 0.0
80
60
40
20
0
Cumulative T-N production (mg T-N/g biomass/d) Cumulative T-P production (mg T-P/g biomass/d)
120 100 80 60 40 20 0
6 5 4 3 2 1 0
0 15 30 45 60 75 90 105 0 15 30 45 60 75 90 105
.
. 111
67.3 mgCOD/g d, 86.4 mgT N/g d, 3.1 mgT
P/g d 65.7 94.4
mgCOD/g d, 83.8 109.4 mgT N/g d, 3.1
5.2 mgT P/g d .
,
8 ,
. ,
.
( : MNF1200400
532SB010) .
APHA, AWWA, WPCF, 1998. Standard methods for the examination of water & wastewater. 20th Ed., American Public Health Association, Washington, DC. pp. 4:90 5:19.
Chang, H.Y., B.G. Cho, K.S. Ko and M.S. Han, 2003.
Study on the improvement of gill nets fishing for the resource management at the coastal area of Yellow Sea-on the entrapping behavior of fishes into trap nets in the water tank experiment. Bull. Korean Soc.
Fish. Tech., 39(1), 56 62.
Colt, J.E. and D.A. Amstrong, 1981. Nitrogen toxicity to fish, crustaceans and mollusks. In proceedings of the bio-engineering symposium for fish culture. eds. L.
J. Allen and E. C. Kinney. American Fisheries Scciety, Fish Culture Section, Bethesda, 39 42.
Colt, J.E. and V. Tchobanoglous, 1978. Chronic exposure of channel catfish, Ictalurus punctatus, to ammonia : Effects on growth and survival. Aquaculture, 15,
353 372.
Kim, D.A. and K.S. Ko, 1987a. Fishing mechanism of pots and their modification. 1. Behavior of conger eel, Astroconger myriaster, to the bamboo and plastic pots. Bull. Korean Fish. Soc., 20(4), 341 347.
Kim, D.A. and K.S. Ko, 1987b. Fishing mechanism of pots and their modification. 2. Behavior of crab, Charybdis japonica, to net pots. Bull. Korean Fish.
Soc., 20(4), 348 354.
Kim, D.A. and K.S. Ko, 1990a. Fishing mechanism of pots and their modification. 3. Behavior of conger eel, Astroconger myriaster, to net pots. Bull. Korean Fish. Soc., 23(3), 238 244.
Kim, D.A. and K.S. Ko, 1990b. Fishing mechanism of pots and their modification. 4. An experiment for modifying the pot for crab, Charybdis japonica.
Bull. Korean Fish. Soc., 23(4), 310 314.
Kim, D.A. and K.S. Ko, 1990c. Fishing mechanism of pots and their modification. 5. An experiment for modifying the pot for conger eel, Astroconger myriaster, to net pots. Bull. Korean Fish. Soc., 23(4), 315 322.
Kim, H.S. and B.G. Lee, 1990. Response of sea eel to the extracts of mackerel, shad and krill. Bull. Korean Soc. Fish. Tech., 26(2), 125 132.
Ko, K.S. and B.G. Kwon, 1987. Improvement of sea eel pots. Bull. Korean Fish. Soc., 20(2), 95 105.
Ko, K.S. and D.A. Kim, 1984. The behaviour of fishes to the traps and their catch ability. Bull. Korean Fish.
Soc., 17(1), 15 23.
Seo, Y.T., K.H. Kim and J.H. Lee, 1977. Comparision of fishing efficiency of eel traps. Bull. Korean Fish.
Soc., 13(2), 15 20.
Westin, D.T., 1974. Nitrate and nitrite toxicity to salmonid fishes. Progressive Fish Culturist, 36(2), 86.
Youm, M.G., S.J. Kang, Y.J. Choi, B.D. Choi and C.W.
Cho, 1990a. Studies on the applying attractants I.
Identification of natural baits for sea eels, Astroconger myriaster, in their natural habitants.
Bull. Korean Fish. Tech. Soc. 26(4), 117 125.
Youm, M.G., Y.J. Choi, S.J. Kang, B.D. Choi and C.W.
Cho, 1990b. Attraction activities of fish to the baits II. Identification of chemical attractants for
sea eels, Astroconger myriaster, in their natural habitants. Bull. Korean Fish. Tech. Soc., 26(4), 126 132
2007 8 29
2007 12 27