Corresponding Author: Mihan Kim
Rn, Phd, Assistant Professor, Department of Nursing, Kyungil University, 33 Buhori, Hayang, Gyeongsan, Gyeongbuk 712-701, Korea
Tel: +82-53-850-7211, 016-610-0165, Fax: +82-53-850-7211, E-mail: [email protected] Article submitted 02 November 2009, Revised 11 December 2009, Approved 12 December 2009
A Comparison of Alcohol-related Problems
between Men and Women in Korean University Students
Kiwol Sung*, Mihan Kim**†
* college of nursing, catholic university of daegu
** department of nursing, kyungil university
Ⅰ. Introduction
Recently, in Korea, the number of university student drinking and the amount of alcohol they consume has increased. The prevalence of drinkers in university students was 92.2% (Sohn and Park, 2006). These rates are a lot higher than the rate for Korean adults. The results also show it is a much higher percentage compared to only 70% which is the rate of drinking for American university students (Johnston, O'Malley, and Bachman, 2003). Korean university students have both a higher prevalence of alcohol use and higher rate of heavy alcohol use (Muthén and Muthén, 2000; Slutske, Hunt-Carter and Nabors-Oberg, 2004).
Based on a survey of Korean female university students, the rate of alcohol drinking was 88.6%, which is a lot higher than other Korean women (Mun, 2007). This increased consumption of alcohol and frequency of drinking alcohol in women is not only in Korea but also in the West. In the United States, about one third of women drink alcohol, and only one out of ten people drink proper amounts of alcohol (NIAAA, 2003). Among university students,
drinking alcohol was related to a range of problems including delinquency, poor academic performance, and drinking and driving related accidents.
Motives for drinking were important factors contributing to the initiation and maintenance of alcohol use (Cooper, Frone, Russell and Mudar, 1995). Among the university students who had experienced alcohol-related problems, motivational structure significantly affected their current level of drinking(Cox, et al., 2002). The consumption of alcohol to cope with negative reasons was related to heavy drinking, drinking alone, and alcohol- related problems. On the other hand, there was evidence for an association between social pressure and drinking problems among university students (Carey and Correia, 1997; Stewart, Zeitlin and Samoluk, 1996).
Alcohol consumption and the patterns of which university students drank varied according to gender(Han, Lee and Shin, 2005; O'Malley and Johnston, 2002). Men drink more alcohol and experienced more various kinds of alcohol-related problems (Plant, 1990). Social influences were probably one of the strongest correlations with drinking (Borsari and Carey, 2004).
There is a consistent finding that drinking during the college years is a decisive factor for adult drinking behaviors (O'Neill, Parra and Sher, 2001), So, it was valuable to analyze how alcohol related problems interact with gender in order to predict future drinking patterns among university students.
Thus, the primary aim of this study was to compare the reasons for drinking with alcohol- related problems by gender among university students in Korea. The secondary aim was to identify the factors related with alcohol problems by gender among university students in Korea.
Ⅱ. Methods
1. Sample and Setting
A cross-sectional design was used with a sample of 472 university students drawn from four universities in Daegu, Korea. A random cluster sampling was used to recruit 2nd and 3rd grade students. Three private universities and one public university were randomly selected. Two departments from each university (One department for human studies and another department for science) were random selected with enrollments of 4,200 for 2nd grade students and 5,600 for 3rd grade students.
Participants ranged in age from 19 to 33 years old with a mean age of 22.5 years (53% women).
Criteria that were compulsory for this study were:
a) students must be currently enrolled in a university and b) students must give consent for participation.
There were a total of 498 potential participants from eight randomly selected departments who agreed to participate in this study, and 472(94.8%) completed the entire questionnaire.
2. Data Collection Procedures
Approval from a university Institutional Review Board was obtained before conducting the study.
The proposal was approved by each selected department in the university before the study.
Data collection began after personal consents were obtained. The students were asked to complete questionnaires during their free time. It took the students approximately 15 minutes to complete the questionnaires. Ferketich(1991) recommended that at least 200-300 research participants were needed to achieve a high reliability for newly translated instruments. The sample of 472 satisfied the minimum sample size at a power of .80 with an alpha of .05 for newly translated instruments.
3. Instruments
(1) Demographics information and Health habits The survey questionnaire included variables such as gender, age, religion, type of major and self-perceived health status. The questionnaire of health habit were the students eating habits, physical activities, whether they were a smoker or non-smoker, age of first smoking, age of first alcohol drinking, frequency of alcohol drinking and amount of alcohol drinking on a typical day.
(2) Reasons for Drinking Questionnaire (RFDQ) The RFDQ is a 16 item questionnaire including a list of reasons why people drank alcohol. Zero (0) meant that the reason was not at all important, and ten (10) meant that the reason was very important.
The RFDQ has three factors. The first factor was characterized by negative emotions including anger, depression, and anxiety. The second factor was consisted of direct and indirect social pressure. The
third factor was consisted of craving and cues (Westerberg, Miller and Heather, 1996).
In the psychometric evaluation of the Korean translation of the instrument, the Content Validity Index (CVA) of the total RFDQ score has been calculated to .86. In this study, the Cronbach alpha coefficient as the internal consistency score was .81.
(3) Alcohol Use Disorders Identification Test(AUDIT) The AUDIT questionnaire was developed by The World Health Organization to identify people whose alcohol consumption has become hazardous or harmful to their health. It was a 10 item questionnaire, and it took about 2 minutes to complete. Each question was scored from 0-4 with a maximum score of 40. The items covered the three domains : alcohol consumption (items 1-3), signs of alcohol dependence(items 4-6), and alcohol-related harm (items 7-10) (Babor, Higgins- Biddle and Saunders, 2001).
When the AUDIT was designed, ≥8 points were considered as the standard cut-off point for positive screens in both men and women(Saunders, Aasland and Babor, 1993). Due to lower sensitivity and a higher specificity in women compared to men, the recommended cut-off point was lowered to ≥6 for women (Reinert and Allen, 2002). Furthermore, scores of ≥8 for men and ≥6 for women were divided into two groups as problem drinkers and non-problem drinkers.
In the psychometric evaluation of the Korean translation of the instrument, the Content Validity Index (CVA) of the total AUDIT score had been calculated to .82 and in this study, The Cronbach
alpha coefficient as the internal consistency score was .80.
4. Data Analysis
The software used for the statistical analysis was SPSS 14.0 for Windows. A chi-square test was used to analyze differences in proportions. Comparisons of means between the subgroups were carried out in independent t-tests. A statistical multivariate analysis was performed to gain the understanding of the associations between usual cut-off levels in the AUDIT(men ≥8, women ≥ 6) and age.
Effect measure modification by gender was tested by using the likelihood ratio test when two-way interaction terms were included in the logistic regression model. A p-value of<0.05 was regarded as statistically significant.
Ⅲ. Results
1. General characteristics
Among the respondents, 47% of the subjects were male and 53% were female. The mean age the students were 23.32 ± 2.61 for males and 21.75 ± 2.20 for females. The men that took a part in the study were older than the women. For male students, 51.8% did not have any religion, while 57.7% of females did. Among respondents, 71.6%
of males and 72.7% of females majored in science.
There were differences between the gender group in age (p= .000) and religion(p= .056). (Table1).
Category Male(n=222) Female(n=250)
n (%) n (%) p-value
Age <23
=23 Mean ± SD
69 (31.1) 153 (68.9) 23.32 ± 2.61
171 (68.4) 79 (31.6)
21.75 ± 2.20 .000
Religion Have
Not have Missing data
107 (48.2) 115 (51.8)
-
143 (57.7) 105 (42.3)
2 .056
Type of major
Human studies Science Others Missing data
55 (24.8) 159 (71.6) 8 ( 3.6)
-
64 (25.7) 181 (72.7) 4 ( 1.6)
1
.235 Table 1. Demographics between male and female in university students
2. Health habits
Among the respondents, 85.6% of male students and 72.8% of female ate regular meals.
Males(35.1%) were more likely than females(9.6%) to exercise regularly. 25.7% of male students and 1.2% of female students were smokers. Male participants had a significantly higher frequency of alcohol use than women. 27.5 % of the men and 51.8% of the women drank on a monthly basis, and 62% of the men and 43% of the women drank more than twice a month. 32.6% of the men and 4.1% of women drank 10 or more glasses on a typical day.
In the comparison of health habits, there were differences between men and women in regular meal (p= .001), regular exercise (p= .000), frequency of exercise (p= .000), current smoker (p= .000), frequency of alcohol drinking (p= .000) and amount of alcohol drinking on a typical day(p= .000). (Table 2).
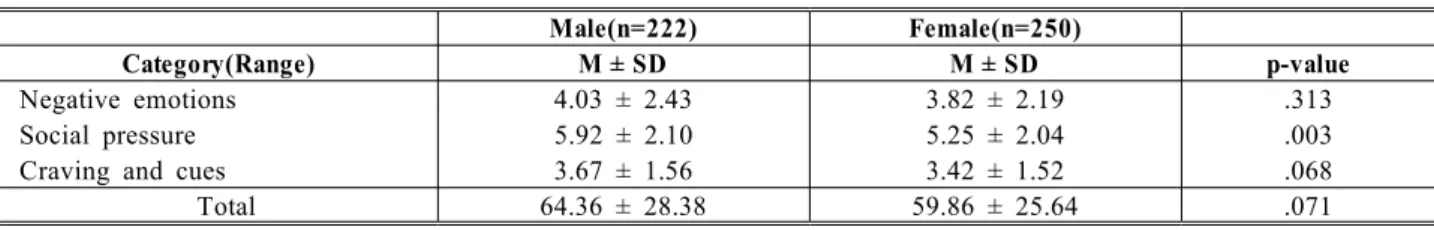
3. Reasons for drinking
In the reasons for drinking for university students, the negative reasons for males were 4.03±
2.43 and 3.82±2.19 for female. The social pressure was 5.92±2.10 for males and 5.25±2.04 for females.
The craving and cues were 3.67±1.56 for males, and 3.42±1.52 for females. The men's score of all the sub-categories for reasons for drinking were higher than for the women. There were also differences between gender groups in social pressure (p= .003) (Table 3).
4. AUDIT score
The score of alcohol consumption in the AUDIT were 5.82 ± 2.49 for males, 4.10 ± 2.09 for female.
Signs of alcohol dependence were 1.64 ± 1.80 for males and .94 ± 1.38 for females. Alcohol-related harm were 2.17 ± 2.70 for males and 1.43 ± 2.51 for females. In the comparison of the AUDIT score, there were differences between the gender groups in alcohol consumption (p= .000), sign of alcohol dependence (p= .000), and alcohol-related harm (p=
.002). Participants of men had significantly higher AUDIT scores than women (Table 4).
Male(n=222) Female(n=250)
n (%) n (%) p-value
Perceived health status
GoodModerate Poor Missing data
81 (36.8) 110 (50.0) 29 (13.2)
2
69 (27.7) 143 (57.4) 37 (14.9)
1
.108
Regular meal Yes
No 190 (85.6)
32 (14.4) 182 (72.8)
68 (27.2) .001
Regular exercise Yes
No 78 (35.1)
144 (64.9) 24 (9.6)
226 (90.4) .000
Frequency of exercise / week
< 3
≥3
Missing data
57 (42.2) 78 (57.8) 87
59 (71.1) 24 (28.9)
127 .000
Current smoker Yes
No 57 (25.7)
165 (74.3) 3 (1.2)
247 (98.8) .000
Age of first smoking <19 ≥19 Missing data
36 (48.0) 39 (52.0) 147
2(40.0) 3(60.0)
245 .729
Age of first alcohol drinking
<19
≥19Missing data
174 (80.6) 42 (19.4)
6
198 (80.5) 48 (19.5)
4 .985
Frequency of alcohol drinking
Never
Monthly or less
Two to four times a month Two or three times a week Four or more times a week Missing data
9 ( 4.1) 61 (27.5) 138 (62.2) 12 ( 5.4) 2 ( .9) -
6 ( 2.4) 129 (51.8) 108 (43.4) 6 ( 2.4) -
1
.000
Amount of alcohol drinking on a typical day
1 or 2 glasses 3 or 4 glasses 5 or 6 glasses 7 or 9 glasses 10 or more
7( 3.2) 49(22.2) 46(20.8) 47(21.3) 72(32.6)
27(10.8) 91(36.5) 80(32.1) 41(16.5) 11( 4.1)
.000 Table 2. Comparisons between Male and Female in health habits of university students
Male(n=222) Female(n=250)
Category(Range) M ± SD M ± SD p-value
Negative emotions 4.03 ± 2.43 3.82 ± 2.19 .313
Social pressure 5.92 ± 2.10 5.25 ± 2.04 .003
Craving and cues 3.67 ± 1.56 3.42 ± 1.52 .068
Total 64.36 ± 28.38 59.86 ± 25.64 .071
Table 3. Comparisons between Male and Female in reasons for drinking of university students
Male(n=222) Female(n=250)
Category(Range) M ± SD M ± SD p-value
Alcohol consumption(0 - 12) 5.82 ± 2.49 4.10 ± 2.09 .000
Signs of alcohol dependence(0 - 12) 1.64 ± 1.80 .94 ± 1.38 .000
Alcohol -related harm(0 - 16) 2.17 ± 2.70 1.43 ± 2.51 .002
Total(0 - 40) 9.63 ± 5.45 6.47 ± 4.79 .000
Table 4. Comparisons between Male and Female in AUDIT of university students
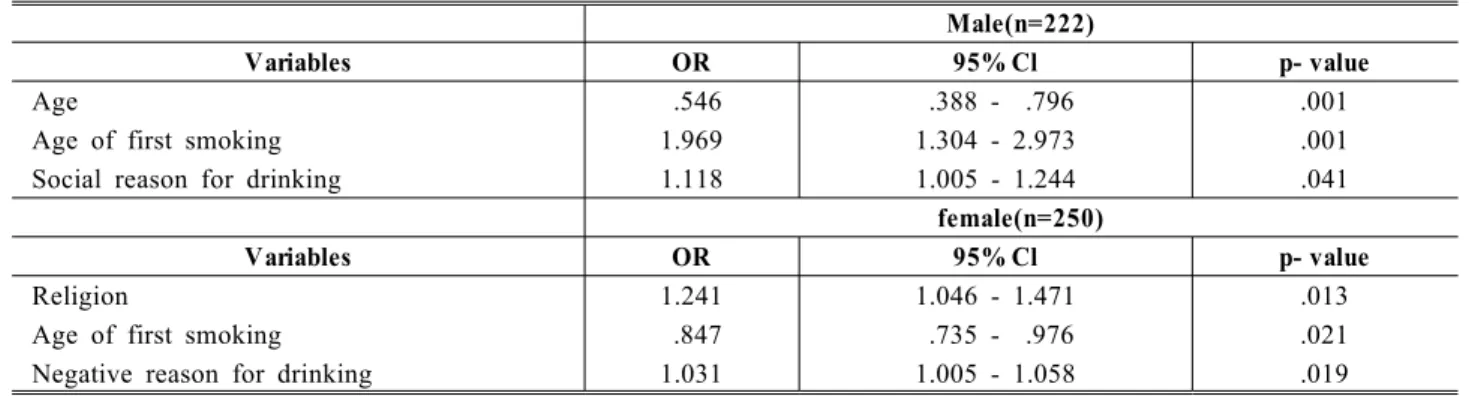
5. Factors related with drinking problems
Multiple logistic regression analyses were performed to investigate the associations between scoring above the usual AUDIT cut-off levels (men
≥ 8, women ≥6) as a dependent variable and the following independent variables. This was separately calculated for men and women.
Age (OR .54; 95% CI .38- .79), age of first smoking(OR 1.96; 95% CI 1.30-2.97), and social reasons of drinking(OR 1.11; 95% CI 1.00-1.24) were associated with drinking problems in men.
Religion(OR 1.24; 95% CI 1.04-1.47), age of first smoking(OR .87; 95% CI .73-.97), and negative reasons of drinking(OR 1.03; 95% CI 1.00-1.05) were associated with drinking problems in women (Table 5).
Male(n=222)
Variables OR 95% Cl p- value
Age .546 .388 - .796 .001
Age of first smoking 1.969 1.304 - 2.973 .001
Social reason for drinking 1.118 1.005 - 1.244 .041
female(n=250)
Variables OR 95% Cl p- value
Religion 1.241 1.046 - 1.471 .013
Age of first smoking .847 .735 - .976 .021
Negative reason for drinking 1.031 1.005 - 1.058 .019
Table 5. Related variables on AUDIT by Logistic regression analyses
Ⅳ. Discussion and Conclusion
The prevalence of alcohol consumption, the rate at which a person drinks more than one cup of alcohol per month, has been steadily increasing year by year in Korea. The total rate of alcohol consumption increased to 59.2% in 2005. This percentage was 8.6% higher than the rate of alcohol consumption in 2001 which was 50.6%. When the rate was divided into gender, the rate of men didn't show increase, however, the rate of women showed an increased percentage of 9% from 32.1% in 2001 to 41.1% in 2005 (Ministry of Health and Welfare, 2005). Thus, the purpose of this study was to compare the reasons for drinking, alcohol-related problems by gender, and to identify the factors
related to alcohol problems among university students in Korea.
In this study, men and women were different in regular meal (p= .001), regular exercise (p= .000), frequency of exercise (p= .000), current smoker (p=
.000), frequency of alcohol drinking (p= .000) and the amount of alcohol they drank on a typical day (p= .000). Prior research revealed that male university students more likely have to exercise and to smoke (Kim, 2007).
This study reports there was a high level of alcohol drinking among university students. 62.2%
of men and 43.4% of women drank more than twice a month. These results were a higher than previous in studies. Chun, and Sohn (2005) suggested that 35.3% of male and 17.9% of female drank more than twice a month.
Also, this study showed that male university students have higher AUDIT scores(p= .000). The alcohol consumption (p= .000), sign of alcohol dependence (p= .000), and alcohol-related harm (p=
.002) were different in men and women. This means that male students have a higher alcohol consumption and dependence than female students.
This result explains the same tendencies in prior papers: The prior studies showed university students' drinking style was similar in that men had a higher rate frequent heavy drinker(55.7% versus 22.2%).
Males drank more frequently and because of the social acceptance drank more than females(Kim, 1999). The AUDIT score ≥12 was 53.4% in male university students, 30.5% in female students, and the probability of university students having an alcohol use disorder was 1.30 times higher among males compare to female students (Chun and Sohn, 2005).
This study compared various reasons for drinking. Male(4.03± 2.43) were higher than females(3.82±2.19) for negative reasons. Males (3.67±1.56) were higher than females(3.42±1.52) in craving and cues, but the numbers were not significant. The social pressure was 5.92±2.10 for males, 5.25±2.04 for females. There were also differences between men and women regard to social pressure (p= .003).
Male university students drank alcohol when they met friends. However, male also felt additional pressure from friends and/ or colleagues to consume larger amounts of alcohol and more often. Men tend to drink alcohol during social activities. This trend has also been consistent with the previous survey result: Seeking fun was positively related to motivation for alcohol in male college students (Suh, Kim, and Jeong, 2006). Men had a high participation in drinking activities when they met
friends (Han & Han, 2001), and men were hypothesized to be greater risk for social pressure, especially with a relapses of alcohol drinking problems(Zywiak, Westerberg, Connors, and Maisto, 2003).
Further more, multiple logistic regression analyses shows that age(p= .001), age of first smoking(p= .001), and social reasons for drinking (p= .041) were associated with drinking problems in men. Society needs to take consideration direct and indirect social pressures for male university students face daily and we need to put programs in place to educate men in order to prevent more serious alcohol related problems.
In this study, religion(p= .013), age of first smoking(p= .021), and negative reasons of drinking(p= .019) were associated with drinking problems in women. The prior study said that women who believed in a religion had lower drinking rates. There was also a direct correlation between a religious ceremonies and a decrease drinking frequency (Kim,1999).
This research shows that the negative reasons for drinking have a great influence on female university students. The negative reasons for drinking were characterized by negative emotions including anger, depression, and anxiety. This fact has a similarity with the results of Mun (2007), who explained that stress contributes to female university students to drink alcohol. Han & Han (2001) addressed women's reasons for drinking, women usually drank when they were under stress or depressed.
Therefore, it is necessary to find different solutions to reduce the numerous problems related to alcohol by both genders based on the facts that men and women have different psychological and social factors triggering them drinking.
This study has several limitations. We did not take it to account the individual personality of each subject, differing family variables, a kind of parent's had a drinking problem previously.
According to Chun & Sohn(2005), Those university students where the father had a drinking problem while they were growing up were much more likely to have an alcohol abuse problem themselves. Other researchers found that heavy alcohol consumption for with in the family had little relation (Lee, Lee, Lee, Choi, and Namkoog, 2000).
Thus, in further studies it is of upmost importance to see that the aforementioned variables are included.
The subjects in this study were drawn from one region in Korea. Therefore, the sample may not be a fair representative of Korean as a whole nation.
Another limitation was that the results were based on one single assessment, and did not capture longitudinal variations in the same individuals while using repeated measures.
References
Babor, T.F., Higgins-Biddle, J.C., Saunders, J.B. &
Monteiro, M.G. 2001. AUDIT: The Alcohol Use Disorders Identification Test: Guidelines for use in Primary Care 2nd ed, World Health Organization, Department of Mental Health and Substance Dependence.
Borsari, B. & Carey, K.B. 2004. Peer influences on college drinking: A review of the research.
Journal of Substance Abuse 13(4):391-424.
Carey, K.B. & Correia, C.J. 1997. Drinking motives predict alcohol-related problems in college students. Journal of Studies on Alcohol 58(1):
100-105.
Chun, S.S. & Sohn, A.R. 2005. Correlates of problem drinking by the alcohol use disorders
identification test on korean college campus.
Journal of Preventive Medicine Public Health 38(3):307-314.
Cooper, M.L., Frone, M.R., Russell, M. & Mudar, P.
1995. Drinking to regulate positive and negative emotions: A motivational model of alcohol use.
Journal of Personality and Social Psychology 69(5):990-1005.
Cox, W.M., Schippers, G.M., Klinger, E., Skutle, A., Stuchlíková, I., Man, F., King, A.L. &
Inderhaug, R. 2002. Motivational structure and alcohol use of university students across four nations. Journal of Studies on Alcohol 63(3):
280-285.
Ferketich, S. 1991. Focus on psychometrics: Aspects of item analysis. Research in Nursing & Health 14(2):165-168.
Han, S.H. & Han, D.W. 2001. The Related factors of alcohol drinking in Korean young adults.
Journal of Korean Public Health Association 27(2): 130-143.
Han, S.Y., Lee, M.K. & Shin, H.C. 2005. Gender differences in the effect of risk factors on drinking problems in college students 17(4):1003-1019.
Johnston, L.D., O'Malley, P.M. & Bachman, J.G.
2003. Monitoring the future national survey results on drug use 1975-2002: Vol. 1. Secondary school students, NIH Publication No. 03-5375.
Kim, H.K. 2007. Gender differences in health promoting behavior and related factors among university students using Pender's health promotion model. The Journal of Educational Research 21:198-219
Kim, Y.R. 1999. A study of alcohol drinking style among university students. Journal of Korean Public Health Association 25(2):24-33.
Lee, B.O., Lee, C.H., Lee, P.G., Choi, M.J., Namkoog, K. 2000. Development of Korean version of alcohol use disorder identification test (AUDIT-K): It's reliability and validity.
Journal of Korean Academy Addict Psychiatry 4:83-92.
Ministry of Health & Welfare. 2005. The third Korea national health & nutrition examination survey-
health behavior of adults. Seoul.
Mun, Y.H. 2007. Factors influencing drinking problems in female university students. Journal of Korean Academy of Community Health Nursing 8(4):552-561.
Muthén, B.O. & Muthén, L.K. 2000. The development of heavy drinking and alcohol-related problems from ages 18 to 37 in a US national sample.
Journal of Studies on Alcohol 61:290-300.
National Institute on Alcohol Abuse and Alcoholism.
Helping Patients Who Drink too Much: A Clinician's Guide Updated 2005 Edition (NIAA, Bethesda, MD) NIH Publication. No. 07-3769.
2005.
National Institute on Alcohol Abuse and Alcoholism.
www. NIAAA. nih. gov. 2003.
O'Malley, P.M. & Johnston, L.D. 2002. Epidemiology of alcohol and other drug use among American college students. Journal of Studies on Alcohol 63(SUPPL.14):23-39.
O'Neill, S.E., Parra, G.R. & Sher, K.J. 2001. Clinical relevance of heavy drinking during the college years: Cross-sectional and prospective perspectives.
Psychology of Addictive Behaviors 15: 4350-359.
Plant, M. Women and Alcohol: A Review of International Literature on the Use of Alcohol by Females, WHO Publications, Geneva. 1990.
Reinert, D.F. & Allen, J.P. 2002. The alcohol use disorders identification test (AUDIT): a review of recent research. Alcoholism: Clinical and Experimental Research 26:272-279.
Saunders, J.B., Aasland, O.G., Babo,r T.F., De la
Fuente, J.R. & Grant, M. 1993. Development of the Alcohol Use Disorders Identification Test (AUDIT): WHO collaborative project on early detection of persons with harmful alcohol consumption-II. Addiction 88:791-804.
Slutske, W.S., Hunt-Carter, E.E., Nabors-Oberg, R.E.
& Sher, K.J. 2004. Do college students drink more than their non-college attending peers?
Evidence from a population-based longitudinal female twin study. Journal of Abnormal Psychology 113:4530-540.
Sohn, A.R. & Park, J.U. 2006. Comparison of sexual behavior between binge drinkers and non-binge drinkers among Korean university students.
Journal of Korean Alcohol Science 7(1); 27-38.
Stewart, S.H., Zeitlin, S.B. & Samoluk, S.B. 1996.
Examination of a three-dimensional drinking motives questionnaire in a young adult university student sample. Behavior Research and Therapy 34:61-71.
Suh, K.H., Kim, S.M. & Jeong, G.C., 2006.
Behavioral activation and inhibition system, gender, family alcohol use, motivation for alcohol use, and problematic alcohol use among college students. The Korean Journal of Health Psychology 11(3):607-626.
Westerberg, V.S., Miller, W.R., Heather, N. 1996.
The reason for drinking Questionnaire. Addiction 91:129-130
Zywiak, W.H., Westerberg, V.S., Connors, G.C. &
Maisto, S.A. 2003. Exploratory findings from the reasons for drinking questionnaire. Journal of Substance Abuse Treatment 25(4):287-292.
ABSTRACT
Objective: The aim of this study was to compare the reasons for drinking and alcohol-related problems, and to identify the factors related with alcohol problems by gender among university students in Korea.
Methods: A total of 472 students (47% men; 53% women) in four universities in Korea participated in this study. The following instruments were used the Reasons for Drinking Questionnaire (RFDQ) and the Alcohol Use Disorders Identification Test (AUDIT).
Results: In results the mean AUDIT was 9.6 (±5.4) for men and 6.4 (±4.7) for women, and there were high correlations between the AUDIT score and the reasons for drinking. The factors related with AUDIT score were age, the age of first smoking, and social reasons for drinking in men, but religion, age of first smoking, and negative reasons for drinking in women.
Conclusion: This study reveals the reasons for drinking and alcohol related problems were different from drinking by gender among university students in Korea.
Key Words: University student, Gender, Reasons for drinking, Alcohol problem
<국문초록>
대학생의 성별에 따른 음주 이유와 문제음주 관련요인
목적: 이 연구의 목적은 한국의 일부 대학생을 대상으로 성별에 따라 음주 이유와 문제음주 관련요인의 차이가 있는지를 파악하기 위한 것이다.
방법: 연구 대상자는 472명의 한국 대학생이며 사용한 측정도구는 Reasons for Drinking Questionnaire(RFDQ), Alcohol Use Disorders Identification Test(AUDIT)이다.
결과: 남자 대학생의 평균 AUDIT 점수는 9.6(±5.4), 여자 대학생은 6.4(±4.7)이었으며 AUDIT점수와 음주 이유에는 상관관계가 있었다. 남자 대학생의 AUDIT 점수 관련요인으로는 나이, 처음으로 흡연한 나이, 음주 이유가 사회적 관계를 위한 것이었다. 여자 대학생의 AUDIT 점수 관련요인은 종교, 처음으로 흡연한 나이, 음주 이유가 부정적인 감정 때문으로 서로 차이가 있었다.
결론: 대학생의 성별에 따라 음주 이유와 문제음주 관련요인이 다름을 확인하였고 따라서 성별에 따른 다른 접근법의 대학생 음주 예방 프로그램이 계획되어야 할 것이다.
주제어: 대학생, 성별, 음주이유, 문제음주