ABSTRACT
Background: Few studies have classified chest computed tomography (CT) findings of coronavirus disease 2019 (COVID-19) and analyzed their correlations with prognosis. The present study aimed to evaluate retrospectively the clinical and chest CT findings of COVID-19 and to analyze CT findings and determine their relationships with clinical severity.
Methods: Chest CT and clinical features of 271 COVID-19 patients were assessed. The presence of CT findings and distribution of parenchymal abnormalities were evaluated, and CT patterns were classified as bronchopneumonia, organizing pneumonia (OP), or diffuse alveolar damage (DAD). Total extents were assessed using a visual scoring system and artificial intelligence software. Patients were allocated to two groups based on clinical outcomes, that is, to a severe group (requiring O2 therapy or mechanical ventilation, n = 55) or a mild group (not requiring O2 therapy or mechanical ventilation, n = 216). Clinical and CT features of these two groups were compared and univariate and multivariate logistic regression analyses were performed to identify independent prognostic factors.
Results: Age, lymphocyte count, levels of C-reactive protein, and procalcitonin were significantly different in the two groups. Forty-five of the 271 patients had normal chest CT findings. The most common CT findings among the remaining 226 patients were ground- glass opacity (98%), followed by consolidation (53%). CT findings were classified as OP (93%), DAD (4%), or bronchopneumonia (3%) and all nine patients with DAD pattern were included in the severe group. Uivariate and multivariate analyses showed an elevated procalcitonin (odds ratio [OR], 2.521; 95% confidence interval [CI], 1.001–6.303, P = 0.048), and higher visual CT scores (OR, 1.137; 95% CI, 1.042–1.236; P = 0.003) or higher total extent by AI measurement (OR, 1.048; 95% CI, 1.020–1.076; P < 0.001) were significantly associated with a severe clinical course.
Conclusion: CT findings of COVID-19 pneumonia can be classified into OP, DAD, or bronchopneumonia patterns and all patients with DAD pattern were included in severe group. Elevated inflammatory markers and higher CT scores were found to be significant predictors of poor prognosis in patients with COVID-19 pneumonia.
Original Article
Received: Nov 29, 2020 Accepted: Jan 27, 2021 Address for Correspondence:
Kyung Soo Lee, MD
Department of Radiology, Samsung Changwon Hospital, Sungkyunkwan University School of Medicine, 158 Paryong-ro, Masanhoewon-gu, Changwon 51353, Republic of Korea.
E-mail: [email protected] Yun-Hyeon Kim, MD
Department of Radiology, Chonnam National University Hospital, 42 Jebong-ro, Dong-gu, Gwangju 61469, Republic of Korea.
E-mail: [email protected]
* Yeon Joo Jeong and Bo Da Nam are equally contributed to this work.
† Current address: Department of Radiology, Samsung Changwon Hospital, Sungkyunkwan University School of Medicine, Changwon, Korea.
© 2021 The Korean Academy of Medical Sciences.
This is an Open Access article distributed under the terms of the Creative Commons Attribution Non-Commercial License (https://
creativecommons.org/licenses/by-nc/4.0/) which permits unrestricted non-commercial use, distribution, and reproduction in any medium, provided the original work is properly cited.
ORCID iDs Yeon Joo Jeong
https://orcid.org/0000-0002-1741-9604 Bo Da Nam
https://orcid.org/0000-0001-7822-6104
Yeon Joo Jeong ,1* Bo Da Nam ,2* Jin Young Yoo ,3 Kun-Il Kim ,4 Hee Kang ,5 Jung Hwa Hwang ,2 Yun-Hyeon Kim ,6 and Kyung Soo Lee 7†
1 Department of Radiology and Biomedical Research Institute, Pusan National University Hospital, Busan, Korea
2 Department of radiology, Soonchunhyang University College of Medicine, Soonchunhyang University Seoul Hospital, Seoul, Korea
3Department of Radiology, Chungbuk National University Hospital, Cheongju, Korea
4Department of Radiology, Pusan National University Yangsan Hospital, Yangsan, Korea
5Department of Radiology, Kosin University Gospel Hospital, Busan, Korea
6Department of Radiology, Chonnam National University Hospital, Gwangju, Korea
7 Department of Radiology and Center for Imaging Science, Samsung Medical Center, Sungkyunkwan University School of Medicine, Seoul, Korea
Prognostic Implications of CT Feature Analysis in Patients with COVID-19:
a Nationwide Cohort Study
Respiratory Diseases
Jin Young Yoo
https://orcid.org/0000-0003-0007-1960 Kun-Il Kim
https://orcid.org/0000-0002-3474-3369 Hee Kang
https://orcid.org/0000-0001-8065-5477 Jung Hwa Hwang
https://orcid.org/0000-0003-4426-3673 Yun-Hyeon Kim
https://orcid.org/0000-0002-0047-0729 Kyung Soo Lee
https://orcid.org/0000-0002-3660-5728 Disclosure
The authors have no potential conflicts of interest to disclose.
Author Contributions
Conceptualization: Lee KS, Kim Y, Jeong YJ.
Data curation: Jeong YJ, Nam BD. Formal analysis: Jeong YJ, Nam BD. Investigation: Yoo JY, Kim K, Kang H, Hwang JH. Methodology:
Jeong YJ, Nam BD. Software: Jeong YJ.
Validation: Lee KS. Visualization: Jeong YJ, Nam BD, Yoo JY. Writing - original draft: Jeong YJ, Nam BD. Writing - review & editing: Lee KS, Kim Y, Jeong YJ, Nam BD.
Keywords: Chest; Coronavirus; COVID-19; Tomography, X-Ray Computed; Pneumonia;
Prognosis
INTRODUCTION
Coronavirus disease 2019 (COVID-19) was first reported in Wuhan, China on 31 December 2019, and then rapidly spread worldwide. The number of confirmed cases worldwide now exceeds 40 million and the overall mortality rate stands at 2.8%.1 Reported CT findings of COVID-19 pneumonia include multiple areas of pure ground-glass opacity (GGO) with or without a crazy-paving pattern, mixed consolidation and GGO, which are typically observed in subpleural or peribronchovascular areas of both lungs.2-5 Cavities, large or centrilobular nodules, pleural effusion, and lymphadenopathy are rare.2-5
In viral infections, the main role of imaging is to identify the presence of pneumonia, provide a differential diagnosis, and to evaluate changes in disease statuses and treatment responses.6 In this respect, radiologists should analyze lung abnormalities in terms of distribution, extents, and specific patterns.
Viral pneumonia in an immunocompetent host can be classified into bronchopneumonia, organizing pneumonia (OP), or diffuse alveolar damage (DAD) patterns and these patterns are closely related to prognosis.7
The purpose of the present study was to analyze retrospectively the initial clinical and chest CT findings of COVID-19 and to determine their relationships with clinical severity.
METHODS
Patients and clinical data
This retrospective study was approved by the Institutional Review Board of the Pusan National University Hospital (2004-034-090), which waived the requirement for informed consent. This study used the open data repository for COVID-19, namely, the Korean Imaging Cohort for COVID-19 (KICC-19), which was constructed by the Korean Society of Thoracic Radiology (KSTR) during July 2020.8,9 From February through May 2020, 522 adult patients (≥ 18 years old) with real-time reverse transcriptase-polymerase chain reaction (RT-PCR) results and positivity for coronavirus by nasal and oropharyngeal swab testing were enrolled in KICC-19. Other respiratory pathogens capable of causing symptoms were excluded by RT-PCR and sputum culture. Of these 522 patients, 271 underwent chest CT within 10 days of diagnosis and constituted the study cohort. Mean time between symptom onset and chest CT examination was 5.5 ± 2.7 days (range, 0–10 days).
Demographics, clinical symptoms, underlying diseases, initial laboratory findings including lymphocyte counts, C-reactive protein (CRP), procalcitonin, type of treatment, duration of hospital stay, clinical severity, and clinical outcome (cure or death) of the 271 study subjects were evaluated. Lymphocytopenia was defined as fewer than 1,000 lymphocytes per microliter of blood.10,11 The thresholds for CRP and procalcitonin elevation were 0.5 mg/dl and 0.05 ng/ml, respectively.12,13 The 271 patients were divided into 2 groups, that is, a severe
group of patients who needed additional oxygen therapy or mechanical ventilation, and a mild group of patients who did not.
CT imaging protocol and reconstruction profiles
All CT examinations were performed using multi-detector CT scanners with more than 16 channels. Scans were obtained from lung apices to lung bases. Intravenous contrast medium was injected in only 9 patients (3%). Of the 271 scans, 133 (49%) and 130 (48%) were obtained using a slice thickness of ≤ 1.5 mm or between 1.5 and 3 mm, respectively; only 8 CT scans (3%) were constructed using a slice thickness of > 3 mm.
All images were anonymized locally and transferred to a cloud-based web interface (AiCRO System, Asan Image Metrics (AIM), Strategy & Development Unit, Clinical Trial Center, Asan Medical Center, Korea) for analysis. CT data were also transferred to a post-processing workstation (syngo.via, Siemens) for further analysis by an investigator with 18 years' experience in thoracic imaging.
Image analysis
Two radiologists with 9 and 13 years of chest CT experience unaware of patient clinical severity, reviewed all images and reached conclusions by consensus. Only the first CT examination was analyzed if a patient underwent multiple CT examinations within 10 days of COVID-19 diagnosis. Times between symptom onsets and CT examinations were recorded.
CT findings were evaluated for the presence, distribution, and extents of parenchymal abnormalities including GGO, consolidation, crazy-paving appearance, reversed halo sign, interlobular and intralobular interstitial thickenings, reticulation, subpleural lines, traction bronchiectasis, air-bronchograms, large nodules, and centrilobular nodules. A crazy-paving appearance was defined as thickened interlobular septa and intralobular lines superimposed on a background of GGO, and the reversed halo sign was defined as a focal rounded area of GGO surrounded by a near or complete ring of consolidation.14 The presences of vascular enlargement, pleural effusion, hilar, and mediastinal lymph node enlargement were also evaluated. An enlarged lymph node was defined as one with a short-axis diameter of > 10 mm. In addition, the presence of vascular enlargement was evaluated and defined as a vessel diameter larger than that expected based on its location in the vascular tree, than in an adjacent portion of non-diseased lung, or in a comparable region of non-diseased contralateral lung or focal dilation or non-tapering of vessels as they coursed toward lung periphery. Vessel enlargement within areas of parenchymal opacity, outside of opacities, and dilated distal subsegmental vessels touching pleura or fissure were recorded.15
Total extents of all parenchymal lesions were assessed using a visual scoring system and artificial intelligence (AI) software (CT Pneumonia Analysis 2.1.2, syngo,via FRONTIER, Siemens). With a visual CT scoring system, each lung lobe was visually scored from 0 to 5 as: 0, no involvement; 1, < 5% involvement; 2, 5%–24%; 3, 25%–49%; 4, 50%–74%; 5,
≥ 75%. Visual CT scores were the sum of the individual lobar score and ranged from 0 to 25. With AI software for the automatic quantification of COVID-19, the total extent of lung parenchymal abnormality was calculated. Data from 245 patients were analyzed in automatic measurement; 26 patients were excluded due to data non-availability.
Laterality (unilateral and bilateral) and distributions of lung parenchymal abnormalities in the transverse (central, peripheral, peribronchovascular, and random) and longitudinal planes (upper zone, middle zone, lower zone, and random) were evaluated.
Parenchymal abnormalities were then classified into; bronchopneumonia, OP, or DAD patterns. When parenchymal abnormalities contained areas of consolidation, GGO, large nodules, centrilobular nodules, and bronchial wall thickening, they were considered to exhibit a bronchopneumonia pattern. OP patterns were considered to show lung
abnormalities consisting of consolidation and GGO with subpleural or peribronchovascular predominance, and DAD patterns were considered to demonstrate patchy or extensive airspace consolidation or GGO without zonal predominance.
Statistical analysis
Statistical analysis was performed using SPSS Ver. 21.0 software (SPSS, IBM SPSS Statistics, Armonk, NY, USA). Results are expressed as means (SDs) for continuous variables and as numbers of individuals and percentages for the categorical variables.
The Mann-Whitney U test, the χ2 test, and Fisher's exact test were used to determine the significances of differences between clinical and CT features of the severe and mild groups.
Factors associated with poor prognosis were identified by univariate and multivariate logistic regression analysis. The comparison of two prediction models, which included visual CT scores and AI measurement, respectively, was performed with a receiver operating characteristic (ROC) analysis. Statistical significance was accepted for P values of < 0.050 throughout.
Ethics statement
The present study protocol was approved by the Institutional Review Board of the Pusan National University Hospital (2004-034-090), which waived the requirement for informed consent.
RESULTS
Demographics and clinical data
The demographics and clinical data of the 271 patients, all of whom performed a chest CT scan, are presented in Table 1. There were 116 men and 155 women of mean age 52.9
± 19.5 years (range, 15–97 years). One hundred and four (38.4%) had underlying disease:
hypertension (n = 71), diabetes (n = 46), cardiovascular disease (n = 13), or cancer (n = 27).
One hundred and fifty-seven were febrile and 131 had respiratory symptoms such as a cough with or without sputum production. One hundred and twenty-two patients were treated with lopinavir/ritonavir and 83 with hydroxychloroquine. Mean hospital stay was 25.2 ± 15.6 days (range, 0–94 days). Although most patients had cured, ten patients (3.7%) died.
Eighty-seven (32.1%) had lymphocytopenia and 154 (56.8%) elevated CRP at admission. An elevated procalcitonin level was observed in 76 (28%) patients. Fifty-five (20.3%) needed additional oxygen therapy or mechanical ventilation, and 216 did not (Table 2). Of the 55 patients in the severe group, 10 died of respiratory failure. Regarding demographics, only age was significantly different in severe and mild groups (P < 0.001). Lymphocytopenia, elevated CRP, and procalcitonin were more commonly observed in the severe group (Ps < 0.050) CT findings
Of the 271 patients, 45 (16.6%) had normal chest CT findings. CT findings of COVID-19 pneumonia in the other 226 (83.4%) patients are presented in Table 3. The most common CT finding among these 226 patients was GGO (98%, 221 patients), followed by consolidation (53%, 120 patients), intralobular interstitial thickening (34%, 77 patients), and a crazy-
Table 1. Clinical data of patients with coronavirus disease 2019 pneumonia
Variables Values
Gender
Men 116 (42.8)
Women 155 (57.2)
Age, yr mean (range) 52.9 (15–97)
Exposure History
Unknown 78 (28.8)
Exposure to infected patients 94 (34.7)
Visiting to epidemic areas 99 (36.5)
Smoking history
Current smoker 5 (1.9)
Ex-smoker 9 (3.3)
Non-smoker 218 (80.4)
Unknown 39 (14.4)
Underlying disease
None 167 (61.6)
Hypertension 71 (26.2)
Diabetes 46 (17)
Cardiovascular disease 13 (4.8)
Cancer 27 (5.2)
COPD 7 (2.6)
Others 15 (5.5)
Visiting route
Visiting screening center 190 (70.1)
Visiting emergency room 18 (6.7)
Transfer from another hospital 63 (23.2)
Interval between symptom onset and CT scan
Mean (SD) 5.5 (2.7)
Range, days 0–10
Symptoms
Fever 157 (57.9)
Cough 131 (48.3)
Dyspnea 56 (20.7)
Confusion 1 (0.4)
Laboratory findings
Lymphocytopenia 87 (32.1)
Thrombocytopenia 35 (12.9)
Increased CRPa 154 (59.1)
Increased D-dimera 41 (62.1)
Increased procalcitonina 76 (28.0)
Increased LDHa 216 (85.3)
Treatment
Lopinavir/ritonavir 122 (45)
Hydroxychloroquine 83 (30.6)
Remdesivir 3 (1.1)
Steroid 28 (10.3)
Conservative treatment 88 (32.5)
O2 Supply 55 (20.3)
Mechanical ventilation therapy 17 (6.3)
ECMO 6 (2.2)
ICU admission 25 (9.2)
ARDS 27 (5.2)
Mortality 10 (3.7)
Admission days
Mean (SD) 25.2 (15.6)
Range, days 0–94
COPD = chronic obstructive pulmonary disease, SD = standard deviation, CRP = C-reactive protein, LDH = lactate dehydrogenase, ECMO = extracorporeal membrane oxygenation, ICU = intensive care unit, ARDS = acute respiratory distress syndrome.
aCRP results were available for 269 patients, D-dimer in 66 patients, procalcitonin in 219 patients, and LDH in 253 patients.
paving appearance (25%, 56 patients). Other findings (in decreasing order of frequency) were air bronchogram, (19%, 42 patients), reversed halo (8%, 17 patients), reticulation (5%, 12 patients), traction bronchiectasis (5%, 11 patients), pleural effusion (4%, 8 patients), centrilobular nodules (3%, 7 patients), subpleural line (3%, 7 patients), and interlobular septal thickening (3%, 6 patients). Only twelve patients (5%) had vascular enlargement and the majority (11 patients) showed vessel enlargement within areas of parenchymal opacity;
vessel enlargement outside opacity was observed in only one patient.
The parenchymal abnormalities were bilateral in 169 patients (75%) and unilateral in 57 patients (25%). In the longitudinal plane, lung abnormalities showed mainly lower lung involvement (50%, 112 patients) and random involvement (46%, 103 patients). In the transverse plane, the lung abnormalities showed mainly peribronchovascular predominance (57%, 129 patients) and all 226 exhibited a peripheral or peribronchovascular distribution.
The mean visual CT score of parenchymal abnormalities was 7.51 ± 5.56 (range, 1–23) and mean total extent by automatic measurement was 10.5 ± 16.2 (range, 0.01%–73.6%).
The CT findings were classified as OP (93%, 210 patients), DAD (4%, 9 patients), or bronchopneumonia (3%, 7 patients) (Figs. 1 and 2). Table 4 summarizes CT findings for the severe and mild groups. GGO, consolidation, intralobular and interlobular interstitial thickening, crazy-paving appearance, reticulation, traction bronchiectasis, air-bronchogram, mediastinal and hilar lymph node enlargement were most frequently observed in the severe group (all P < 0.050). Bilateral parenchymal abnormalities were more common in the severe group (P < 0.001). Random distribution in the longitudinal plane and peripheral and peribronchovascular distribution in the transverse plane were more frequently observed in the severe group (both P < 0.001). Mean visual CT score and total extent of automatic measurement were higher in the severe group (11.8 vs 4.9, P < 0.001 and 27.5% vs 5.9%, P
< 0.001, respectively). All patients with DAD patterns were in the severe group. Of the 10 patients that died, 3 showed a DAD pattern and the remaining 7 showed an OP pattern (Fig. 2).
Table 2. Clinical data of patients with coronavirus disease 2019 pneumonia according to clinical severity
Characteristics Severe group (n = 55) Mild group (n = 216) P value
Age, yr < 0.001b
Mean 64.8 (15.5) 49.9 (19.4)
Range 18–90 15–97
Gender 0.089
Men 30 (54.5) 86 (39.8)
Women 25 (45.5) 130 (60.2)
Underlying disease 0.185
No underlying disease 21 (38) 146 (67.6)
Underlying disease 34 (62) 70 (32.4)
Interval between symptom onset and CT scan, days 0.901
Mean 5.1 (3.1) 5.6 (2.6)
Range 0–10 0–10
Hospital stay, days 0.911
Mean 28.3 (18.4) 24.5 (14.7)
Range 1–87 0–94
Laboratory findings
Lymphocytopenia 25 (45) 62 (29) 0.027b
Elevated CRPa 49 (90.7) 105 (48.8) < 0.001b
Elevated procalcitonin 33 (61) 43 (19.8) 0.001b
Data are means (standard deviations). Numbers in parentheses are percentages, unless specified otherwise.
CRP = C-reactive protein.
aCRP results were available for 53 patients in the severe group and 216 patients in the mild group; bStatistically significant in the severe and mild patient groups (P < 0.050).
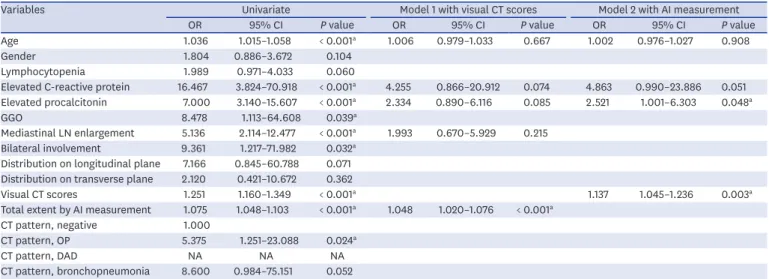
Risk factors related to poor prognosis of patients with COVID-19 pneumonia Univariate analyses showed older age, elevated CRP and procalcitonin levels, and CT findings including GGO, lymph node enlargement, bilateral involvement of parenchymal abnormalities, visual CT scores, and total extent by automatic measurement of lung parenchymal abnormalities were significant prognostic parameters. Multivariate logistic analysis with two models, which included visual CT scores and AI measurement, respectively, showed elevated CRP, elevated procalcitonin, visual CT scores, and AI measurement of lung parenchymal abnormalities were independently associated with a poorer prognosis for patients with COVID-19 pneumonia (Table 5). There was no significant difference of two models with results of area under the ROC curves: 0.8587 vs. 0.8645, P = 0.632 (Fig. 3).
Table 3. CT findings of coronavirus disease 2019 pneumonia
Characteristics Total (n = 226)
Parenchymal abnormalities
Ground glass opacity 221 (98)
Consolidation 120 (53)
Intralobular interstitial thickening 77 (34)
Interlobular septal thickening 6 (3)
Crazy-paving appearance 56 (25)
Reversed halo 17 (8)
Reticulation 12 (5)
Subpleural line 7 (3)
Traction bronchiectasis 11 (5)
Air-bronchogram 42 (19)
Large nodule 1 (0.5)
Centrilobular nodule 7 (3)
Pleural effusion 8 (4)
Hilar lymph node enlargement 21 (9)
Mediastinal lymph node enlargement 34 (15)
Vessel enlargement 12 (5)
Laterality
Bilateral 169 (75)
Unilateral 57 (25)
Distribution on longitudinal plane
Upper 8 (4)
Middle 3 (1)
Lower 112 (50)
Random 103 (46)
Distribution on transverse plane
Peripheral 78 (35)
Peribronchovascular 19 (8)
Peripheral and peribronchovascular 129 (57)
Random 0 (0)
Central 0 (0)
Visual CT Scores of lung parenchymal abnormalities
Mean 7.51 ± 5.56
Range 1–23
Total extent of parenchymal abnormalities by automatic measurement, %
Mean 10.5 ± 16.2
Range 0.01–73.6
CT pattern
Organizing pneumonia 210 (93)
Diffuse alveolar damage 9 (4)
Bronchopneumonia 7 (3)
CT = computed tomography.
Numbers in parentheses are percentages, unless specified otherwise.
DISCUSSION
The main results of this study are that GGO, consolidation, interstitial thickening, a crazy- paving appearance, mediastinal and hilar lymph node enlargement, visual CT scores and total extent by automatic measurement of lung parenchymal abnormalities, and the presence of a DAD pattern were significantly more prevalent in the severe clinical outcome group rather than in the mild group. An older age, lymphocytopenia, and inflammatory marker elevation were significantly more prevalent in the severe group, and elevated CRP and procalcitonin levels and visual CT scores were found to independently predict poorer outcomes. To the best of our knowledge, this is study is the first report to classify CT findings of COVID-19 pneumonia into CT patterns and to investigate the impacts of CT findings and their patterns on prognosis.
It has been reported multiple areas of patchy GGO and consolidation are common CT findings of COVID-19 pneumonia and these lesions are typically distributed in
peribronchovascular or subpleural areas of both lungs.2-5 These findings are consistent with our results and similar to those of severe acute respiratory syndrome (SARS) and Middle-East respiratory syndrome (MERS), which are both caused by coronavirus infection.16-20 Bilateral subpleural and lower lung zone predominant GGO and consolidation were the most common findings in MERS and SARS. However, in the present study, lung abnormalities showed mainly lower lung (50%) and random involvement (46%) in the longitudinal plane and peripheral and peribronchovascular involvement (57%) in the transverse plane. In addition,
A B
C D
Fig. 1. Coronavirus disease 2019 pneumonia showing an organizing pneumonia pattern in a 73-year-old man. (A, B) Serial axial CT scans obtained 5 days after symptom onset show patchy areas of ground glass opacity with a crazy- paving appearance distributed mainly in subpleural areas of both upper lungs. Visual CT score and total extents of automatic measurement of lung parenchymal abnormalities on initial CT images were 15 and 23.7%, respectively. (C, D) Follow-up axial CT scan obtained 1 months later showing partially improved lesions with residual subpleural lines.
CT = computed tomography.
parenchymal abnormalities were bilateral in most patients (75%) in our study, whereas initial parenchymal abnormalities were more frequently unilateral in MERS and SARS.21
In the present study, only seven patients had large or centrilobular nodules and no patient had a cavitary lesion. A few patients had pleural effusion or significant lymph node enlargement. Unlike other viral pneumonia types, poorly defined centrilobular nodules are rare in pneumonia caused by coronaviruses.22 It has been reported that CT patterns of pulmonary viral infection are related to their pathogeneses.23 Unlike respiratory syncytial virus or human parainfluenza virus pneumonia, which exhibit an airway-centered pattern of disease and result in cellular bronchiolitis,24 coronaviridae elicit direct lung injury or cell apoptosis and contribute to DAD.25 Thus, the common CT findings of pulmonary infection caused by coronaviridae are bilateral multifocal or extensive GGO and consolidation with subpleural predominance. In a recent study15 on 48 patients diagnosed with COVID-19 that underwent CT pulmonary angiography, it was reported that dilated vessels were evident in 85% of cases, dilated distal vessels extending to pleura were observed in 82%, and fissures were observed in (61%). In the present study, only 12 patients (5%) showed vascular enlargement, and 97% of the examinations were performed without contrast enhancement.
We divided patients into two groups according to clinical severity and compared their clinical and CT findings. Patients were older in the severe group (P < 0.001) and lymphocytopenia
A B
C D
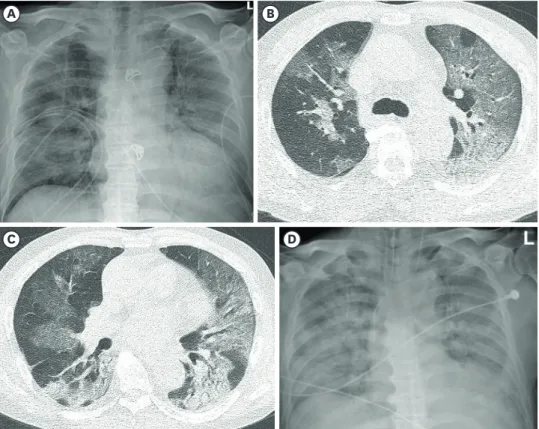
Fig. 2. Coronavirus disease 2019 pneumonia with a diffuse alveolar damage pattern in a 72-year-old man. (A) Initial chest radiograph obtained 5 days after symptom onset showing bilateral diffuse ground glass opacities in both lungs. (B, C) Serial axial CT scans obtained on the same day as (A) showing bilateral diffuse ground-glass opacity with consolidation without specific zonal predominance in both lungs. Visual CT score and total extents of automatic measurement of lung parenchymal abnormalities on initial CT images were 24 and 47.8%, respectively.
(D) Follow-up chest radiograph showing lesion progression. The patient died 14 days after chest radiograph.
CT = computed tomography.
and elevated CRP and procalcitonin levels were more commonly observed in this group (Ps <
0.001). These findings were consistent with other previous studies that evaluated risk factors associated with acute respiratory distress syndrome in patients with COVID-19.11,13,26,27
Elevated CRP and procalcitonin levels in the severe group may have been associated with cytokine storms triggered by viral invasion or due to the presence of co-infections, as reported in a recent study.28
We compared CT features and patterns in severe and mild disease groups. GGO,
consolidation, intralobular and interlobular interstitial thickening, a crazy-paving appearance, reticulation, traction bronchiectasis, air-bronchogram, and mediastinal and hilar lymph Table 4. CT findings of coronavirus disease 2019 pneumonia according to clinical severity
Characteristics Severe Mild P value
Parenchymal abnormalities
Ground glass opacitya 53 (96) 169 (78) 0.004
Consolidationa 38 (70) 82 (38) < 0.001
Intralobular interstitial thickeninga 25 (45) 52 (24) 0.003
Interlobular septal thickeninga 3 (6) 3 (1) 0.033
Crazy-paving appearancea 19 (35) 37 (17) 0.008
Reversed halo 5 (9) 12 (6) 0.352
Reticulationa 6 (11) 6 (3) 0.018
Subpleural line 0 (0) 7 (3) 0.351
Traction bronchiectasisa 6 (11) 5 (2) 0.011
Air-bronchograma 17 (31) 25 (12) < 0.001
Large nodule 0 (0) 1 (0.5) 0.999
Centrilobular nodule 2 (4) 5 (2) 0.122
Pleural effusion 2 (4) 6 (3) 0.666
Hilar lymph node enlargementa 13 (24) 8 (4) < 0.001
Mediastinal lymph node enlargementa 18 (33) 16 (7) < 0.001
Vessel enlargement 3 (6) 9 (4) 0.714
Lateralitya 0.005
Bilateral 48 (91) 121 (70)
Unilateral 5 (9) 52 (30)
Distribution on longitudinal planea < 0.001
Upper 2 (4) 6 (3)
Middle 0 (0) 3 (1)
Lower 16 (30) 96 (44)
Random 35 (64) 68 (31)
Distribution on transverse planea < 0.001
Peripheral 7 (13) 71 (33)
Peribronchovascular 4 (7) 15 (7)
Peripheral and peribronchovascular 42 (76) 87 (40)
Random 0 (0) 0 (0)
Visual CT Scores of lung parenchymal abnormalitiesa < 0.001
Mean 11.8 ± 6.0 4.9 ± 4.5
Range 1–23 1–18
Total extent of parenchymal abnormalities by automatic
measurement,b % < 0.001
Mean 27.5 ± 22.6 5.9 ± 9.9
Range 0.05–73.6 0–65.0
CT patterna < 0.001
Negative finding 2 (4) 43 (20)
Organizing pneumonia 42 (76) 168 (78)
Diffuse alveolar damage 9 (16) 0 (0)
Bronchopneumonia 2 (4) 5 (2)
CT = computed tomography.
aResults are for a total of 226 patients (53 in the severe group and 173 in the mild group); bTotal extents of parenchymal abnormalities were analyzed in 245 patients.
Numbers in parentheses are percentages, unless specified otherwise.
node enlargement were more frequently observed in the severe group. In addition, visual CT scores and total extent by automatic measurement of lung parenchymal abnormalities were higher in the severe group (Ps < 0.001). In a study of 228 COVID-19 patients that including 45 patients under intensive care,26 it was reported that a higher CT total score significantly predicted the need for invasive respiratory support, which concurs with our results. In another study conducted on 25 severe cases and 58 ordinary cases, CT scores were significantly higher in critical patients.13 This study used the same CT scoring system as our study and showed similar score values in mild and severe groups. The present study, which was conducted using a larger cohort than those used in previous studies,13,26,29 shows that CT extent of lung parenchymal disease measured by visual scoring or AI measurement was significantly predicted prognosis in patients with COVID-19 pneumonia. We also found no significant difference in diagnostic accuracy between the prediction model using visual CT scoring Table 5. Univariate and multivariate analyses of factors associated with severe coronavirus disease 2019 pneumonia
Variables Univariate Model 1 with visual CT scores Model 2 with AI measurement
OR 95% CI P value OR 95% CI P value OR 95% CI P value
Age 1.036 1.015–1.058 < 0.001a 1.006 0.979–1.033 0.667 1.002 0.976–1.027 0.908
Gender 1.804 0.886–3.672 0.104
Lymphocytopenia 1.989 0.971–4.033 0.060
Elevated C-reactive protein 16.467 3.824–70.918 < 0.001a 4.255 0.866–20.912 0.074 4.863 0.990–23.886 0.051 Elevated procalcitonin 7.000 3.140–15.607 < 0.001a 2.334 0.890–6.116 0.085 2.521 1.001–6.303 0.048a
GGO 8.478 1.113–64.608 0.039a
Mediastinal LN enlargement 5.136 2.114–12.477 < 0.001a 1.993 0.670–5.929 0.215 Bilateral involvement 9.361 1.217–71.982 0.032a
Distribution on longitudinal plane 7.166 0.845–60.788 0.071 Distribution on transverse plane 2.120 0.421–10.672 0.362
Visual CT scores 1.251 1.160–1.349 < 0.001a 1.137 1.045–1.236 0.003a
Total extent by AI measurement 1.075 1.048–1.103 < 0.001a 1.048 1.020–1.076 < 0.001a
CT pattern, negative 1.000
CT pattern, OP 5.375 1.251–23.088 0.024a
CT pattern, DAD NA NA NA
CT pattern, bronchopneumonia 8.600 0.984–75.151 0.052
OR = odds ratio, CI = confidence interval, CT = computed tomography, GGO = ground-glass opacity, LN = lymph node, AI = artificial intelligence, OP = organizing pneumonia, DAD = diffuse alveolar damage, NA = not applicable.
aStatistically significant results (P < 0.050). Univariate and multivariate logistic regression were used for the analyses. Model 1 and Model 2 included the same variables for multivariate logistic regression analysis, except visual CT scores and Total extent by AI measurement.
01.0 0.8 0.6 0.4 0.2 0
0.2 0.4 0.8
0.6
Sensitivity
1.0
Specificity
P value = 0.632
Model 1 with visual CT scores Model 2 with AI measurement
Fig. 3. Receiver operating characteristic analysis of the predictive modelsfor severe clinical course of coronavirus disease 2019 with visual CT scores and artificial intelligence measurement.
CT = computed tomography.
and the model using AI measurement. Therefore, early CT evaluation may help predict the presence of features of severe or critical pneumonia requiring aggressive management.
DAD is a hallmark of patients with acute respiratory distress syndrome caused by infectious etiologies such as SARS, MERS, and influenza.30,31 In our study, all patients with a DAD pattern were members of the severe group and we presumed that a DAD pattern presents a strong predictor of the severe clinical course of COVID-19. In our study, CT observed DAD patterns were only observed in the severe group. Kang et al. analyzed chest CT findings of influenza pneumonia and evaluated their relationships with clinical outcomes.7 They also classified CT patterns as bronchopneumonia, OP, or DAD and concluded that patients with DAD patterns tended to have poorer prognoses. On the other hand, in MERS, the number of involved lung segments predicts poorer prognosis.16 These findings are consistent with the results of our study.
The present study has several limitations that warrant consideration. First, the study is inherently limited by its retrospective design, and thus, by selection bias. In particular, we only included patients that underwent chest CT. Second, times between symptom onsets and CT scans varied, which would have affected CT patterns. For example, some of the DAD patterns observed may have been due to disease progression from initially mild disease patterns.
However, we only included patients that underwent chest CT within 10 days of RT-PCR-based diagnosis. Third, the multicenter design meant that CT protocols and vendors varied.
In conclusion, the most common CT findings observed for COVID-19 pneumonia were GGO, consolidation, intralobular interstitial thickening, and a crazy-paving appearance with a bilateral, lower lung and peripheral and peribronchovascular predominance exhibiting patterns of bronchopneumonia, OP, or DAD. Older age and inflammatory marker elevations at an early stage were found to risk factors of a poor clinical outcome. If CT images show parenchyma lesions of a wide extent and DAD pattern, regardless of clinical risk factors, and the patient follows a severe clinical course a poor prognosis can be expected. Early CT findings can predict outcomes and improve prognoses by facilitating prompt, appropriate management.
REFERENCES
1. World Health Organization. COVID-19 weekly epidemiological update. https://www.who.int/docs/default- source/coronaviruse/situation-reports/20201020-weekly-epi-update-10.pdf. Updated 2020. Accessed October 30, 2020.
2. Chung M, Bernheim A, Mei X, Zhang N, Huang M, Zeng X, et al. CT Imaging features of 2019 novel coronavirus (2019-nCoV). Radiology 2020;295(1):202-7.
PUBMED | CROSSREF
3. Pan F, Ye T, Sun P, Gui S, Liang B, Li L, et al. Time course of lung changes at chest CT during recovery from coronavirus disease 2019 (COVID-19). Radiology 2020;295(3):715-21.
PUBMED | CROSSREF
4. Salehi S, Abedi A, Balakrishnan S, Gholamrezanezhad A. Coronavirus disease 2019 (COVID-19): a systematic review of imaging findings in 919 patients. AJR Am J Roentgenol 2020;215(1):87-93.
PUBMED | CROSSREF
5. Yoon SH, Lee KH, Kim JY, Lee YK, Ko H, Kim KH, et al. Chest radiographic and CT findings of the 2019 novel coronavirus disease (COVID-19): analysis of nine patients treated in Korea. Korean J Radiol 2020;21(4):494-500.
PUBMED | CROSSREF
6. Lee KS. Pneumonia associated with 2019 novel coronavirus: can computed tomographic findings help predict the prognosis of the disease? Korean J Radiol 2020;21(3):257-8.
PUBMED | CROSSREF
7. Kang H, Lee KS, Jeong YJ, Lee HY, Kim KI, Nam KJ. Computed tomography findings of influenza A (H1N1) pneumonia in adults: pattern analysis and prognostic comparisons. J Comput Assist Tomogr 2012;36(3):285-90.
PUBMED | CROSSREF
8. Yoon SH, Ham SY, Nam BD, Chae KJ, Lee D, Yoo JY, et al. Establishment of a nationwide Korean imaging cohort of coronavirus disease 2019. J Korean Med Sci 2020;35(46):e413.
PUBMED | CROSSREF
9. Jeong YJ, Kim YH. Korean imaging cohort of COVID-19: potential role in education and research. J Korean Soc Radiol 2020;81(3):608-9.
CROSSREF
10. Kipps TJ. Chapter 81. Lymphocytosis and lymphocytopenia. In: Lichtman MA, Kipps TJ, Seligsohn U, Kaushansky K, Prchal JT, editors. Williams Hematology. 8th ed. New York, NY: The McGraw-Hill Companies; 2010.
11. Wang D, Hu B, Hu C, Zhu F, Liu X, Zhang J, et al. Clinical characteristics of 138 hospitalized patients with 2019 novel coronavirus-infected pneumonia in Wuhan, China. JAMA 2020;323(11):1061-9.
PUBMED | CROSSREF
12. Lippi G, Plebani M. Procalcitonin in patients with severe coronavirus disease 2019 (COVID-19): a meta- analysis. Clin Chim Acta 2020;505:190-1.
PUBMED | CROSSREF
13. Li K, Wu J, Wu F, Guo D, Chen L, Fang Z, et al. The clinical and chest CT features associated with severe and critical COVID-19 pneumonia. Invest Radiol 2020;55(6):327-31.
PUBMED | CROSSREF
14. Hansell DM, Bankier AA, MacMahon H, McLoud TC, Müller NL, Remy J. Fleischner Society: glossary of terms for thoracic imaging. Radiology 2008;246(3):697-722.
PUBMED | CROSSREF
15. Lang M, Som A, Carey D, Reid N, Mendoza DP, Flores EJ, et al. Pulmonary vascular manifestations of COVID-19 pneumonia. Radiol Cardiothorac Imaging 2020;2(3):e200277.
CROSSREF
16. Ajlan AM, Ahyad RA, Jamjoom LG, Alharthy A, Madani TA. Middle East respiratory syndrome coronavirus (MERS-CoV) infection: chest CT findings. AJR Am J Roentgenol 2014;203(4):782-7.
PUBMED | CROSSREF
17. Antonio GE, Ooi CG, Wong KT, Tsui EL, Wong JS, Sy AN, et al. Radiographic-clinical correlation in severe acute respiratory syndrome: study of 1373 patients in Hong Kong. Radiology 2005;237(3):1081-90.
PUBMED | CROSSREF
18. Das KM, Lee EY, Langer RD, Larsson SG. Middle East respiratory syndrome coronavirus: what does a radiologist need to know? AJR Am J Roentgenol 2016;206(6):1193-201.
PUBMED | CROSSREF
19. Ketai L, Paul NS, Wong KT. Radiology of severe acute respiratory syndrome (SARS): the emerging pathologic-radiologic correlates of an emerging disease. J Thorac Imaging 2006;21(4):276-83.
PUBMED | CROSSREF
20. Wong KT, Antonio GE, Hui DS, Lee N, Yuen EH, Wu A, et al. Thin-section CT of severe acute respiratory syndrome: evaluation of 73 patients exposed to or with the disease. Radiology 2003;228(2):395-400.
PUBMED | CROSSREF
21. Hosseiny M, Kooraki S, Gholamrezanezhad A, Reddy S, Myers L. Radiology perspective of coronavirus disease 2019 (COVID-19): lessons from severe acute respiratory syndrome and Middle East respiratory syndrome. AJR Am J Roentgenol 2020;214(5):1078-82.
PUBMED | CROSSREF
22. Bernheim A, Mei X, Huang M, Yang Y, Fayad ZA, Zhang N, et al. Chest CT findings in coronavirus disease-19 (COVID-19): relationship to duration of infection. Radiology 2020;295(3):200463.
PUBMED | CROSSREF
23. Koo HJ, Lim S, Choe J, Choi SH, Sung H, Do KH. Radiographic and CT features of viral pneumonia.
Radiographics 2018;38(3):719-39.
PUBMED | CROSSREF
24. Hall CB. Respiratory syncytial virus and parainfluenza virus. N Engl J Med 2001;344(25):1917-28.
PUBMED | CROSSREF
25. Hui DS, Memish ZA, Zumla A. Severe acute respiratory syndrome vs. the Middle East respiratory syndrome. Curr Opin Pulm Med 2014;20(3):233-41.
PUBMED | CROSSREF
26. Davarpanah AH, Asgari R, Moharamzad Y, Mahdavi A, Abrishami A, Nekooghadam S, et al. Risk factors for poor outcome in patients with severe viral pneumonia on Chest CT during the COVID-19 outbreak: a perspective from Iran. SN Compr Clin Med 2020:1-11.
PUBMED | CROSSREF
27. Park B, Park J, Lim JK, Shin KM, Lee J, Seo H, et al. Prognostic implication of volumetric quantitative CT analysis in patients with COVID-19: a multicenter study in Daegu, Korea. Korean J Radiol 2020;21(11):1256-64.
PUBMED | CROSSREF
28. Chen N, Zhou M, Dong X, Qu J, Gong F, Han Y, et al. Epidemiological and clinical characteristics of 99 cases of 2019 novel coronavirus pneumonia in Wuhan, China: a descriptive study. Lancet 2020;395(10223):507-13.
PUBMED | CROSSREF
29. Chon Y, Kim JY, Suh YJ, Lee JY, Park JS, Moon SM, et al. Adverse initial CT findings associated with poor prognosis of coronavirus disease. J Korean Med Sci 2020;35(34):e316.
PUBMED | CROSSREF
30. Alsaad KO, Hajeer AH, Al Balwi M, Al Moaiqel M, Al Oudah N, Al Ajlan A, et al. Histopathology of Middle East respiratory syndrome coronovirus (MERS-CoV) infection - clinicopathological and ultrastructural study. Histopathology 2018;72(3):516-24.
PUBMED | CROSSREF
31. Nicholls JM, Poon LL, Lee KC, Ng WF, Lai ST, Leung CY, et al. Lung pathology of fatal severe acute respiratory syndrome. Lancet 2003;361(9371):1773-8.
PUBMED | CROSSREF