Introduction
Atrial fibrillation (AF) is the most common cardiac arrhyth- mia with a population prevalence of about 1%.1) Prevalence of diastolic heart failure is frequently correlated with AF occur- rence.2) The appearance of AF in patients with already im- paired left ventricular (LV) diastolic function significantly ag- gravates diastolic heart failure.3)
Tissue Doppler imaging (TDI) of mitral annular motion has been proposed to correct the influence of myocardial relax- ation on transmitral flows.4) The ratio of early diastolic trans-
mitral velocity and early mitral annular diastolic velocity (E/
E’) has provided better estimates of LV filling pressures than other methods.
Natriuretic peptides seem to be useful for assessment of dia- stolic function in patients with AF.2) N-terminal pro-brain na- triuretic peptide (NT-proBNP) appears to be a more discern- ing marker of early cardiac dysfunction than brain natriuretic peptide (BNP).5)
The aims of this study were: 1) to determine the relation- ship between echocardiographic parameters and serum NT- ORIGINAL ARTICLE J Cardiovasc Ultrasound 2011;19(1):26-31
Correlation between N-Terminal Pro-Brain Natriuretic Peptide and Doppler
Echocardiographic Parameters of Left Ventricular Filling Pressure in Atrial Fibrillation
Woo Shin Kim, MD and Seong-Hoon Park, MD
Division of Cardiology, Department of Internal Medicine, Medical Research Center, Mokdong Hospital, School of Medicine, Ewha Womans University, Seoul, Korea
Background: Atrial fibrillation (AF) is the most common cardiac arrhythmia with a population prevalence of about 1%.
Natriuretic peptide level is elevated in patients with AF with diastolic dysfunction even with a normal left ventricular (LV) ejection fraction. The N-terminal pro-brain natriuretic peptide (NT-proBNP) level and Doppler echocardiographic parameters for diastolic function have shown correlation with LV filling pressures. We aimed to evaluate the relationship between echocardiographic parameters and serum NT-proBNP in patients with AF with preserved LV ejection fraction.
Methods: We examined transthoracic echocardiography and NT-proBNP levels in the patients with AF and patients with sinus rhythm. Blood samples were taken for serum NT-proBNP measurements within 24 hours of echocardiographic examination.
The group 1 was the patients with sinus rhythm (n = 30, mean age 68 ± 13 years) and the group 2 was the patients with AF (n
= 33, mean age 70 ± 14 years).
Results: The group 2 patients had significantly higher mitral E, E’ (lateral annulus), E/E’ (septal annulus), left atrial (LA) volume index, LA size, pulmonary vein diastolic velocity, and NT-proBNP level than those of group 1 patients (p < 0.05). The area under the receiver-operating characteristic curve showed a NT-proBNP had good diagnostic power for E/E’ (septal annulus)
> 15 in patients with AF at cutoff value of 433 pg/mL.
Conclusion: NT-proBNP level is well correlated with Doppler echocardiographic parameters of diastolic function in patients with AF and preserved LV ejection fraction. NT-proBNP level more than 433 pg/mL may suggest elevated LV filling pressure in patients with AF.
KEY WORDS: Atrial fibrillation · NT-proBNP · Doppler echocardiography.
• Received: August 16, 2010 • Revised: November 22, 2010 • Accepted: December 1, 2010
• Address for Correspondence: Seong-Hoon Park, Division of Cardiology, Department of Internal Medicine, Mokdong Hospital, School of Medicine,
Ewha Womans University, 911-1 Mok-dong, Yangcheon-gu, Seoul 158-710, Korea Tel: +82-2-2650-5308, Fax: +82-2-2650-5424, E-mail: [email protected]
• This is an Open Access article distributed under the terms of the Creative Commons Attribution Non-Commercial License (http://creativecommons.org/licenses/by-nc/3.0) which permits unrestricted non-commercial use, distribution, and reproduction in any medium, provided the original work is properly cited.
proBNP levels in patients with AF, and 2) to investigate dif- ferences in NT-proBNP levels between patients with AF and patients with sinus rhythm.
Methods
The study population was consisted of 63 subjects (mean age 69.3 ± 13.3 years, 33 females and 30 males), who were re- ferred to the Echocardiographic Laboratory between 2009 and 2010. According to the rhythm, patients were divided into 2 groups. The group 1 was patients with normal sinus rhythm (n = 30, mean age 68 ± 13 years, 11 males). The group 2 was patients with AF (n = 33, mean age 70 ± 14 years, 19 males).
Echocardiographic examinations had been performed in the group 1 for the evaluation of chest discomfort, dyspnea, preop- erative risk, and hypertensive patients. For the patients of the group 2, we included patients with persistent/permanent AF and paroxysmal AF, defined as intermittent arrhythmia with at least 1 electrocardiogram-documented episode of AF. On examination of transthoracic echocardiography and NT-proB- NP level in the patients with paroxysmal AF, they were in AF.
Patients with AF were in New York Heart Association (NYHA) functional class I or II. The enrollment criteria qual- ified patients with preserved LV systolic function, defined as ejection fraction > 50% without valvular heart disease. The medical history was recorded from questionnaires and an in- terview by the physician. Patients with inadequate echocar- diographic images, congenital heart disease, a paced rhythm, pericardial disease, hypertrophic cardiomyopathy, restrictive cardiomyopathy, acute coronary syndrome, coronary artery by- pass within 6 months, or renal failure were excluded.
Conventional echocardiography and TDI were performed with NT-proBNP determination. Echocardiograms were ob- tained using commercially available ultrasound equipment (Acuson Sequoia C 512 with a 3.0 MHz transducer, Acuson Corp, Calif, USA, Philips Sonos 5500 with a 3.0 MHz trans- ducer, Philips, Andover, USA). All patients were examined at rest in the left lateral decubitus position. Two-dimensional imaging was performed in the standard fashion in parasternal long- and short-axis views and apical 4- and 2-chamber views.
The echocardiographic techniques and calculations of systolic and diastolic cardiac chamber dimensions and volumes were performed according to the recommendations of the Ameri- can Society of Echocardiography.6)7) Parameters were recorded for five consecutive cardiac cycles, and the results were aver- aged. Pulsed wave Doppler signals were recorded at a horizon- tal sweep of 100 mm/s. The left atrial (LA) dimension at the end of systole was assessed by M-mode cursor through the aor- tic valve in the parasternal short-axis view. Care was taken to obtain the smallest possible angle between the direction of transmitral flow and the ultrasound beam. Mitral inflow mea- surements included peak early velocity (E), peak late velocity (A), E/A ratio, and E wave deceleration time. Measurement of systolic pulmonary artery pressure was performed using the
average regurgitant velocity at the tricuspid valve by continu- ous Doppler. The TDI was set in pulsed-wave Doppler mode.
The motion of the mitral annulus was recorded in the apical four-chamber view. A 4-5 mm sample volume was positioned sequentially at the lateral and septal corners of the mitral an- nulus. Two major negative velocities were recorded with the movement of the annulus toward the base of the heart during diastole: one during the early phase of diastole (E’) and anoth- er during the late phase of diastole (A’). All measurements were performed by an experienced echocardiographer blinded to the NT-proBNP level.
NT-proBNP level was measured in blood samples collected by venous puncture into ethylen diamine tetra acetic acid tubes within 24 hours of an echocardiographic examination. The automated electrochemiluminescence immunoassay (Roche- cobas e 411, Roche Diagnostics, Basel, Switzerland) was used.
The echocardiographic data were stored on a 1/2-inch VHS videotape for subsequent playback, measurement, and analy- sis. All echocardiograms were interpreted by a cardiologist who was blinded to patient’s NT-proBNP level.
Statistical analysis
Data are presented as mean value ± standard deviation. Con- tinuous data are expressed as mean and 95% confidence inter- val. Comparison between groups of continuous variables were tested by independent samples t test and Chi-square test. Uni- variate analyses for categorical variables were calculated with Chi-square test. Correlation between NT-proBNP and echo- cardiographic parameters was determined by Pearson’s correla- tion coefficient. The backward stepwise manner was used in a multivariate analysis for evaluating the correlation of NT- proBNP with Doppler echocardiographic parameters. The re- ceiver operating characteristic (ROC) curve was applied to identify the appropriate cutoff point that have the best sensitiv- ity and specificity. All statistical analyses used the software package SPSS version 17.0 (SPSS Inc., Chicago, IL, USA). A p value of < 0.05 was accepted as statistically significant.
Results
The basic clinical data of the study groups are presented in Table 1. The proportion of subjects with cerebrovascular disease was significantly higher in group 2 than group 1 (p < 0.05). For other variables, there was no difference between the groups.
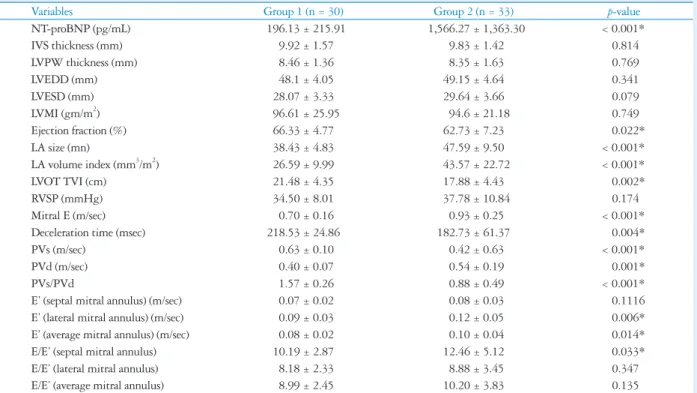
All the echocardiographic parameters and NT-proBNP of the two studying groups were compared on Table 2. The NT- proBNP level of group 2 were significantly higher than that of group 1 (p < 0.01). The group 2 had significantly higher mitral E, E’ (lateral annulus), E’ (average annulus), E/E’ (septal annulus), LA volume index, LA size, and pulmonary vein dia- stolic velocity (PVd) than those of the group 1 (p < 0.05). How- ever, the group 1 had significantly higher ejection fraction, LV outflow tract time velocity integral (TVI), pulmonary vein systolic velocity (PVs), PVs/PVd, and mitral E deceleration
time than those of the group 2 (p < 0.05).
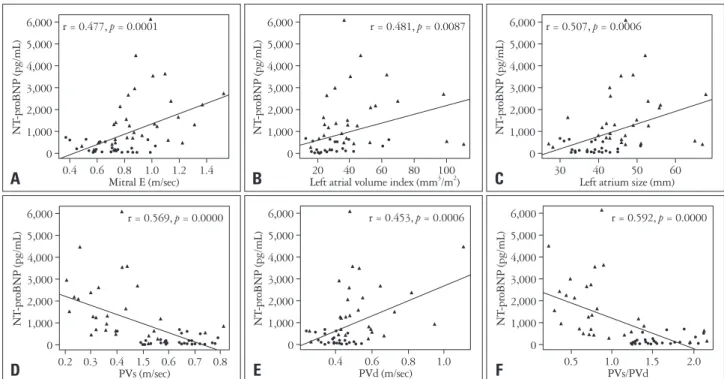
In the present study, significant correlations were found be- tween NT-proBNP level and the echocardiographic variables as shown the Fig. 1 and Table 3. Positive correlations were ob-
served between NT-proBNP and mitral E, E/E’ (lateral annu- lus), E/E’ (average annulus), LA size, LA volume index, and PVd. Negative correlations were found between NT-proBNP and deceleration time, LV outflow tract TVI, PVs, and PVs/
Table 1. Baseline characteristics of the patients
Variables Group 1 Group 2 p-value
Age (years) 68 ± 13 70 ± 14 0.593
Gender (female/male) 19 (63.3%)/11 (36.7%) 14 (42.4%)/19 (57.5%) 0.159
Body mass index (kg/m2) 23.51 ± 3.04 23.86 ± 2.89 0.773
Body surface area (m2) 1.55 ± 0.26 1.68 ± 0.18 0.059
Heart rate (beats/min) 72.80 ± 12.50 82.91 ± 24.23 0.051
Systolic BP (mmHg) 133 ± 28.20 131.53 ± 21.70 0.820
Diastolic BP (mmHg) 75.8 ± 14.71 78.69 ± 11.54 0.396
CCr (mL/min) 81.28 ± 25.17 74.73 ± 18.45 0.265
Hypertension 14 (46.7%) 24 (72.7%) 0.064
Diabes mellitus 10 (33.3%) 8 (24.2%) 0.604
Chronic ischemic disease 6 (20%) 4 (12.1%) 0.908
Old myocardial infarction 1 (3.3%) 1 (3%) 0.857
Cerebrovascular disease 1 (3.3%) 12 (36.4%) 0.004
Duration of AF, days 935 ± 1,183 0.871
Duration of therapy, days 595 ± 971 0.610
ACEI/ARB use 12 (36.4%) 0.033
Beta blocker use 10 (30.3%) 0.167
Data are presented as mean ± SD or No. (%). *p < 0.05. Group 1: patients with normal sinus rhythm, Group 2: patients with atrial fibrillation. BP: blood pressure, CCr: creatinine clearance, AF: atrial fibrillation, ACEI: angiotensin-converting enzyme inhibitor, ARB: angiotensin receptor blocker
Table 2. Comparison of each parameters in the group 1 and the group 2
Variables Group 1 (n = 30) Group 2 (n = 33) p-value
NT-proBNP (pg/mL) 196.13 ± 215.91 1,566.27 ± 1,363.30 < 0.001*
IVS thickness (mm) 9.92 ± 1.57 9.83 ± 1.42 0.814
LVPW thickness (mm) 8.46 ± 1.36 8.35 ± 1.63 0.769
LVEDD (mm) 48.1 ± 4.05 49.15 ± 4.64 0.341
LVESD (mm) 28.07 ± 3.33 29.64 ± 3.66 0.079
LVMI (gm/m2) 96.61 ± 25.95 94.6 ± 21.18 0.749
Ejection fraction (%) 66.33 ± 4.77 62.73 ± 7.23 0.022*
LA size (mn) 38.43 ± 4.83 47.59 ± 9.50 < 0.001*
LA volume index (mm3/m2) 26.59 ± 9.99 43.57 ± 22.72 < 0.001*
LVOT TVI (cm) 21.48 ± 4.35 17.88 ± 4.43 0.002*
RVSP (mmHg) 34.50 ± 8.01 37.78 ± 10.84 0.174
Mitral E (m/sec) 0.70 ± 0.16 0.93 ± 0.25 < 0.001*
Deceleration time (msec) 218.53 ± 24.86 182.73 ± 61.37 0.004*
PVs (m/sec) 0.63 ± 0.10 0.42 ± 0.63 < 0.001*
PVd (m/sec) 0.40 ± 0.07 0.54 ± 0.19 0.001*
PVs/PVd 1.57 ± 0.26 0.88 ± 0.49 < 0.001*
E’ (septal mitral annulus) (m/sec) 0.07 ± 0.02 0.08 ± 0.03 0.1116
E’ (lateral mitral annulus) (m/sec) 0.09 ± 0.03 0.12 ± 0.05 0.006*
E’ (average mitral annulus) (m/sec) 0.08 ± 0.02 0.10 ± 0.04 0.014*
E/E’ (septal mitral annulus) 10.19 ± 2.87 12.46 ± 5.12 0.033*
E/E’ (lateral mitral annulus) 8.18 ± 2.33 8.88 ± 3.45 0.347
E/E’ (average mitral annulus) 8.99 ± 2.45 10.20 ± 3.83 0.135
*p < 0.05. Group 1: patients with normal sinus rhythm, Group 2: patients with atrial fibrillation. NT-proBNP: N-terminal pro-brain natriuretic peptide, IVS: interventricular septum, LVPW: left ventricular posterior free wall, LVEDD: left ventricular end-diastolic dimension, LVESD: left ventricular end-systolic dimension, LVMI: left ventricular mass index, LA: left atrium, LVOT TVI: left ventricular outflow track time velocity integral, RVSP: right ventricular systolic pressure, PVs: pulmonary vein systolic velocity, PVd: pulmonary vein diastolic velocity, PVs/PVd: ratio of PVs/PVd, E’ (average mitral annulus) (m/sec): The average E’ of both septal mitral annulus and lateral mitral annulus, E/E’: ratio of mitral E-velocity and mitral annular E’ velocity, E/E’(average mitral annulus):
ratio of mitral E-velocity and average E’
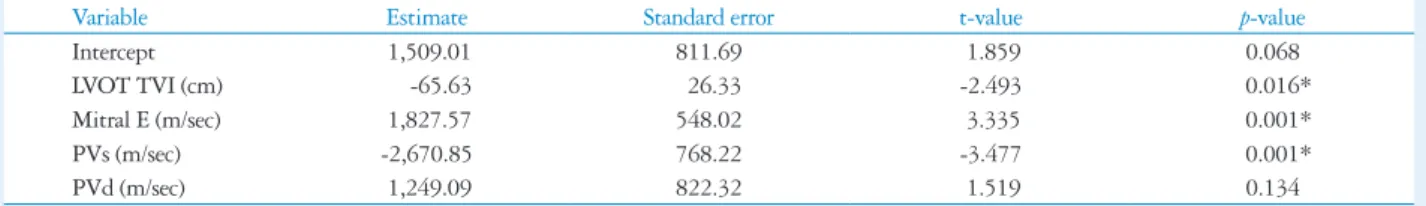
PVd. By multivariate analysis using backward stepwise man- ner, mitral E (p = 0.001), LV outflow track TVI (p = 0.016),
PVs (p = 0.001), and PVd (p = 0.134) were associated with NT-proBNP (Table 4). We could not demonstrate significant relationships between NT-proBNP and the E’, E/E’ (septal an- nulus), LV end-diastolic dimension, ejection fraction, and right ventricular systolic pressure.
The ability of NT-proBNP to detect E/E’ (septal annulus)
>15 assessed with the ROC curve analysis (as shown in Fig. 2) showed significance as the area under the curve 1. Cutoff value of a NT-proBNP level 433 pg/mL was associated with the most optimal sensitivity (100%) and specificity (100%) for detecting E/E’ (septal annulus) > 15 in patients with AF. On the other hand, a NT-proBNP value of 280 pg/mL had a sen- sitivity of 88%, a specificity of 88% for predicting E/E’ (later- al annulus) < 8 in patients with normal sinus rhythm.
Discussion
In this study, we showed that the NT-proBNP correlates with the LV filling pressure. NT-proBNP has been known to be elevated in cardiac dysfunction and is widely used for both the diagnosis and evaluation of heart failure.8) Elevated levels of NT-proBNP have been found to predict occurrence of new AF in subjects obtained from the general population,9) and postoperative AF in patients undergoing surgery.10)11) In this study, we found NT-proBNP levels to be significantly elevat- ed in patients with AF compared to the patients with sinus rhythm. Atrial enlargement and LV diastolic dysfunction were noted in patients with AF.12) In patients with AF, the higher level of NT-proBNP may also be associated with impairment of cardiac function or with an unfavorable hemodynamic pro-
Table 3. Correlation between NT-proBNP and Doppler echocardio- graphic parameters
Variable r p
LVEDD (mm) 0.212 0.647
Ejection fraction (%) -0.153 0.177
LA size (mn) 0.507 0.001*
LA volume index (mm3/m2) 0.481 0.009*
LVOT TVI (cm) -0.404 0.001*
RVSP (mmHg) 0.195 0.106
Mitral E (m/sec) 0.477 < 0.001*
Deceleration time (msec) -0.419 0.001*
PVs (m/sec) -0.569 < 0.001*
PVd (m/sec) 0.453 0.001*
PVs/PVd -0.592 < 0.001*
E’ (septal mitral annulus) (m/sec) 0.198 0.155 E’ (lateral mitral annulus) (m/sec) 0.202 0.430 E’ (average mitral annulus) (m/sec) 0.143 0.264 E/E’ (septal mitral annulus) 0.214 0.064 E/E’ (lateral mitral annulus) 0.260 0.022*
E/E’ (average mitral annulus) 0.287 0.023*
*p < 0.05. r: pearson’s correlation coefficient. NT-proBNP: N-terminal pro- brain natriuretic, peptide, LVEDD: left ventricular end-diastolic dimension, LA: left atrium, LVOT TVI: left ventricular outflow track time velocity integral, RVSP: right ventricular systolic pressure, PVs: pulmonary vein systolic velocity, PVd: pulmonary vein diastolic velocity, PVs/PVd: ratio of PVs/PVd, E’ (average mitral annulus) (m/sec): The average E’ of both septal mitral annulus and lateral mitral annulus, E/E’: ratio of mitral E-veolicty and mitral annular E’ velocity, E/E’(average mitral annulus): ratio of mitral E-velocity and average E’
Fig. 1. Scatter plots showing the correlation between plasma NT-proBNP level and Mitral E (A), left atrial volume index (B), left atrial size (C), PVs (D), PVd (E), and PVs/PVd (F). Group 1: patients with normal sinus rhythm, manifested by ●, Group 2: patients with atrial fibrillation, manifested by ▲.
NT-proBNP: N-terminal pro-brain natriuretic peptide, PVs: pulmonary vein systolic velocity, PVd: pulmonary vein diastolic velocity, PVs/PVd: ratio of PVs/PVd.
0
0.4 0.6 0.8 1.0 1.2 1.4 1,000
2,000 3,000 4,000 5,000 6,000
NT-proBNP (pg/mL)
Mitral E (m/sec) r = 0.477, p = 0.0001
0
20 40 60 80 100
1,000 2,000 3,000 4,000 5,000 6,000
NT-proBNP (pg/mL)
Left atrial volume index (mm3/m2) r = 0.481, p = 0.0087
0
30 40 50 60
1,000 2,000 3,000 4,000 5,000 6,000
NT-proBNP (pg/mL)
Left atrium size (mm) r = 0.507, p = 0.0006
0
0.2 0.3 0.4 1.5 0.6 0.7 0.8 1,000
2,000 3,000 4,000 5,000 6,000
NT-proBNP (pg/mL)
PVs (m/sec)
r = 0.569, p = 0.0000
0
0.4 0.6 0.8 1.0
1,000 2,000 3,000 4,000 5,000 6,000
NT-proBNP (pg/mL)
PVd (m/sec)
r = 0.453, p = 0.0006
0
0.5 1.0 1.5 2.0
1,000 2,000 3,000 4,000 5,000 6,000
NT-proBNP (pg/mL)
PVs/PVd
r = 0.592, p = 0.0000
A B C
D E F
file and altered LV filling pattern resulting from the loss of atrial contraction. The exact mechanisms underlying elevated level of NT-proBNP in AF patients are not clear. Myocardial stretch, local ischemia, and oxidative stress in the atrial wall have been proposed as contributing mechanisms.13)
In the present study, we analyzed the correlation between several Doppler parameters and NT-proBNP plasma level in consecutive patients with sinus rhythm and AF referred for echocardiographic examination.
A reduction in systolic pulmonary venous blood flow ex- pressed by reduced peak velocity, velocity time integral of sys- tolic flow, and systolic fraction of pulmonary venous blood flow was found to be attributable to AF.14) Those patterns of pulmonary venous blood flow changes are related with LA dysfunction, mainly in atrial relaxation, compliance, and res- ervoir function.15) Assessment of pulmonary venous blood flow variables and patterns by Doppler echocardiography seems useful in the management of AF patients.16) Especially, the re- duction in systolic pulmonary venous blood flow may be used as marker for LA dysfunction which favors thrombus forma- tion and AF reinitiation.16)
TDI is feasible and useful in assessment of LV systolic and diastolic function.17) The E/E’ reflects LV filling pressure in a variety of cardiac diseases. E/E’ ratio, which is known to be an echocardiographic marker of LV filling pressure, was also re- lated to NT-proBNP level, but the correlation was weaker.18) In the study by Sohn et al.,19) in which most of the patients had chronic AF, an E/E’ ratio of ≥ 11 predicted elevated LV filling pressure (≥ 15 mmHg) with a sensitivity of 75% and a speci- ficity of 93%. Ommen et al.7) showed that E/E’ has the high- est predictive accuracy, and that septal E/E’ has the best ROC curve for predicting the mean LV diastolic pressure. E/E’ > 15 identified increased LV diastolic pressure (86% specificity and 64% positive predictive value), and E/E’ < 8 accurately predict- ed normal LV diastolic pressure (97% negative predictive val- ue). Similar to our study, Mak et al.20) showed BNP level is use- ful for evaluation of LV diastolic function as well as TDI data.
The E/E’ measured at the septal and lateral annulus corre- lated well with NT-proBNP in our study.
Data about relationship between conventional echocardio- graphic parameters and plasma level of natriuretic peptide are in controversy. Mornos et al.21) reported significant but weak correlations between NT-proBNP level and E/E’ ratio, PVs,
pulmonary vein atrial flow reversal velocity, LV ejection frac- tion, heart rate, LA size and mitral E deceleration time in pa- tients with sinus rhythm. However, in the study of Mornos et al.,21) no significant correlation was demonstrated between na- triuretic peptide and other echocardiographic and Doppler pa- rameters in patients with sinus rhythm.
Shortening of the early diastolic deceleration time of the mitral E-wave suggests impaired LV filling and increased LA pressure and it has been known as a strong predictor of an ad- verse outcome in symptomatic and asymptomatic individuals with LV dysfunction.22) Ommen et al.7) demonstrated signifi- cant correlation between deceleration time and LV filling pres- sure among patients with ejection fraction < 50%, but not in those with ejection fraction > 50%. But in the study by Sohn et al.,19) deceleration time of mitral inflow did not correlate with wedge pressure.
LA volume index, LV mass index and duration of AF are in- dependent predictors of plasma BNP levels in patients with chronic AF and preserved LV systolic function.23)
This study had some limitations. First, this was a small ob- servational and cross-sectional study without any long-term follow-up data. The small population of the study group lim- its the study and although the results achieved statistical sig- nificance, they must be considered carefully and require fur- ther investigation and confirmation in a larger cohort. Second, we did not performed cardiac catheterization with simultane- ous Doppler interrogation.
Fig. 2. ROC curve for NT-proBNP value of 433 pg/mL in prediction of E/
E’ (septal annulus) > 15 in patients with atrial fibrillation. ROC: receiver operating characteristic, NT-proBNP: N-terminal pro-brain natriuretic peptide.
Table 4. Factors predicting correlation between NT-proBNP and Doppler echocardiographic parameters by backward stepwise multivariate lin- ear regression analysis
Variable Estimate Standard error t-value p-value
Intercept 1,509.01 811.69 1.859 0.068
LVOT TVI (cm) -65.63 26.33 -2.493 0.016*
Mitral E (m/sec) 1,827.57 548.02 3.335 0.001*
PVs (m/sec) -2,670.85 768.22 -3.477 0.001*
PVd (m/sec) 1,249.09 822.32 1.519 0.134
*p < 0.05. NT-proBNP: N-terminal pro-brain natriuretic peptide, LVOT TVI: left ventricular outflow track time velocity integral, PVs: pulmonary vein systolic velocity, PVd: pulmonary vein diastolic velocity
0.0 0.2 0.4 0.6 0.8 1.0
0.0 0.2 0.4 0.6 0.8 1.0
Sensitivity
1-Specificity ROC
Area under the curve: 1.000
In conclusion, NT-proBNP level is well correlated with Doppler echocardiographic parameters of diastolic function in patients with AF and preserved LV ejection fraction.
NT-proBNP level more than 433 pg/mL may suggest ele- vated LV filling pressure in patients with AF.
References
1. Go AS, Hylek EM, Phillips KA, Chang Y, Henault LE, Selby JV, Singer DE. Prevalence of diagnosed atrial fibrillation in adults: national implications for rhythm management and stroke prevention. The Anticoagu- lation and Risk Factors in Atrial Fibrillation (ATRIA) Study. J Am Med Assoc 2001;285:2370-5.
2. Bakowski D, Wozakowska-Kaplon B, Opolski G. The influence of left ventricle diastolic function on natriuretic peptides levels in patients with atri- al fibrillation. Pacing Clin Electrophysiol 2009;32:745-52.
3. Oki T, Tabata T, Yamada H, Wakatsuki T, Fukuda K, Abe M, On- ose Y, Iuchi A, Fukuda N, Ito S. Evaluation of left atrial filling using systolic pulmonary venous flow velocity measurements in patients with atrial fibrillation. Clin Cardiol 1998;21:169-74.
4. Nagueh SF, Mikati I, Kopelen HA, Middleton KJ, Quiñones MA, Zoghbi WA. Doppler estimation of left ventricular filling pressure in sinus tachycardia: A new application of tissue Doppler imaging. Circulation 1998;98:1644-50.
5. Seino Y, Ogawa A, Yamashita T, Fukushima M, Ogata K, Fukumo- to H, Takano T. Application of NT-proBNP and BNP measurements in cardiac care: a more discerning marker for the detection and evaluation of heart failure. Eur J Heart Fail 2004;6:295-300.
6. Schiller NB, Shah PM, Crawford M, DeMaria A, Devereux R, Fei- genbaum H, Gutgesell H, Reichek N, Sahn D, Schnittger I. Recom- mendations for quantitation of the left ventricular by two-dimensional echo- cardiography. American Society of Echocardiography committee on standards, subcommittee on quantitation of two-dimensional echocardiograms. J Am Soc Echocardiogr 1989;2:358-67.
7. Ommen SR, Nishimura RA, Appleton CP, Miller FA, Oh JK, Red- field MM, Tajik AJ. Clinical utility of Doppler echocardiography and tis- sue Doppler imaing in the estimation of left ventricular filling pressures: A comparative simultaneous Doppler-catheterization study. Circulation 2000;
102:1788-94.
8. Ulimoen SR, Enger S, Tveit A. Impact of atrial fibrillation on NT- proBNP levels in a 75-year-old population. Scand J Clin Lab Invest 2009;
69:579-84.
9. Asselbergs FW, van den Berg MP, Bakker SJ, Signorovitch JE, Hill- ege HL, van Gilst WH, van Veldhuisen. N-terminal pro B-type natri- uretic peptide levels predict newly detected atrial fi brillation in a population- based cohort. Neth Heart J 2008;16:73-8.
10. Hou JL, Gao K, Li M, Ma JY, Shi YK, Wang Y, Zhao YF. Increased N-
terminal pro-brain natriuretic peptide level predicts atrial fi brillation after surgery for esophageal carcinoma. World J Gastroenterol 2008;14:2582-5.
11. Cardinale D, Colombo A, Sandri MT, Lamantia G, Colombo N, Civelli M, Salvatici M, Veronesi G, Veglia F, Fiorentini C, Spaggiari L, Cipolla CM. Increased perioperative N-terminal pro-B-type natriuretic peptide levels predict atrial fi brillation after thoracic surgery for lung cancer.
Circulation 2007;115:1339-44.
12. Chung IM, Chung Nk, Choi DH, Shim WH, Cho SY, Kim SS. Mor- phological Characteristics and Left Ventricular Function in Patients with Lone Atrial Fibrillation. J Cardiovasc Ultrasound 1994;2:179-86.
13. Hall C. NT-ProBNP: the mechanism behind the marker. J Card Fail 2005;11:S81-3.
14. Ren WD, Visentin P, Nicolosi GL, Canterin FA, Dall’Aglio V, Les- tuzzi C, Mimo R, Pavan D, Sparacino L, Cervesato E, Zanuttini D.
Effect of atrial fibrillation on pulmonary venous flow patterns: Transoesopha- geal pulsed Doppler echocardiographic study. Eur Heart J 1993;14:1320-7.
15. Chen YT, Kan MN, Lee AY, Chen JS, Chiang BN. Pulmonary venous flow: Its relationship to left atrial and mitral valve motion. J Am Soc Echo- cardiogr 1993;6:387-94.
16. Bollmann A. Pulmonary venous flow assessed by Doppler echocardiography in the management of atrial fibrillation. Echocardiography 2007;24:430-5.
17. Vinereanu D, Florescu N, Sculthorpe N, Tweddel AC, Stephens MR, Fraser AG. Differentiation between pathologic and physiologic left ventricu- lar hypertrophy by tissue Doppler assessment of long-axis function in patients with hypertrophic cardiomyopathy or systemic hypertension and in athletes.
Am J Cardiol 2001;88:53-8.
18. Tretjak M, Verovnik F, Benko D, Kozelj M. Tissue Doppler velocities of mitral annulus and NT-proBNP in patients with heart failure. Eur J Heart Fail 2005;7:520-4.
19. Sohn DW, Song JM, Zo JH, Chai IH, Kim HS, Chun HG, Kim HC. Mitral annulus velocity in the evaluation of left ventricular diastolic function in atrial fibrillation. J Am Soc Echocardiogr 1999;12:927-2931.
20. Mak GS, De Maria A, Clopton P, Maisel AS. Utility of B-natriuretic peptide in the evaluation of left ventricular diastolic function: Comparison with tissue Doppler imaging recordings. Am Heart J 2004;148:895-902.
21. Mornos C, Ionac A, Cozma D, Rusinaru D, Maximov D, Petrescu L, Lupu A, Dragulescu SI. The relationship between tissue Doppler imaging and seric NTproBNP levels in sinus rhythm patients: a prospective study. Int J Cardiovasc Imaging 2008;24:399-407.
22. Wang M, Yip GW, Wang AY, Zhang Y, Ho PY, Tse MK, Lam PK, Sanderson JE. Peak early diastolic mitral annulus velocity by tissue Dop- pler imaging adds independent and incremental prognostic value. J Am Coll Cardiol 2003;41:820-6.
23. Hwang SJ, Kim BJ, Sung KC, Kim BS, Kang JH, Lee MH, Park JR.
Assessment of factors affecting plasma BNP levels in patients with chronic atrial fibrillation and preserved left ventricular systolic function. Korean Cirulation J 2005;35:605-12.