the global prevalence of MS between nations.5)
Visceral obesity and insulin resistance may appear to be the important factors of the development of MS. Visceral fat accu- mulation is related with atherosclerosis and adverse cardiovas- cular consequences, as many pro-inflammatory cytokines are secreted from visceral adipose tissue.1)3)
MS has not been well studied on pediatric populations.6) Al- though, it is known that as the risk factors for MS increase, the occurrence also does. But, the underling pathogenesis of MS remains unclear.
Recently, tissue Doppler imaging (TDI) was reported to be appropriate for evaluating early changes in systolic and dia- Introduction
The definition of metabolic syndrome (MS) consists of at least three risk factors associated with type 2 diabetes mellitus and cardiovascular disease (CVD).1)2) In recent days, the preva- lence of childhood MS has increased dramatically due to the increasing rate of childhood obesity.3)
However, research on this disease has been difficult because of lack of agreement on a definition of childhood MS. Until now, most definitions have been adapted from the Adult Treatment Panel III definition.4) In addition to this definition, the International Diabetes Federation released its definition of MS in children and adolescents in 2007 in order to measure
ORIGINAL ARTICLE J Cardiovasc Ultrasound 2015;23(1):10-19
Cardiovascular Screening in Asymptomatic Adolescents with Metabolic Syndrome
Hyun Kyung Bae, MD1, Han Seul Choi, MD1, Sejung Sohn, MD1, Hye-Jung Shin, MD2, Jae-Hwan Nam, PhD3, and Young Mi Hong, MD1
1Department of Pediatrics, Ewha Womans University School of Medicine, Seoul, Korea
2Department of Pediatrics, National Medical Center, Seoul, Korea
3Department of Biotechnology, The Catholic University of Korea, Bucheon, Korea
Background: In recent days, the prevalence of childhood metabolic syndrome (MS) has increased substantially due to the increasing rate of childhood obesity on a global scale. The aims of this study were to detect the important parameters and provide the screening system to prevent cardiovascular disease in adolescents with MS.
Methods: Ninety one male adolescents were divided into two groups based on the presence or absence of MS. Anthropometric measurement and laboratory study were studied. Intimal medial thickness and pulse wave velocity were estimated. Left ventricular mass index (LVMI), ejection fraction, myocardial velocity, strain and strain rate were measured by tissue Doppler imaging and strain rate imaging.
Results: The prevalence of MS was 7.7%. Weight, body mass index (BMI), waist circumference (WC), glucose, insulin, homeostasis model assessment of insulin resistance, triglyceride and LVMI were significantly increased in the MS group. High density lipoprotein-cholesterol (HDL-C), peak early diastolic myocardial velocity (e’), systolic myocardial velocity (s’) and global longitudinal strain were significantly lower in the MS group. In univariant analysis, LVMI was significantly correlated with BMI, WC, fat %, fat mass, systolic blood pressure, alanine aminotransferase, total cholesterol (TC) and low density lipoprotein-cholesterol.
e’ was significantly correlated with BMI, fat %, fat mass, and HDL-C. Global circumferential strain had significant correlation with glucose and TC. Basal anterolateral strain rate was significantly correlated with weight, BMI, WC, fat %, and fat mass.
Conclusion: LVMI, strain and strain rate are practical and accurate parameters for assessment of left ventricular function in adolescents with MS.
KEY WORDS: Metabolic syndrome · Adolescent · Tissue Doppler imaging · Strain rate.
• Received: November 21, 2014 • Revised: January 5, 2015 • Accepted: February 27, 2015
• Address for Correspondence: Young Mi Hong, Department of Pediatrics, Ewha Womans University School of Medicine, 1071 Anyangcheon-ro, Yangcheon-gu, Seoul 158-710, Korea Tel: +82-2-2650-2841, Fax: +82-2-2653-3718, E-mail: [email protected]
• This is an Open Access article distributed under the terms of the Creative Commons Attribution Non-Commercial License (http://creativecommons.org/licenses/by-nc/3.0) which permits unrestricted non-commercial use, distribution, and reproduction in any medium, provided the original work is properly cited.
viding the body weight in kilograms by height in meters. Fat mass and fat % were estimated by bioelectric impedance anal- ysis (InBody 720, Biospace Co., Ltd., Seoul, Korea).
Blood pressure was measured using an automatic oscillo- metric method, Dinamap, Procare-200 (GE Medical System, Milwaukee, WI, USA) in a supine position after 10 minutes of adequate rest.
Laboratory measurement
Blood was drawn from all 91 adolescents, who had fasted for 14 hours prior to their blood sampling to determine the following parameters: blood glucose, total cholesterol (TC), HDL-C, low density lipoprotein-cholesterol (LDL-C), triglyc- eride (TG), aspartate aminotransferase, alanine aminotransfer- ase (ALT). And, high sensitive C-reactive protein was also esti- mated.
Insulin resistance was measured by the homeostasis model assessment of insulin resistance (HOMA-IR), which was cal- culated by dividing the multiple of insulin (μU/mL) and serum glucose (mmol/L).
Echocardiographic parameters
Echocardiography was performed using the IE33 machine (Philips Medical System, Andover, MA, USA) with an S5-1 transducer. Standard parasternal and apical views were ac- quired. Complete two-dimensional (2D) and M-mode echo- cardiogram, pulsed, color-flow Doppler, and TDI (Fig. 1) were obtained in the left lateral decubitus position. We measured the following LV parameters by M-mode echocardiography:
interventricular septal wall thickness, posterior wall thickness, and LV end diastolic dimension at the chordae tendina level.
The LV mass (LVM) and LV mass index (LVMI) were calculat- ed. Ejection fraction (EF) was determined by using the bi- plane Simpson formula and fractional shortening was calculat- ed using LV internal dimensions.
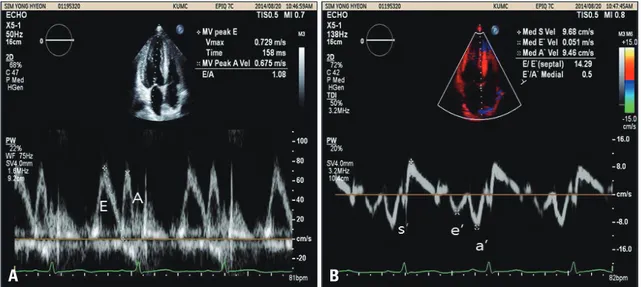
The diastolic function was assessed with pulsed Doppler mode from the apical window. Early diastolic (E), late atrial (A) peak velocities, E/A ratios, and deceleration time were per- formed using conventional pulsed wave Doppler echocardiog- raphy (Fig. 2).
To obtain longitudinal myocardial velocity, strain and strain rate with high quality, a narrow sector angle was used and im- stolic left ventricle (LV) function.7)8) Detection of myocardial
deformation by TDI during the subclinical period in obese patients is important in clinical follow-up and in determining the prognosis.9-12)
Strain and strain rate imaging (SRI) have been proposed as a noninvasive echocardiographic technique to quantify regional myocardial function at rest and during acute and chronic isch- emia.13)14) SRI is independent of cardiac rotational motion and a tethering effect.15)
There are several studies in adult with MS by strain and SRI. However, the results are controvertial.16-19) The efficacy of strain and SRI has not been determined in adolescents with MS. There are limited data on subclinical LV systolic dysfunc- tion in overweight and morbid obese children.7)9)
The aim of this study was to investigate cardiac structural and functional alterations in adolescents with MS and to com- pare those with control subjects to screen for MS in asymp- tomatic adolescents and to evaluate the impact of MS on glob- al LV function by TDI and SRI.
Methods Study population
Ninety one healthy male adolescents aged between 14 and 15 participated in this study. They were divided into two groups based on the presence or absence of MS (MS group, non-MS group). Obesity was defined by body mass index (BMI) above the 95th percentile for age and sex as it is defined by Korean Centers of Disease Control and Prevention in 2007. People with endocrine dysfunction or other illnesses were excluded.
We obtained informed consent from their guardians after ex- plaining the procedure and purpose of the test thoroughly, and the study was approved by the Institutional Review Board of Ewha Womans University.
Diagnosis of metabolic syndrome
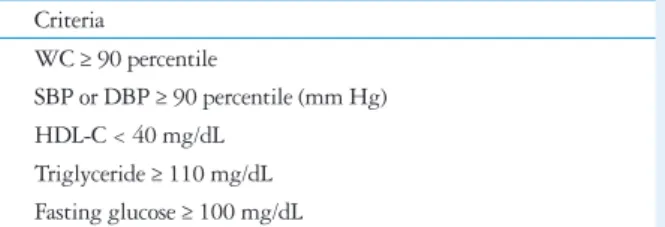
The diagnosis of MS was based on modified Cook’s defini- tions (Table 1). In our study, the cut off value of fasting glu- cose was 100 mg/dL. MS was defined as having more than three components for their age and gender of the following metabolic abnormalities: abdominal obesity, [waist circumfer- ence (WC) ≥ 90 percentile], hypertriglyceridemia [serum tri- glyceride ≥ 110 (mg/dL)], low high density lipoprotein-choles- terol (HDL-C < 40 mg/dL), high fasting plasma glucose (fasting plasma glucose ≥ 100 mg/dL), and high blood pres- sure [≥ 90 percentile (mm Hg)].
Anthropometric measurement
We obtained anthropometric data of weight, height, WC, BMI, fat mass, and fat % from both groups. WC was mea- sured with a tapeline at the mid-waist point between the low- est margin of the 12th rib and the mid portion of the superior iliac crest at minimal respiration. BMI was calculated by di-
Table 1. Definitions of metabolic syndrome in adolescents Criteria
WC ≥ 90 percentile
SBP or DBP ≥ 90 percentile (mm Hg) HDL-C < 40 mg/dL
Triglyceride ≥ 110 mg/dL Fasting glucose ≥ 100 mg/dL
WC: waist circumference, SBP: systolic blood pressure, DBP: diastolic blood pressure, HDL-C: high density lipoprotein-cholesterol
Global strain was calculated as the average of the segments when six segments were measurable. Peak systolic strain rate was measured (Fig. 2).
Carotid intimal medial thickness
cIMT was measured with an ultrasonogram to which a 12 MHz linear transducer was installed (CX50 machine; Philips Medical System, Andover, MA, USA). cIMT by an experi- enced technician unaware of the group to which the subject patients were assigned. The subject patients were given the test in a lying position with their head slight turned. Within 1 cm from the junction of the right common carotid artery, the cIMT and vascular diameter of the vessel during the systolic and dia- stolic periods were measured. cIMT was defined as the dis- age depth was adjusted to allow for a high frame rate (130–160
frames/s) with care taken to avoid angulations. The myocardial time-velocity and time-deformation curves were reconstructed off-line from color coded 2D tissue Doppler image loops. The peak systolic (s’), early diastolic (e’), and late diastolic longitu- dinal myocardial velocities (a’) were measured at the basal sep- tum from 4-chamber views (Fig. 2).
A single investigator who was blinded to the clinical data performed. Circumferential strain curves from the short-axis view (six segments: anteroseptal, anterior, lateral, posterior, in- ferior, and septal) and longitudinal strain curves from the api- cal four-chamber view (six segments: basal interventricular sep- tum, basal anterolateral, medium interventricular septum, medium anterolateral, apical septum, apical lateral septum).
Fig. 1. Mitral flow by conventional pulse Doppler imaging and tissue Doppler imaging. A: Early diastolic (E), late atrial (A) peak velocities in mitral inflow by conventional pulse Doppler imaging. B: Systolic myocardial velocity (s’), peak early diastolic myocardial velocity (e’), peak late diastolic myocardial velocity (a’) by tissue Doppler imaging.
Fig. 2. Two-dimensional (2D) strain and strain rate by strain rate imaging. 2D strain imaging showing left ventricular longitudinal strain (A) and strain rate imaging (B). BIS: basal interventricular septum, BAL: basal anterolateral, MIS: medium interventricular septum, MAL: medium anterolateral, ApS: apical septum, ApL: apical lateral septum.
A
A
B
B
dL (71.4%), followed by WC ≥ 90 percentile (42.9%), systol- ic blood pressure (SBP) or diastolic blood pressure ≥ 90 per- centile mm Hg (42.9%) (Table 3).
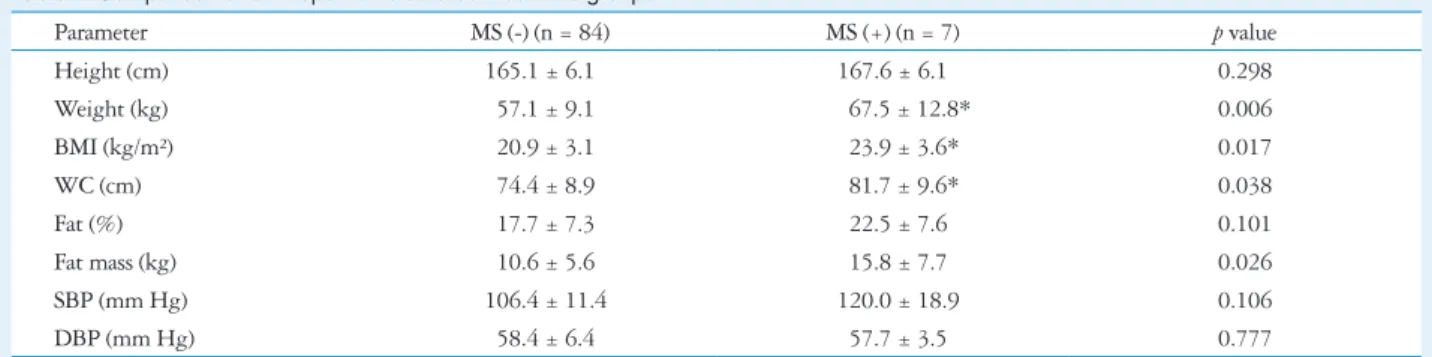
Comparison of anthropometric data
Weight, BMI, and WC were significantly higher in the MS group compared with the non-MS group (Table 4).
Comparison of biochemistry data
In the laboratory tests, glucose, insulin, HOMA-IR, and TG were significantly higher in the MS group compared with the non-MS group.
HDL-C was significantly lower in the MS group compared with the non-MS group (Table 5).
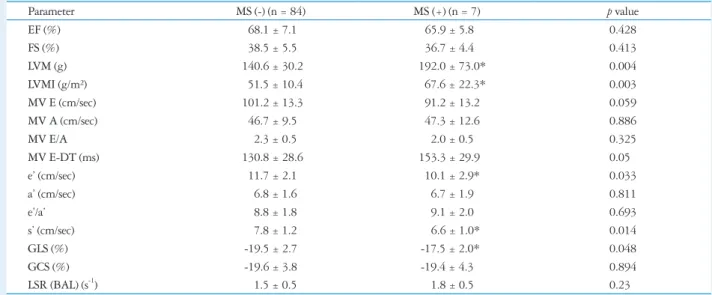
Comparison of echocardiographic data
LVM was significantly higher in the MS group compared with the non-MS group (192.0 ± 73.0 g vs. 140.6 ± 30.2 g, p
< 0.05, p < 0.05). LVMI were significantly higher in the MS group compared with the non-MS group (67.6 ± 22.3 g vs.
tance between the two points which were observed as bright images on echocardiography.
Pulse wave velocity and ankle brachial index Brachial-ankle pulse wave velocity (baPWV) and ankle bra- chial index were measured in a supine position using a vol- ume-plethysmographic apparatus (Colin Co. Ltd., Komaki, Japan). The average of the left and right baPWVs in each sub- ject was used as the PWV.
Statistical analyses
We performed all statistical analyses using Statistical Pack- age for the Social Sciences (SPSS) (version 20, SPSS Inc., Chi- cago, IL, USA). Descriptive statistics were presented as means and standard deviations. The comparison of continuous vari- ables was done using the Wilcoxon rank–sum test or one-way analysis of variance. A p-value less than 0.05 was considered as statistically significant.
Univariate analysis was performed to investigate the corre- lations between MS and other metabolic parameters.
Results
The incidence of MS
The prevalence of MS was 7.7% in 91 male healthy adoles- cents (Table 2).
Prevalence of each component of MS
The most common symptoms of the criteria were HDL-C
< 40 mg/dL (100%), fasting glucose (85.7%), TG ≥ 110 mg/
Table 2. Incidence of MS in the adolescents
Criteria Number %
0 28 30.8
1 37 40.7
2 19 20.9
3 6 6.6
4 1 1.1
MS: metabolic syndrome
Table 3. Incidence of components of MS in obese adolescents
Criteria MS (-) (n = 84) MS (+) (n = 7)
WC ≥ 90 percentile 3 (3.6%) 3 (42.9%)
SBP or DBP ≥ 90 percentile (mm Hg) 7 (8.3%) 3 (42.9%)
HDL-C < 40 mg/dL 32 (38.1%) 7 (100%)
Triglyceride ≥ 110 mg/dL 9 (10.7%) 5 (71.4%)
Fasting glucose ≥ 100 mg/dL 29 (34.5%) 6 (85.7%)
MS: metabolic syndrome, WC: waist circumference, SBP: systolic blood pressure, DBP: diastolic blood pressure, HDL-C: high density lipoprotein-cholesterol
Table 4. Comparison of anthropometric data between two groups
Parameter MS (-) (n = 84) MS (+) (n = 7) p value
Height (cm) 165.1 ± 6.1 167.6 ± 6.1 0.298
Weight (kg) 57.1 ± 9.1 67.5 ± 12.8* 0.006
BMI (kg/m²) 20.9 ± 3.1 23.9 ± 3.6* 0.017
WC (cm) 74.4 ± 8.9 81.7 ± 9.6* 0.038
Fat (%) 17.7 ± 7.3 22.5 ± 7.6 0.101
Fat mass (kg) 10.6 ± 5.6 15.8 ± 7.7 0.026
SBP (mm Hg) 106.4 ± 11.4 120.0 ± 18.9 0.106
DBP (mm Hg) 58.4 ± 6.4 57.7 ± 3.5 0.777
*p value < 0.05. MS: metabolic syndrome, BMI: body mass index, WC: waist circumference, SBP: systolic blood pressure, DBP: diastolic blood pressure
with the non-MS group (1.71 ± 0.52 s-1 vs. 1.17 ± 0.64 s-1, p <
0.05) (Table 7).
Intimal medial thickness and pulse wave velocity cIMT and pulse wave velocity were not significantly different between two groups (Table 8). The compliance and distensibili- ty of the carotid artery were calculated. There was not any sig- nificant difference between two groups. Data is not shown.
Linear correlation between cardiac
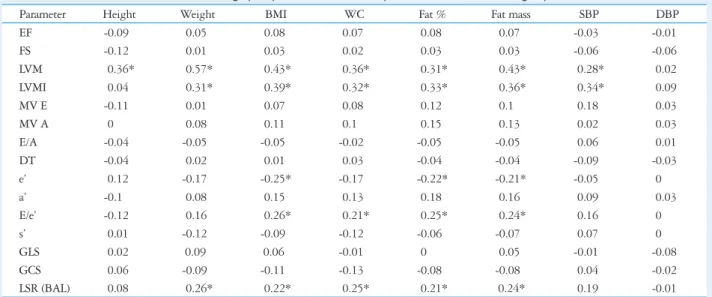
parameters and other anthromometric data LVMI was significantly correlated with BMI (r = 0.39, p <
0.05), fat mass (r = 0.36, p < 0.05), SBP (r = 0.34, p < 0.05), fat % (r = 0.33, p < 0.05), WC (r = 0.32, p < 0.05), and weight (r = 0.31, p < 0.05).
e’ was significantly correlated with BMI (r = -0.25, p < 0.05), 51.5 ± 10.4 g, p < 0.05) (Table 6).
e’ was significantly lower in the MS group compared with the non-MS group (10.1 ± 2.9 cm/sec vs. 11.7 ± 2.1 cm/sec, p
< 0.05). s’ was significantly lower in the MS group compared with the non-MS group (6.6 ± 1.0 cm/sec vs. 7.8 ± 1.2 cm/
sec, p < 0.05). Global longitudinal strain (GLS) was signifi- cantly lower in the MS group compared with the non-MS group (-17.5 ± 2.0% vs. -19.5 ± 2.7%, p < 0.05) (Table 6).
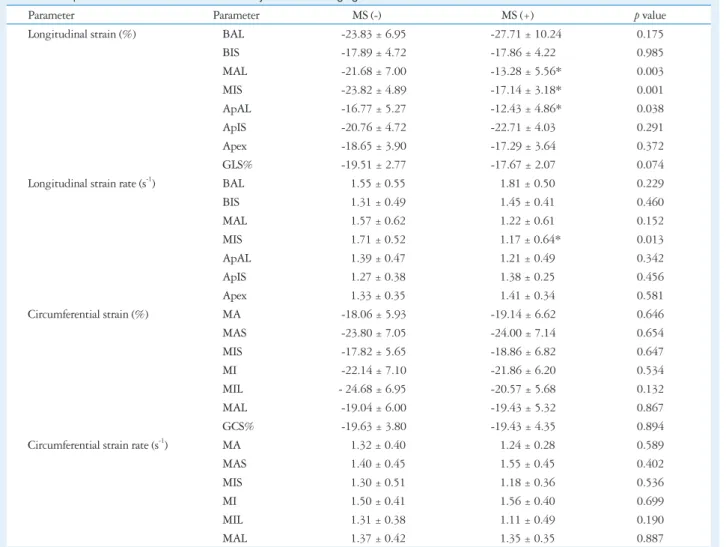
There was a significant reduction in longitudinal strain at the LV medium anterolateral septum (-21.68 ± 7.00% vs.
-13.28 ± 5.56%, p < 0.05), the medium interventricular sep- tum (-23.82 ± 4.89% vs. -17.14 ± 3.18%, p < 0.05) and the apical anterolateral longitudinal septum (-16.77 ± 5.27% vs.
-12.43 ± 4.86%, p < 0.05) (Table 7).
The longitudinal strain rate (LSR) was significantly lower in the medium interventricular septum in the MS group compared
Table 5. Comparison of biochemical parameters in adolescents between two groups
Parameter MS (-) (n = 84) MS (+) (n = 7) p value
Glucose (mg/dL) 97.6 ± 6.4 108.4 ± 4.2* 0.0001
Insulin (mU/L) 9.2 ± 6.8 13.6 ± 4.9* 0.016
HOMA-IR 2.3 ± 1.8 3.6 ± 1.2* 0.007
AST (IU/L) 23.5 ± 6.2 20.3 ± 2.6 0.113
ALT (IU/L) 16.5 ± 9.4 15.4 ± 3.6 0.553
TC (mg/dL) 155.1 ± 31.4 159.6 ± 33.5 0.719
LDL-C (mg/dL) 87.6 ± 25.4 96.6 ± 30.9 0.379
HDL-C (mg/dL) 53.3 ± 10.8 45.0 ± 4.7* 0.021
TG (mg/dL) 70.3 ± 45.4 117.3 ± 46.8* 0.01
hs-CRP (mg/L) 1.0 ± 1.4 0.7 ± 0.9 0.558
*p value < 0.05. MS: metabolic syndrome, HOMA-IR: homeostasis model assessment of insulin resistance, AST: aspartate aminotransferase, ALT: alanine aminotransferase, TC: total cholesterol, LDL-C: low density lipoprotein-cholesterol, HDL-C: high density lipoprotein-cholesterol, TG: triglyceride, hs-CRP:
high sensitive C-reactive protein
Table 6. Comparison of conventional echocardiographic and tissue Doppler imaging data between two groups
Parameter MS (-) (n = 84) MS (+) (n = 7) p value
EF (%) 68.1 ± 7.1 65.9 ± 5.8 0.428
FS (%) 38.5 ± 5.5 36.7 ± 4.4 0.413
LVM (g) 140.6 ± 30.2 192.0 ± 73.0* 0.004
LVMI (g/m²) 51.5 ± 10.4 67.6 ± 22.3* 0.003
MV E (cm/sec) 101.2 ± 13.3 91.2 ± 13.2 0.059
MV A (cm/sec) 46.7 ± 9.5 47.3 ± 12.6 0.886
MV E/A 2.3 ± 0.5 2.0 ± 0.5 0.325
MV E-DT (ms) 130.8 ± 28.6 153.3 ± 29.9 0.05
e’ (cm/sec) 11.7 ± 2.1 10.1 ± 2.9* 0.033
a’ (cm/sec) 6.8 ± 1.6 6.7 ± 1.9 0.811
e’/a’ 8.8 ± 1.8 9.1 ± 2.0 0.693
s’ (cm/sec) 7.8 ± 1.2 6.6 ± 1.0* 0.014
GLS (%) -19.5 ± 2.7 -17.5 ± 2.0* 0.048
GCS (%) -19.6 ± 3.8 -19.4 ± 4.3 0.894
LSR (BAL) (s-1) 1.5 ± 0.5 1.8 ± 0.5 0.23
*p value < 0.05. MS: metabolic syndrome, EF: ejection fraction, FS: fraction shortening, LVM: left ventricle mass, LVMI: left ventricle mass index, MV E: early diastolic velocity, MV A: late atrial peak velocity, DT: deceleration time, e’: peak early diastolic myocardial velocity, a’: peak late diastolic myocardial velocity, s’:
systolic myocardial velocity, GLS: global longitudinal strain, GCS: global circumferential strain, LSR (BAL): longitudinal strain rate (basal anterolateral)
0.05), TC (r = 0.24, p < 0.05), and LDL-C (r = 0.20, p <
0.05). e’ was significantly correlated with HDL-C (r = 0.22, p
< 0.05).
s’ was significantly correlated with LDL-C (r = 0.23, p <
0.05). GLS was significantly correlated with insulin (r = 0.23, p
< 0.05), HOMA-IR (r = 0.22, p < 0.05), and TG (r = 0.2, p <
0.05).
Global circumferential strain (GCS) was significantly corre- lated with glucose (r = 0.22, p < 0.05) and TC (r = 0.21, p <
fat % (r = -0.22, p < 0.05), and fat mass (r = -0.21, p < 0.05).
Basal anterolateral LSR was significantly correlated with WC (r = 0.25, p < 0.05), fat mass (r = 0.24, p < 0.05), BMI (r = 0.22, p < 0.05), fat % (r = 0.21, p < 0.05), and weight (r = 0.26, p < 0.05) (Table 9).
Linear correlation between cardiac parameters and blood chemistry data
LVMI was significantly correlated with ALT (r = 0.34, p <
Table 7. Comparison of strain and strain rate data by strain rate imaging
Parameter Parameter MS (-) MS (+) p value
Longitudinal strain (%) BAL -23.83 ± 6.95 -27.71 ± 10.24 0.175
BIS -17.89 ± 4.72 -17.86 ± 4.22 0.985
MAL -21.68 ± 7.00 -13.28 ± 5.56* 0.003
MIS -23.82 ± 4.89 -17.14 ± 3.18* 0.001
ApAL -16.77 ± 5.27 -12.43 ± 4.86* 0.038
ApIS -20.76 ± 4.72 -22.71 ± 4.03 0.291
Apex -18.65 ± 3.90 -17.29 ± 3.64 0.372
GLS% -19.51 ± 2.77 -17.67 ± 2.07 0.074
Longitudinal strain rate (s-1) BAL 1.55 ± 0.55 1.81 ± 0.50 0.229
BIS 1.31 ± 0.49 1.45 ± 0.41 0.460
MAL 1.57 ± 0.62 1.22 ± 0.61 0.152
MIS 1.71 ± 0.52 1.17 ± 0.64* 0.013
ApAL 1.39 ± 0.47 1.21 ± 0.49 0.342
ApIS 1.27 ± 0.38 1.38 ± 0.25 0.456
Apex 1.33 ± 0.35 1.41 ± 0.34 0.581
Circumferential strain (%) MA -18.06 ± 5.93 -19.14 ± 6.62 0.646
MAS -23.80 ± 7.05 -24.00 ± 7.14 0.654
MIS -17.82 ± 5.65 -18.86 ± 6.82 0.647
MI -22.14 ± 7.10 -21.86 ± 6.20 0.534
MIL - 24.68 ± 6.95 -20.57 ± 5.68 0.132
MAL -19.04 ± 6.00 -19.43 ± 5.32 0.867
GCS% -19.63 ± 3.80 -19.43 ± 4.35 0.894
Circumferential strain rate (s-1) MA 1.32 ± 0.40 1.24 ± 0.28 0.589
MAS 1.40 ± 0.45 1.55 ± 0.45 0.402
MIS 1.30 ± 0.51 1.18 ± 0.36 0.536
MI 1.50 ± 0.41 1.56 ± 0.40 0.699
MIL 1.31 ± 0.38 1.11 ± 0.49 0.190
MAL 1.37 ± 0.42 1.35 ± 0.35 0.887
*p < 0.05. MS: metabolic syndrome, BAL: basal anterolateral, BIS: basal interventricular septum, MAL: medium anterolateral, MIS: medium interventricular septum, ApAL: apical anterolateral longitudinal, ApIS: apical interventricular septum, GLS: global longitudinal strain, MA: medium anterial, MAS: medium anterial septum, MI: medium interventricular, MIL: medium interventricular longitudinal, GCS: global circumstantial strain
Table 8. Intimal medial thickness and pulse wave velocity in adolescents between two groups
Parameter MS (-) (n = 84) MS (+) (n = 7) p value
Rt. IMT (mm) 0.4 ± 0.04 0.5 ± 0.1 0.291
Lt. IMT (mm) 0.4 ± 0.04 0.5 ± 0.03 0.268
RbaPWV (cm/sec) 869.1 ± 114.6 874.6 ± 81.4 0.90
LbaPWV (cm/sec) 881.1 ± 116.9 924.9 ± 110.8 0.342
p > 0.05. MS: metabolic syndrome, Rt.: right, IMT: intimal medial thickness, Lt.: left, RbaPWV: right brachial ankle pulse wave velocity, LbaPWV: left brachial ankle pulse wave velocity
systolic and diastolic dysfunction by TDI and SRI. LVM and LVMI were significantly higher in the MS group compared with the non-MS group. e’, s’ velocity and GLS were signifi- cantly lower in the MS group compared with the non-MS group. There was a significant reduction in strain at the LV medium anterolateral septum, the medium interventricular septum and the apical anterolateral longitudinal septum. The LSR was significantly lower in the medium interventricular septum in the MS group compared with the non-MS group.
0.05) (Table 10).
Linear correlation between insulin resistance and other parameters
HOMA-IR was significantly correlated with GLS (r = 0.22, p < 0.05) (Table 10).
Discussion
In our study, adolescents with MS showed subclinical LV
Table 9. Linear correlation between echocardiographic parameters and anthropometric data between two groups
Parameter Height Weight BMI WC Fat % Fat mass SBP DBP
EF -0.09 0.05 0.08 0.07 0.08 0.07 -0.03 -0.01
FS -0.12 0.01 0.03 0.02 0.03 0.03 -0.06 -0.06
LVM 0.36* 0.57* 0.43* 0.36* 0.31* 0.43* 0.28* 0.02
LVMI 0.04 0.31* 0.39* 0.32* 0.33* 0.36* 0.34* 0.09
MV E -0.11 0.01 0.07 0.08 0.12 0.1 0.18 0.03
MV A 0 0.08 0.11 0.1 0.15 0.13 0.02 0.03
E/A -0.04 -0.05 -0.05 -0.02 -0.05 -0.05 0.06 0.01
DT -0.04 0.02 0.01 0.03 -0.04 -0.04 -0.09 -0.03
e’ 0.12 -0.17 -0.25* -0.17 -0.22* -0.21* -0.05 0
a’ -0.1 0.08 0.15 0.13 0.18 0.16 0.09 0.03
E/e’ -0.12 0.16 0.26* 0.21* 0.25* 0.24* 0.16 0
s’ 0.01 -0.12 -0.09 -0.12 -0.06 -0.07 0.07 0
GLS 0.02 0.09 0.06 -0.01 0 0.05 -0.01 -0.08
GCS 0.06 -0.09 -0.11 -0.13 -0.08 -0.08 0.04 -0.02
LSR (BAL) 0.08 0.26* 0.22* 0.25* 0.21* 0.24* 0.19 -0.01
*p value < 0.05. BMI: body mass index, WC: waist circumference, SBP: systolic blood pressure, DBP: diastolic blood pressure, EF: ejection fraction, FS:
fraction shortening, LVM: left ventricle mass, LVMI: left ventricle mass index, MV E: early diastolic velocity, MV A: late atrial peak velocity, DT: deceleration time, e’: peak early diastolic myocardial velocity, a’: peak late diastolic myocardial velocity, s’: systolic velocity, GLS: global longitudinal strain, GCS: global circumferential strain, LSR (BAL): longitudinal strain rate (basal anterolateral)
Table 10. Linear correlation between echocardiographic parameters and biochemical data between two groups
Parameter Glucose Insulin HOMA-IR AST ALT TC LDL-C HDL-C TG
EF -0.06 0.04 0.04 0.07 0.04 0.08 0.04 0.08 -0.09
FS 0.02 0.11 0.11 0.06 0 0.06 0.01 0.1 -0.09
LVM 0.23* 0.13 0.15 0.12 0.28* 0.09 0.1 0.01 0.01
LVMI 0.17 0.13 0.15 0.14 0.34* 0.24* 0.2* 0 0.12
MV E -0.18 -0.11 -0.13 0.18 0.23* 0.13 0.19 0.03 0.01
MV A 0.03 -0.02 -0.01 0.2* 0.09 -0.03 -0.05 -0.01 0.05
E/A -0.15 -0.08 -0.1 0.08 0.06 0.09 0.15 0 0.03
DT 0.08 0.01 0.01 0 -0.08 -0.09 -0.02 0.24* 0.01
e’ -0.12 -0.19 -0.18 0.03 -0.02 -0.02 -0.11 0.22* -0.15
a’ -0.09 -0.01 -0.03 -0.01 0.06 0.09 0.14 -0.11 0.14
E/e’ -0.05 0.04 0.02 0.17 0.18 0.11 0.2* -0.18 0.1
s’ -0.03 -0.17 -0.17 0.09 -0.04 -0.14 0.23* 0.15 -0.12
GLS 0.14 0.23* 0.22* 0.1 -0.06 0.09 0.13 -0.11 0.2*
GCS 0.22* -0.07 -0.05 -0.07 -0.13 0.21* 0.14 0.09 0.02
LSR (BAL) 0.06 0.01 0.01 -0.13 0.1 0.11 0.12 -0.04 0.05
*p value < 0.05. HOMA-IR: homeostasis model assessment of insulin resistance, AST: aspartate aminotransferase, ALT: alanine aminotransferase, TC: total cholesterol, LDL-C: low density lipoprotein-cholesterol, HDL-C: high density lipoprotein-cholesterol, TG: triglyceride, EF: ejection fraction, FS: fraction shortening, LVM: left ventricle mass, LVMI: left ventricle mass index, MV E: early diastolic velocity, MV A: late atrial peak velocity, DT: deceleration time, e’: peak early diastolic myocardial velocity, a’: peak late diastolic myocardial velocity, s’: systolic velocity, GLS: global longitudinal strain, GCS: global circumferential strain, LSR (BAL): longitudinal strain rate (basal anterolateral)
volume overload, insulin resistance, autonomic changes and metabolic abnormality have already been studied.
BMI, insulin resistance and duration of obesity are associat- ed with cardiac dysfunction.23)
Increased adiposity is associated with insulin resistance be- cause of the release of free-fatty acid, as well as actions of adi- pokines. Lipotoxicity can also contribute to cardiac myocyte apoptosis.19) Other possible mediators include the hormonal and cytokine release associated with obesity. Adiponectin is reduced in obesity, and this may induce insulin resistance.24)
Our results suggest that obesity contributes to the myocar- dial changes. Interestingly, we found that HOMA-IR was sig- nificantly positively correlated with GLS (r = 0.22). Hyperin- sulinemia and insulin resistance have been known to cause an altered collagen/muscular ratio.25) Studies have demonstrated an accumulation of myocardial collagen is related to intersti- tial and perivascular fibrosis, both of which is associated with LV early diastolic dysfunction.26)
In our study, LV hypertrophy, which was assessed by the LVMI was significantly different between patients with MS and those in control adolescents. LVMI was significantly cor- related with BMI (r = 0.39), fat mass (r = 0.36), SBP (r = 0.34), fat % (r = 0.33), and WC (r = 0.32). LVMI was signifi- cantly correlated with ALT (r = 0.34), TC (r = 0.24), and LDL-C (r = 0.20).
Both eccentric and concentric hypertrophy have been noted in adults with obesity and are impacted by the degree and du- ration of the obesity.27) Altered cardiac morphology may be a precursor to impaired cardiac function. Studies on children and adolescents with obesity have reported changes in cardiac mechanics including diastolic dysfunction28) and systolic dys- function at rest29)30) and during exercise.31)
Currently, it is uncertain how cardiac dysfunction will prog- ress over time, and how cardiac dysfunction correlates to out- comes in adulthood. In adults, even with cardiac enlargement and systolic dysfunction, several studies have revealed that LVEF is normal in many obese subjects.32) Although the EF is normal, myocardial contractile abnormalities may still exist, and are more susceptible to measures by TDI and SRI analyses.33)
TDI is used to estimate LV filling pressures in obese sub- jects. The ratio of early diastolic filling to mitral annular tissue velocity (E/E1) is a well-established index of pulmonary capil- lary wedge pressure strain.34)
In our study, we performed the measurements to keep the angle between the ultrasound beam and the LV longitudinal axis as small as possible to eliminate errors and the data were averaged using a compound function to decrease noise by 2D speckle tracking imaging.
The traditional method of deriving regional systolic strain and strain rate from TDI is, however, limited by angle depen- dency.
We found that regional strain and strain rate reduction in the MS group with normal LVEF. The use of TDI and SRI analysis Utility of TDI and SRI have not been determined in pedi-
atric patients with MS.
Previous adult studies have investigated the LV functions in patients with MS, but there is not any consensus.16-19) Grandi et al.17) have described that only LV diastolic function is re- duced in MS, although LV systolic function is normal. Masug- ata et al.18) also have reported that cardiac diastolic function was impaired in patients with MS even if they have neither LV hypertrophy nor systolic dysfunction. On the other hand, Wong et al.19) have found that MS is correlated with both LV systolic and diastolic dysfunction in subjects with significant risk factors but not with CVD. Those studies have provided valuable information about LV function in MS.
However, there are some limitations to compare our data with those studies, because our study was performed in ado- lescents, the other studies were done on adult age patients.
Diagnostic methods used to assess cardiac function are dif- ferent between several studies. Gong et al.16) found that re- gional LV systolic and diastolic function were impaired in pa- tients with MS by using strain and SRI.
The impairment was more serious in patients with four risk factors than in patients with three risk factors. This suggests that different components of MS may have synergistic effects on LV functions.
In our study, ventricular systolic and diastolic function were significantly lower in the MS group with more than 3 risk fac- tors compared with non-MS group with less than 3 risk factors.
These results were in accordance with the previous studies in adult groups.16)
Although the cause of altered LV function in MS is not fully understood, the components of MS may produce latent cardi- ac structural and functional disorders. MS is also related to LV hypertrophy and LV diastolic dysfunction.20)
In our studies, e’ velocity showed significant negative corre- lation with BMI, fat %, fat mass. e’ was significantly correlat- ed with HDL-C.
GLS was significantly correlated with insulin, HOMA-IR and TG. GCS was significantly correlated with glucose and TC. Basal anterolateral LSR was significantly correlated with weight, WC, fat mass, BMI, and fat %. LVM was significant- ly correlated with ALT and glucose.
Obesity is associated with increased metabolic demand be- cause of greater adipose tissue, larger blood overload and in- creased preload to the heart. Also, vascular alterations of arte- rial stiffness and resistance increase afterload to the heart.
Obesity can cause cardiac hypertrophy in systolic and diastolic cardiac dysfunction.21)
Obesity affects myocardial metabolism. Alterations in myo- cardial substrate metabolism have been related with reduced myocardial contractile dysfunction in insulin resistant patients and diabetes mellitus.19) LV abnormalities seem to be greater in visceral rather than in subcutaneous obesity.22) The cause of this myocardial dysfunction remains unclear, although chronic
erosclerosis, Hypertension, and Obesity in the Young Committee of the Council on Cardiovascular Disease in the Young; Council on Cardiovascular Nursing; and Council on Nutrition, Physical Activ- ity, and Metabolism. Progress and challenges in metabolic syndrome in children and adolescents: a scientific statement from the American Heart As- sociation Atherosclerosis, Hypertension, and Obesity in the Young Committee of the Council on Cardiovascular Disease in the Young; Council on Cardio- vascular Nursing; and Council on Nutrition, Physical Activity, and Me- tabolism. Circulation 2009;119:628-47.
4. Ford ES, Li C. Defining the metabolic syndrome in children and adoles- cents: will the real definition please stand up? J Pediatr 2008;152:160-4.
5. Zimmet P, Alberti KG, Kaufman F, Tajima N, Silink M, Arslanian S, Wong G, Bennett P, Shaw J, Caprio S; IDF Consensus Group.
The metabolic syndrome in children and adolescents - an IDF consensus re- port. Pediatr Diabetes 2007;8:299-306.
6. Chen W, Srinivasan SR, Elkasabany A, Berenson GS. Cardiovascular risk factors clustering features of insulin resistance syndrome (Syndrome X) in a biracial (Black-White) population of children, adolescents, and young adults: the Bogalusa Heart Study. Am J Epidemiol 1999;150:667-74.
7. Kibar AE, Pac FA, Ballı S, Oflaz MB, Ece I, Bas VN, Aycan Z. Ear- ly subclinical left-ventricular dysfunction in obese nonhypertensive children:
a tissue Doppler imaging study. Pediatr Cardiol 2013;34:1482-90.
8. Shah N, Chintala K, Aggarwal S. Electrocardiographic strain pattern in children with left ventricular hypertrophy: a marker of ventricular dysfunc- tion. Pediatr Cardiol 2010;31:800-6.
9. Lorch SM, Sharkey A. Myocardial velocity, strain, and strain rate abnor- malities in healthy obese children. J Cardiometab Syndr 2007;2:30-4.
10. Movahed MR, Saito Y. Obesity is associated with left atrial enlargement, E/A reversal and left ventricular hypertrophy. Exp Clin Cardiol 2008;13:
89-91.
11. Swaminathan S, Ferrer PL, Wolff GS, Gómez-MarÍn O, Rusconi PG. Usefulness of tissue Doppler echocardiography for evaluating ventricu- lar function in children without heart disease. Am J Cardiol 2003;91:
570-4.
12. Willens HJ, Chakko SC, Lowery MH, Byers P, Labrador E, Galla- gher A, Castrillon JC, Myerburg RJ. Tissue Doppler imaging of the right and left ventricle in severe obesity (body mass index >35 kg/m2). Am J Cardiol 2004;94:1087-90.
13. Voigt JU, Arnold MF, Karlsson M, Hübbert L, Kukulski T, Hatle L, Sutherland GR. Assessment of regional longitudinal myocardial strain rate derived from Doppler myocardial imaging indexes in normal and in- farcted myocardium. J Am Soc Echocardiogr 2000;13:588-98.
14. Voigt JU, Lindenmeier G, Exner B, Regenfus M, Werner D, Reul- bach U, Nixdorff U, Flachskampf FA, Daniel WG. Incidence and characteristics of segmental postsystolic longitudinal shortening in normal, acutely ischemic, and scarred myocardium. J Am Soc Echocardiogr 2003;16:415-23.
15. Yuda S, Short L, Leano R, Marwick TH. Myocardial abnormalities in hypertensive patients with normal and abnormal left ventricular filling: a study of ultrasound tissue characterization and strain. Clin Sci (Lond) 2002;103:283-93.
16. Gong HP, Tan HW, Fang NN, Song T, Li SH, Zhong M, Zhang W, Zhang Y. Impaired left ventricular systolic and diastolic function in pa- tients with metabolic syndrome as assessed by strain and strain rate imaging.
Diabetes Res Clin Pract 2009;83:300-7.
17. Grandi AM, Maresca AM, Giudici E, Laurita E, Marchesi C, Sol- biati F, Nicolini E, Guasti L, Venco A. Metabolic syndrome and mor- phofunctional characteristics of the left ventricle in clinically hypertensive nondiabetic subjects. Am J Hypertens 2006;19:199-205.
18. Masugata H, Senda S, Goda F, Yoshihara Y, Yoshikawa K, Fujita N, Daikuhara H, Nakamura H, Taoka T, Kohno M. Left ventricular dia- stolic dysfunction as assessed by echocardiography in metabolic syndrome.
could detect pre-clinical changes in LV regional systolic and dia- stolic dysfunction before conventional changes in EF.35)
Previous studies of MS in children and adolescents, gave ev- idence on the clustering of risk factors for CVD.36) Although there hasn’t been any research that has shown the impact of MS on heart disease in childhood, some autopsy studies in childhood have shown that the factors of obesity, high blood pressure, high TG, and low HDL-C are related to the early stage of coronary atherosclerosis.19)22) Early identification of the clustering of risk factors in childhood is important in target- ing efforts for chronic disease prevention.
There are several limitations to this study. This study only analyzed male subjects. There is also a lack of comprehensive assessment according to diverse growth and development be- cause the age was confined to ages between 14 and 15 years old. Another limitation of this study includes the accuracy and reproducibility of measuring the parameters using echo- cardiography.
Further research on a larger adolescent population is needed, because there is no standard cut-points for parameters of MS.
The longitudinal model design from adolescence to adulthood is needed to explore the complexity of MS risk factors. Since the time course of an adolescent to obesity and clinical disease is short, there is a lack of difference between the MS group and the non-MS group. The prospective and longitudinal studies may offer good opportunities in pediatric cardiovascu- lar research.
In conclusion, in the present study, we have shown the pres- ence of impaired global left ventricular function in patients with MS compared with control subjects without MS even if they have normal LVEF. This finding emphasizes the impor- tance of early diagnosis and management of MS to prevent the progression of ventricular dysfunction to overt structural and symptomatic cardiac disease.
Early identification of regional and global LV functions by TDI and SRI in MS risk group may help to stratify risk and guide therapy. Because the components of the MS tended to be highly correlated with each other, it would be difficult to detect completely separate effects of each component. Strain and SRI would be a sensitive and feasible method to detect subclinical abnormalities in those populations.
• Acknowledgements
This study was supported by a grant of the Korean Society of Echocardiog- raphy (2012).
References
1. Cruz ML, Goran MI. The metabolic syndrome in children and adolescents.
Curr Diab Rep 2004;4:53-62.
2. Cook S, Weitzman M, Auinger P, Nguyen M, Dietz WH. Prevalence of a metabolic syndrome phenotype in adolescents: findings from the third National Health and Nutrition Examination Survey, 1988-1994. Arch Pediatr Adolesc Med 2003;157:821-7.
3. Steinberger J, Daniels SR, Eckel RH, Hayman L, Lustig RH, Mc- Crindle B, Mietus-Snyder ML; American Heart Association Ath-
29. Mahfouz RA, Dewedar A, Abdelmoneim A, Hossien EM. Aortic and pulmonary artery stiffness and cardiac function in children at risk for obesity. Echocardiography 2012;29:984-90.
30. Ingul CB, Tjonna AE, Stolen TO, Stoylen A, Wisloff U. Impaired cardiac function among obese adolescents: effect of aerobic interval training.
Arch Pediatr Adolesc Med 2010;164:852-9.
31. Schuster I, Karpoff L, Perez-Martin A, Oudot C, Startun A, Rubini M, Obert P, Vinet A. Cardiac function during exercise in obese prepubertal boys: effect of degree of obesity. Obesity (Silver Spring) 2009;17:1878-83.
32. Burchfiel CM, Skelton TN, Andrew ME, Garrison RJ, Arnett DK, Jones DW, Taylor HA Jr. Metabolic syndrome and echocardiographic left ventricular mass in blacks: the Atherosclerosis Risk in Communities (ARIC) Study. Circulation 2005;112:819-27.
33. Iacobellis G, Pellicelli AM, Sharma AM, Grisorio B, Barbarini G, Barbaro G. Relation of subepicardial adipose tissue to carotid intima-media thickness in patients with human immunodeficiency virus. Am J Cardiol 2007;99:1470-2.
34. Ommen SR, Nishimura RA, Appleton CP, Miller FA, Oh JK, Red- field MM, Tajik AJ. Clinical utility of Doppler echocardiography and tis- sue Doppler imaging in the estimation of left ventricular filling pressures: a comparative simultaneous Doppler-catheterization study. Circulation 2000;102:1788-94.
35. Fallah-Rad N, Walker JR, Wassef A, Lytwyn M, Bohonis S, Fang T, Tian G, Kirkpatrick ID, Singal PK, Krahn M, Grenier D, Jassal DS. The utility of cardiac biomarkers, tissue velocity and strain imaging, and cardiac magnetic resonance imaging in predicting early left ventricular dysfunction in patients with human epidermal growth factor receptor II-pos- itive breast cancer treated with adjuvant trastuzumab therapy. J Am Coll Cardiol 2011;57:2263-70.
36. Lago F, Gómez R, Gómez-Reino JJ, Dieguez C, Gualillo O. Adipo- kines as novel modulators of lipid metabolism. Trends Biochem Sci 2009;34:
500-10.
Hypertens Res 2006;29:897-903.
19. Wong CY, O’Moore-Sullivan T, Fang ZY, Haluska B, Leano R, Marwick TH. Myocardial and vascular dysfunction and exercise capacity in the metabolic syndrome. Am J Cardiol 2005;96:1686-91.
20. Bokor S, Frelut ML, Vania A, Hadjiathanasiou CG, Anastasakou M, Malecka-Tendera E, Matusik P, Molnár D. Prevalence of metabolic syn- drome in European obese children. Int J Pediatr Obes 2008;3 Suppl 2:3-8.
21. Cote AT, Harris KC, Panagiotopoulos C, Sandor GG, Devlin AM.
Childhood obesity and cardiovascular dysfunction. J Am Coll Cardiol 2013;62:1309-19.
22. Nakajima T, Fujioka S, Tokunaga K, Matsuzawa Y, Tarui S. Correla- tion of intraabdominal fat accumulation and left ventricular performance in obesity. Am J Cardiol 1989;64:369-73.
23. Alpert MA, Lambert CR, Terry BE, Cohen MV, Mukerji V, Massey CV, Hashimi MW, Panayiotou H. Influence of left ventricular mass on left ventricular diastolic filling in normotensive morbid obesity. Am Heart J 1995;130:1068-73.
24. Kern PA, Di Gregorio GB, Lu T, Rassouli N, Ranganathan G. Adi- ponectin expression from human adipose tissue: relation to obesity, insulin re- sistance, and tumor necrosis factor-alpha expression. Diabetes 2003;52:
1779-85.
25. Di Bello V, Giampietro O, Pedrinelli R, Matteucci E, Giorgi D, Bertini A, Bianchi M, Ferdeghini M, Boldrini E, Dell’Omo G, Pa- terni M, Giusti C. Can insulin action induce myocardial texture altera- tions in essential hypertension? Am J Hypertens 1999;12:283-90.
26. Mizushige K, Yao L, Noma T, Kiyomoto H, Yu Y, Hosomi N, Ohmori K, Matsuo H. Alteration in left ventricular diastolic filling and accumulation of myocardial collagen at insulin-resistant prediabetic stage of a type II diabetic rat model. Circulation 2000;101:899-907.
27. Vasan RS. Cardiac function and obesity. Heart 2003;89:1127-9.
28. Dhuper S, Abdullah RA, Weichbrod L, Mahdi E, Cohen HW. Asso- ciation of obesity and hypertension with left ventricular geometry and func- tion in children and adolescents. Obesity (Silver Spring) 2011;19:128-33.