Fenofibrate, a peroxisome proliferator-activated receptor α-agonist, blocks lipopolysaccharide-induced inflammatory
pathways in mouse liver
Tae Wan Won
Department of Surgery, School of Medicine, Wonkwang University, Iksan, Korea
Backgrounds/Aims: During the acute phase response, cytokines induce marked alterations in lipid metabolism including an increase in serum triglyceride levels and a decrease in hepatic fatty acid oxidation, in bile acid synthesis, and in high-density lipoprotein levels. Methods: Peroxisome proliferator-activated receptors (PPARs: PPARα, β/δ, and γ) regulate fatty acid metabolism, glucose homeostasis, cell proliferation, differentiation and inflammation.
Proinflammatory profiles including tumor necrosis factor α (TNF-α), interleukin-1β (IL-1β), and interleukin-6 (IL-6) are the important pathological factors in inflammatory responses during the pathological progression of the acute phase response. Lipopolysaccarides (LPS) induced the expression of TNF-α, IL-1β, and IL-6. LPS-induced inflammation decrease the expression of peroxisome proliferator-activated receptor α (PPARα), PPARβ/δ, PPARγ, and co- activators PPARγ coactivator 1 α (PGC-1α), PGC-1β messenger RNA (mRNA) in the liver of Balb/c mouse. In addition, LPS-induced inflammation diminishes the protein level of PPARα, PPARβ/δ, and PPARγ. Proinflammatory cytokines including TNFα, IL-1β, and IL-6 are the principal reducer of PPARs. However, the knockout mouse model against TNFα and IL-6 does not block decrease of PPARs in serum and liver. The mice were pretreated with fenofi- brate at 100 mg/kg for 2 days. Results: These treatment protocols increased the amount of PPARs mRNA in the liver. Fenofibrate inhibited LPS-induced TNF-α, IL-1β, and IL-6 production in the serum and liver. Similar results were obtained when human hepatoma HepG2 cells exposed to LPS were co-incubated with fenofibrate. LPS-treated HepG2 cells decreased expression of IκB. Moreover, activation of PPARs abrogated LPS-induced degradation of IκB, thus suppressing LPS-induced NF-κB activities. Conclusions: Therefore, fenofibrate decreases the expression and secretion of TNF-α, IL-1β, and IL-6 via the NF-κB signaling pathway, thus serving as therapeutic targets to attenuate inflammation that is involved in hepatic pathological progression. (Korean J Hepatobiliary Pancreat Surg 2013;17:89-108) Key Word: Peroxisome proliferator activated receptors α agonist
Received: July 1, 2013; Revised: July 25, 2013; Accepted: August 5, 2013 Corresponding author: Tae Wan Won
Department of Surgery, School of Medicine, Wonkwang University, 344-2, Sinyong-dong, Iksan 570-711, Korea Tel: +82-63-859-1490, Fax: +82-63-855-2389, E-mail: [email protected]
Copyright Ⓒ 2013 by The Korean Association of Hepato-Biliary-Pancreatic Surgery Korean Journal of Hepato-Biliary-Pancreatic Surgery ∙ ISSN: 1738-6349
INTRODUCTION
The acute phase response (APR) is a generalized re- sponse of the organism to multiple disturbances of its phys- iological homeostasis. Inflammatory processes are the main causes for the initiation of these defense mechanisms.1 As part of systemic inflammatory reactions, interleukin 6 (IL-6) regulates APR genes in liver cells including C-reactive pro- tein (CRP), fibrinogen, serum amyloid A (SAA), α2-mac- roglobulin, and albumin.2 Elevated levels of IL-6 and liver APR genes that are a reflection of the inflammatory state have been reported in patients with acute coronary syndrome.3 IL-6 actions are mediated by a specific cell sur- face IL-6 receptor (IL-6R), an 80-kDa glycoprotein (gp80),
and a signal transducing molecule, glycoprotein gp130, which is also the signaling molecule for various IL-6 family cytokines.4 IL-6 binds to its cognate receptor, and IL-6/IL-6R forms a complex with a gp130 homodimer.
Ligand-induced oligomerization of receptor subunits leads to activation and phosphorylation of a signal transducer and activator of transcription 3 (STAT3) and of linker proteins, which propagate the signal to other pathways and cause ac- tivation of immediate early response genes, such as c-jun.5 STAT3 and c-Jun cooperatively activate APR gene tran- scription6 and act in concert with various isoforms of the transcription factor CAAT enhancer-binding protein (C/EBP) to up-regulate APR protein expression.7
PPARs are ligand-activated transcription factors that
belong to the superfamily of nuclear receptors.8 PPARs are activated by natural ligands such as fatty acids, eicosa- noids, and oxidized fatty acids.9 Of the 3 PPAR family members, PPAR-α, PPAR-β/δ, and PPAR-γ, PPAR- α is the target of the lipid-lowering fibrates.9 PPARs reg- ulate gene expression by forming heterodimers with the retinoid X receptor (RXR) and binding to specific DNA sequences located in the promoter region of target genes, termed PPAR response elements (PPRE transactivation).
PPREs consist of a direct repeat (DR) of a hexameric AGGTCA recognition site separated by 1 (DR-1) or 2 nu- cleotides (DR-2).10 A physiological role for PPAR-α is to control FA oxidation in response to fasting by inducing ketone body formation11 and high-fat-feeding.12 PPAR-α also plays a major role in lipid homeostasis by controlling key genes encoding enzymes and apolipoproteins involved in lipoprotein metabolism.13 Furthermore, PPAR-α dis- plays antiinflammatory activities and controls the in- flammatory response in the vascular wall.14 The control of inflammatory pathways by PPARα occurs mainly via repression of target genes caused by negative interference in a DNA-binding-independent manner (transrepres- sion).14 It is well-established that serum concentrations of hepatic inflammatory response genes (eg, fibrinogen, CRP, SAA) are elevated in patients with coronary artery disease (CAD), and several of the genes, including fibri- nogen and CRP, are considered as risk markers.14
PPARα seems to decrease inflammation, mainly through direct interaction with NFκB, causing inhibition of its signaling pathway or reducing the activated levels of NFκB and subsequent inflammation. In fact, PPARα was reported to protect the liver from obesity-induced in- flammation after feeding with a high-fat diet (HFD) for 6 months.15 Furthermore, PPARα was implicated in the attenuation of oxidative stress in alcoholic liver disease when treated with polyenephosphatidylcholine through downregulation of ROS generating enzymes such as etha- nol-inducible cytochrome P450 2E1 (CYP2E1), acyl-CoA oxidase, and NADPH oxidase.
PPARγ, a nuclear transcription factor, regulates lipid metabolism and the inflammation response, and maintains the quiescent phenotype of hepatic stellate cells.16,17 PPARγ knockout causes hepatic insulin resistance and increases the plasma free fatty acids level.16 Dysfunction of PPARγ is related to the inflammatory and pro-fibrogenic actions in the
liver, 17 inferring that PPARγ may play a major role in the pathogenesis of non-alcoholic steatohepatitis.
Recent evidence suggests that PPARs may attenuate in- flammatory signaling pathways and, as such, the acute phase response in the liver and interfere with cardiac remodeling. This function is largely mediated through the ability of agonist-activated PPARs to form complexes with other transcription factors, such as NF-κB and STATs (signal transducers and activators of transcription), thereby resulting in the functional cross-inhibition of their transcriptional activity.18 Treatment with L-165041 in- hibits phenylephrine- and lipopolysaccharide-induced NF- κB activation in cultured neonatal rat cardiomyocytes and embryonic rat heart-derived H9c2 cells.19 The anti- hypertrophic effects of this PPARβ/δ agonist involve down-regulation of the NF-κB signaling pathway through enhanced physical interaction between the p65 subunit of NF-κB and PPARβ/δ.20
PPARs are activated by natural ligands such as poly- unsaturated fatty acids and by synthetic ligands (drugs be- longing to the fibrate family). Recent observations in- dicate that PPARα activators could reduce the in- flammation by decreasing cytokines, adhesion molecules, and NOS2. In addition, PPARα activators reduce oxida- tive stress by increasing antioxidant enzymes such as Cu/Zn2+ superoxide dismutase and glutathione peroxi- dase. Indeed, PPARα activation exhibits anti-inflamma- tory and antioxidant properties in vitro and in different experimental models, including carrageenan-induced paw edema, experimental colitis, and liver cirrhosis. In addi- tion, PPARα agonists have been recently demonstrated to be protective in both neuronal cell culture21 and in vivo cerebral ischemia models.
Fibrates are hypolipidemic drugs that efficiently nor- malize hypertriglyceridemia and hypercholesterolemia. In addition, fibrates may also lower fibrinogen and CRP plasma levels and affect other plasma APR proteins.22 Fibrates exert their action via activation of the nuclear re- ceptor PPARα. PPARα regulates transcription of target genes via binding of PPARα with its heterodimeric part- ner retinoid X receptor to specific response elements. This pathway is mainly involved in the regulation of genes that play a role in lipid and lipoprotein metabolism and may, in large part, explain the normolipidemic action of fibrates.13 Furthermore, PPARα has been demonstrated to
act as a negative regulator of genes involved in the in- flammatory response by antagonizing the activity of tran- scription factors, such as NF-κB and AP-1, partly by di- rect interaction with proteins such as p65 and c-Jun. In line with these findings, impaired expression of PPARα has been found to sustain the inflammatory response.
In the present study, I hypothesized that LPS-induced inflammatory cytokines, TNF-α, IL-1β, or IL-6, exert their effects directly on the hepatocytes and suppress the messenger RNA of PPARs and co-regulators contributing to the alterations in lipid metabolism that occur during the APR. In addition, fenofibrate, a PPARα agonist, reduces secretion of proinflammatory cytokines from serum and protein or mRNA in liver.
METHODS
Chemicals and supplies
The lipopolysaccharide (LPS) (Escherichia coli 055:B5 clone), fenofibrate, was purchased from Sigma (St. Louis, Mo, USA). Plastic culture wares were purchased from Falcon, Inc. (Becton Dickinson Biotech, Lincoln, IL).
Dulbecco’s modified essential medium (DMEM), TRIzol, and fetal bovine serum (FBS) were obtained from Invitrogen (Invitrogen, Carlsbad, CA). Antibodies, includ- ing anti-HO-1, anti-tumor necrosis factor α (anti-TNF-α), anti-peroxisome proliferator activated receptors (anti- PPARs: PPARα, β/δ, and γ), anti-janus kinase 1 (JAK1), anti-phosphorylated-JAK1, anti-STAT3, anti-pho- sphorylated-STAT3, anti-catalase, anti-PGC-1, anti-TLR4, and anti-beta-actin were purchased from Santa Cruz Biotechnology (Santa Cruz, CA). Mouse anti-phospho-Iκ Bα and rabbit anti-IκBβ Abs were purchased from Cell Signaling Technology (Beverly, MA). ECL solution was obtained from Thermo Scientific (Pierce Chemical, Rockland, IL). Mouse TNF-α, IL-1β, and IL-6 immuno- assay kits were purchased from R & D Systems (Minneapolis, MN, Canada). For immunohistochemistry, LSAB+System-HRP kit was obtained from DAKO (Carpinteria, CA, USA). For cDNA synthesis, Transcriptor First Strand cDNA Synthesis Kit was pur- chased from Roche (Indianapolis, IN, USA).
Culture and treatment of HepG2 cells
Hepatoma (HepG2) cells were purchased from
American Type Culture Collection (Mannassas, VA, USA), and maintained in the DMEM containing 10%
FBS, penicillin/streptomycin, and 1 x nonessential amino acids. HepG2 cells were seeded at the density 3×10⁶ cells/dish (6-cm plate for protein level and mRNA level).
Prior to each experiment, the HepG2 cells were rinsed two times with 1 ml warm (37oC) phosphate-buffered saline (PBS) and the medium was replaced with fresh serum-free DMEM plus 0.1% bovine serum albumin. The cells were then treated with 5 μg/ml LPS for 20 h. For some experi- ments, fenofibrate was added as a pretreatment 30 minutes before LPS stimulation.
Measurement of proinflammatory cytokines To quantify the secretion of proinflammatory cytokines from LPS-treated Balb/c, TNF-α knockout, and IL-6 knockout mice, whole blood was isolated from the mice before sacrifice, incubated at 4oC for 16 h, and centri- fuged at 4,000 rpm for 20 min. Thereafter, the level of proinflammatory cytokines was determined by ELISA ac- cording to the manufacturer’s instructions.
Assay for messenger RNA expression by reverse transcriptase-polymerase chain reaction (RT-PCR)
After extracting total RNA from the liver using TRIzol, the complementary DNA (cDNA) was synthe- sized using reverse transcriptase. RNA (2 μg) and oli- godT were preincubated at 70oC for 5 minutes, then quick-chilled on ice. cDNA synthesis was performed at 42oC for 60 minutes, and followed by reverse tran- scriptase inactivation at 94oC for 5 minutes. PCR was then performed with Taq polymerase (SolGent Co., Daejeon, Korea) for 35 to 40 cycles using the following protocol:
94oC for 30 s, 55oC to 61oC for 30 s, 72oC for 30 s.
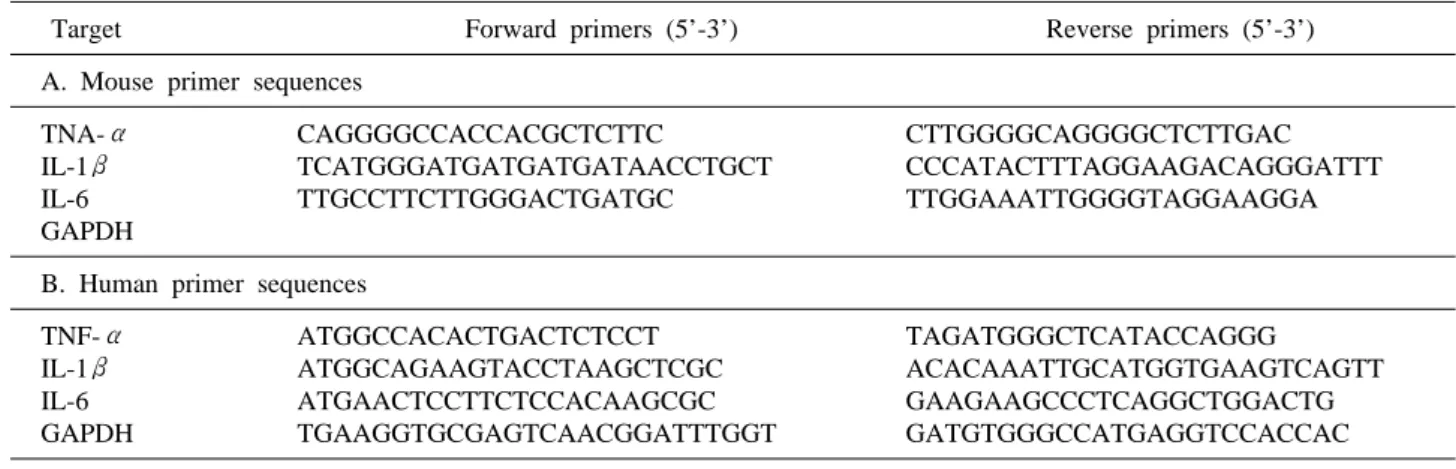
Primers are listed in Table 1.
Measurement of hepatic messenger RNA levels by quantitative real-time polymerase chain reaction (QRT-PCR)
RNA was extracted using TRIzol and cDNA was syn- thesized using Superscript III. Semiquantitative real-time PCR analysis using Fast SYBR Green Master Mix (AB) was performed using a Step One Plus (AB). Primers are listed in Table 2.
Table 1. Primer pairs used for reverse transcriptase PCR
Target Forward primers (5’-3’) Reverse primers (5’-3’)
A. Mouse primer sequences TNA-α
IL-1β IL-6 GAPDH
CAGGGGCCACCACGCTCTTC
TCATGGGATGATGATGATAACCTGCT TTGCCTTCTTGGGACTGATGC
CTTGGGGCAGGGGCTCTTGAC CCCATACTTTAGGAAGACAGGGATTT TTGGAAATTGGGGTAGGAAGGA
B. Human primer sequences TNF-α
IL-1β IL-6 GAPDH
ATGGCCACACTGACTCTCCT ATGGCAGAAGTACCTAAGCTCGC ATGAACTCCTTCTCCACAAGCGC TGAAGGTGCGAGTCAACGGATTTGGT
TAGATGGGCTCATACCAGGG
ACACAAATTGCATGGTGAAGTCAGTT GAAGAAGCCCTCAGGCTGGACTG GATGTGGGCCATGAGGTCCACCAC
Table 2. Primer pairs used for semi quantitative real-time PCR
Target Forward primers (5’-3’) Reverse primers (5’-3’) Genbank accession no.
ICAM-1 VCAM-1 SREBP-1a SREBP-1c SREBT-2 PGC-1β PGC-1α PPARα PPARβ/δ PPARγ GAPDH
TCGGGAAGGGAGCCAAGTAACT GATCCTCCGAGCTGGCATT GGCCGAGATGTGCGAAC AGCTGTCGGGGTAGCGTCTG GCGTTCTGGAGACCATGGA CAAGCTCTGACGCTCTGAAGG CCGCCACCTTCAATCCAGAG GGCTTCTTTCGGCGAACTATT TCCATCGTCAACAAAGACGGG GGAAGACCACTCGCATTCCTT AGGTCGGTGTGAACGGATTTG
GATCCTCCGAGCTGGCATT CCTCGCTGGAACAGGTCATT GTTGATGAGCTGGAGCATGT GAGAGTTGGCACCTGGGCTG ACAAAGTTGCTCTGAAAACAAATCA TTGGGAGCAGGCTTTCAC
CAAGTTCTCGATTTCTCGACGG CCGATCACACTTGTCGTACAC ACTTGGGCTCAATGATGTCAC GTAATCAGCAACCATTGGGTCA TGTAGACCATGTAGTTGAGGTCA
BC016198 BC029823 NM_011480 NM_011480 AF374267 NM_133249 NM_015729 NM_011144 NM_011145 NM_001127330 NM_008084
Fig. 1. Schematic representation of in vivo experiment.
Study animals
Eight-week-old male Balb/c mice weighing 22 to 23 g were purchased from ORIENT (Korea). Balb/c, TNF-α knockout, and IL-6 knockout mice were maintained in a room with a normal light cycle and were provided with rodent chow and water in SPF conditions. Mice were in- jected intraperitoneally with 100 μg of LPS per 20 g mouse in 700 μl saline or with saline alone. Food was withdrawn at the time of injection because LPS and cyto- kines induce anorexia in rodents. The livers were removed after treatment at the time indicated in the text. The doses of LPS were not lethal, as the LD50 for LPS in rodents is approximately 5 mg/100 g body weight. Four groups of mice were used in some experiment for testing the ef- fect of fenofibrate. The first group (n=5) received an equal volume (25 ml/kg) of methylcellulose (0.5%) in- stead of the fenofibrate. The second group (n=5) received an equal volume of methylcellulose and 100 μg of LPS.
The third group (n=5) received fenofibrate 100 mg/kg by oral administration for 2 days and were then injected with
100 μg of LPS. The last group (n=5) received only feno- fibrate (Fig. 1).
Preparation of cell extracts
Briefly, HepG2 cells were disrupted in a sucrose-
HEPES buffer containing 0.5% Nonidet P40 as a de- tergent, protease inhibitors, and dithiothreitol. After dis- ruption by 5-minute incubation on ice and centrifugation, nuclear proteins were separated in a sodium chlor- ide-HEPES buffer and re-suspended in a glycerol-contain- ing buffer. Total cell lysates were prepared according to Santa Cruz Biotechnology (Santa Cruz, CA) Western Blotting Protocol. Briefly, cells were washed once with PBS, scraped into a 0.6 ml radio-immunoprecipitation as- say (RIPA) buffer, then incubated for 1 hour with rocking.
Lysates were then centrifuged at 13,000 rpm for 15 mi- nutes and the supernatant was retained as the total cell lysate. All the procedures were carried out on ice. Protein quantification was determined by the Bradford assay (Bio-Rad, Hercules, CA). For preparation of liver extracts from LPS-injected mice, liver tissues were homogenized into 0.1 ml 1×SDS sample buffer [62.5 mM Tris-HCl (pH 6.8 at 25oC), 2% w/v SDS, 10% glycerol, 50 mM DTT, 0.01% w/v bromophenol blue], then added 0.4 ml 1×SDS sample buffer. Lysates were sonicated for 30 seconds to shear the DNA and then centrifuged at 13,000 rpm for 15 minutes and the supernatant was retained as the total liver tissue lysate. Sample lysates (50 μl) were heated to 98oC for 10 minutes.
Western blot analysis
Denatured cell lysate was loaded onto 10% SDS-poly- acrylamide gels and subjected to electrophoresis. After electrotransfer onto nitrocellulose membrane (Amersham Pharmacia Biotech, Piscataway, NJ), blots were blocked with phosphate-buffered saline containing 0.5% Tween-20 and 5% dry milk for 1 h at room temperature and in- cubated for 2 h at room temperature with polyclonal an- ti-HO-1, anti-TNF-α, anti-actin, anti-PPARs (PPAR α, PPAR β/δ, PPAR γ), anti-catalase, anti-PMP70, and anti-PGC-1 at a dilution of 1:1,000. Immune complexes were detected by using the appropriate second antibody linked to horseradish peroxidase according to the ECL Plus Western blotting kit (Amersham Pharmacia Biotech).
After extensive washes, the band on the membrane was visualized using chemiluminescent reagents according to the manufacturer’s instructions in the dark. Immunoreac- tive bands were quantified by densitometry. Other anti- bodies tried were anti-phospho-JAK1, anti-JAK1, an- ti-phospho-STAT3, and anti-STAT3.
Immunohistochemistry
The removed liver was fixed in 4% formaldehyde for 16 h at 4oC. The liver was washed three times with PBS, dehydrated, and embedded in paraffin. Sections of 4 μm were deparaffinized in xylene and rehydrated through graded concentrations of ethanol. For immunohistochem- ical study, the kit (LSAB Universal K680; Dako) was used, and all the procedures were performed according to the instructions of the manufacturer. The endogenous per- oxidase was blocked with 3% hydrogen peroxide for 5 min at room temperature. After the sections were washed in PBS, nonspecific binding was blocked with 1% bovine serum albumin for 1 h. Then, primary antibody (1:200 di- luted) (TNF-α, TLR4, and PPARs) was added to the slides and the incubation proceeded for 1 h. After re- peated washes with PBS, the section was incubated with biotinylated secondary antibody for 1 h and then covered for 15 minutes with streptavidin-peroxidase. Finally, after repeated washes with PBS, the sections were stained in a freshly prepared substrate solution (3 mg of 3-ami- no-9-ethylcarbazole in 10 ml of sodium acetate buffer, pH 4.9, 500 μl of dimethylformamide, and 0.03% hydrogen peroxide) for 10 min. The nuclei of the immunostained cells were counter stained with Mayer’s hematoxylin.
Hematoxylin and eosin staining
After the experiment, the liver was fixed in 4% form- aldehyde for 16 h at 4oC and embedded in paraffin.
Sections were stained with hematoxylin and eosin.
Statistic analysis
Each experiment was performed at least 3 times in- dependently, and all values were represented as the means±standard deviation (SD) of triplicates. The one-way analysis of variance (ANOVA) was used to ana- lyze the statistical significance of the results. The values of p<0.05 were considered as statistically significant.
RESULTS
Injection with LPS increased leukocyte recruitment into liver and liver injury
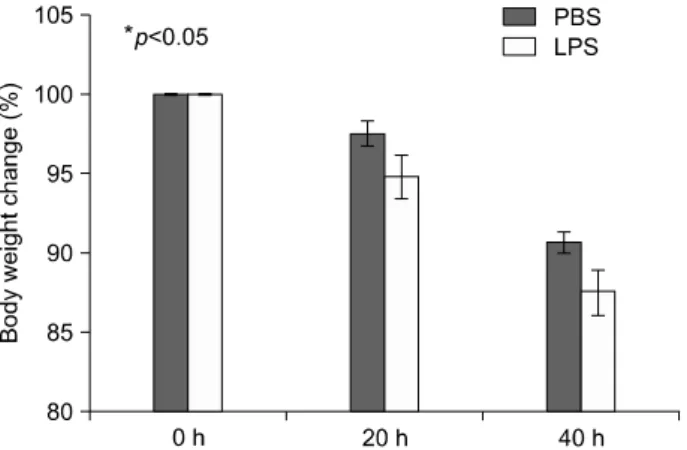
At first, the mice were weighed after LPS injection (Fig. 2).
Fig. 2. Body weight change in LPS-injected mice. Balb/c mice were injected intraperitoneally with lipopolysaccharide 5 mg/kg once. Mice were weighed after 20 and 40 h.
Fig. 3. Histopathological changes of liver sections of mice under LPS treatment. Hematoxylin and eosin stained liver sections from mice liver (original magnification, ×100). Arrowhead indicates leukocytes. Arrow indicates an inflammatory focus.
LPS induced inflammation in Balb/c mouse;
Pro-inflammatory cytokines secreted from serum and expressed in liver of LPS-injected Balb/c
Livers of Balb/c appeared histologically normal.
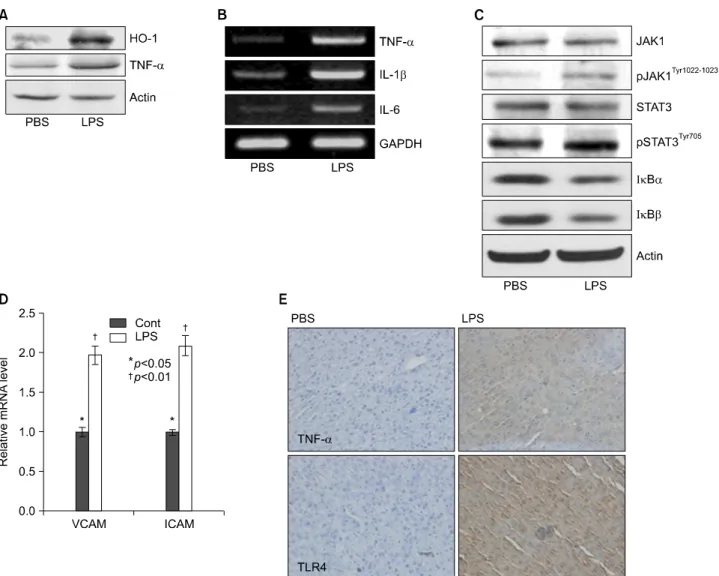
However, in livers from LPS-injected mice, histological analysis revealed the accumulation of micro-vesicular in- tracellular lipid droplets that were not observed in the PBS-injected Balb/c group. In addition, there were leuco- cytes infiltrations in the liver of LPS injected Balb/c at the indicated times (Fig. 3). As shown in Fig. 4, LPS treatment resulted in an increase of TNF-α, HO-1 (stress response protein), and TLR4 (Fig. 4A, E), or an increase of TNF-α, IL-1β, and IL-6 mRNA (Fig. 4B). The vas- cular cell adhesion protein 1 (VCAM) mediates the adhe- sion of lymphocytes, monocytes, eosinophils, and baso- phils to vascular endothelium. It also functions in leuko- cyte-endothelial cell signal transduction, and upregulation of VCAM in endothelial cells by cytokines occurs as a result of increased gene transcription (e.g., in response to TNF-α andIL-1). The promoter region of the VCAM gene contains functional tandem NF-κB (nuclear fac- tor-kappa B) sites. VCAM and ICAM were induced in the liver with LPS-injected Balb/c (Fig. 4D). JAK-STAT sig-
Fig. 4. Lipopolyssacharide-induced inflammation profiles in Balb/c. Mice were injected intraperitoneally with LPS. After 20 h, the liver was collected and analyzed for Western blot, reverse transcriptase PCR, real time PCR, and immunohistochemistry.
(A) Induction of pro-inflammatory cytokines, TNF-α, and stress inducible protein, heme oxygenase-1 (HO-1) in LPS-treated mouse. (B) Expression levels of TNF-α, IL-1β, and IL-6 mRNA were determined by RT-PCR in LPS injected mouse liver and observed by agarose-gel electrophoresis under UV illumination staining with ethidium bromide. (C) Liver lysates were prepared. Whole lysates (40 μg of protein) were separated by electrophoresis on SDS 10% polyacrylamide gels and then the protein was transferred onto nitrocellulose membrane. Each membrane was immunoblotted with antibody specific for phosphory- lated or tatal JAK and STAT. (D) Levels of VCAM and ICAM mRNA were determined by semi-quantitative real time PCR in LPS injected mouse liver (Cont: *p<0.05, LPS: †p<0.01). (E) Liver from Balb/c mice injected with PBS or LPS were removed and embedded in paraffin, and then 4 μm sections were prepared. For immunohistochemistry studies, an im- munohistochemistry kit was used, and all the procedures were performed according to the instructions of the manufacturer. The anti-TNF-α and anti-Tall like receptor (TLR) 4 were used. All results were representative of three separate experiments.
naling is an important regulator of inflammatory responses in the liver. The binding of IL-6 to its membrane receptor leads to the phosphorylation of STAT3 proteins on a spe- cific tyrosine residue (Tyr705) by JAK, which undergoes homo- or heterodimerization. These STAT 3 dimers dis- sociate from the receptor and translocate into the nucleus, where they induce the expression of specific genes. As shown in Fig. 4C, there was an increase in the activity of the JAK/STAT3 signaling pathway in the liver of mice
with LPS, as phosphor-STAT3Tyr705 and phopho- JAKTyr1022-1023
protein levels were increased. The mamma- lian transcription factor NF-κB regulates a wide variety of genes, including those involved in the inflammatory re- sponse, such as the induction of TNF-α production. In resting cells, NF-κB is bound in the cytoplasm to the in- hibitory protein, IκB. Upon stimulation, IκB kinases phosphorylate IκB on serine 32, thus triggering its degra- dation by the proteasome. Western blot analyses were per-
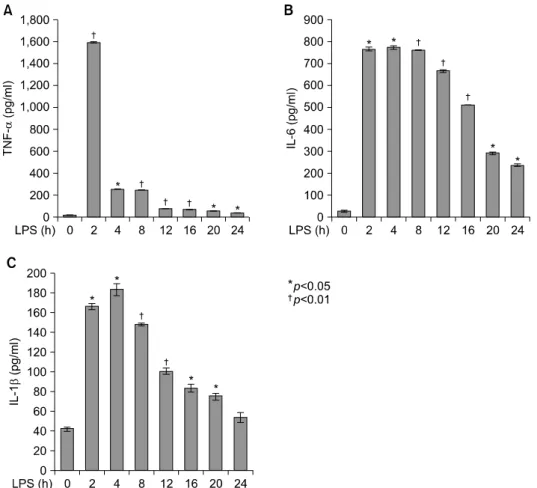
Fig. 5. Secretion of TNF-α, IL-1β, and IL-6 in serum from LPS-injected Balb/c. Secretory protein levels of TNF-α, IL-1β, and IL-6 from the serum were measured by the ELISA method for the indicated times. All results were representative of three separate experiments. (A) injection of LPS resulted in a marked increase of TNF-α which was observed as early as at 2 h and reached a primary peak level with 1,591.15±5.798 pg/ml at 2 h, and thereafter gradually decreased in a time-dependent manner. (B) LPS also increased in secretion of IL-1β, which was already reached a peak level with 183.2604±6.542 pg/ml at 4 h, thereafter sustained its level up to 12 h, and gradually decreased in a time-dependent manner. (C) IL-6 secretion was already reached a peak level with 766.3889±8.214 pg/ml at 2 h, and thereafter gradually decreased in a time-dependent manner.
formed with anti-IκBα and IκBβ antibodies on total protein samples extracted from the liver with the LPS treatments. Western blots revealed that protein levels of IκBα and IκBβ were decreased in LPS-treated liver (Fig. 4C). As shown Fig. 4C, these results indicate that an LPS induced phospho-JAK1 and -STAT3, and proteol- ysis of both IκBα and IκBβ. In the current study, I demonstrated that LPS induces transcriptional and transla- tional upregulation of TNF-α, IL-1β, and IL-6 in the liver in vivo. Previous studies have demonstrated that the production of proinflammatory cytokines is significantly enhanced by the interaction of TLR4 and its exogenously introduced ligand LPS. I therefore investigated by im- munohistochemical staining whether in vivo injection of LPS affects the expression of TLR4 and proinflammatory cytokines in the liver. As shown in Fig. 4E, the LPS-in-
jected groups had markedly enhanced expression of TLR4 and TNF-α proteins. Next, serum was isolated at 2, 4, 8, 16, 20, and 24 h after 5 mg/kg LPS injection in Balb/c.
The secretion of proinflammatory cytokines was de- termined by enzyme-linked immunosorbent assay (ELISA). As shown in Fig. 5A, injection of LPS resulted in a marked increase of TNF-α secretion, which was ob- served as early as 2 h and reached a primary peak level with 1,591.15±5.798 pg/ml at 2 h, and thereafter gradually decreased in a time-dependent manner. LPS also increased secretion of IL-1β, which already reached a peak level with 183.2604±6.542 pg/ml at 4 h, thereafter sustaining its level up to 12 h, and gradually decreasing in a time-de- pendent manner. IL-6 secretion already reached a peak level with 766.3889±8.214 pg/ml at 2 h, and thereafter gradually decreased in a time-dependent manner (Fig. 5).
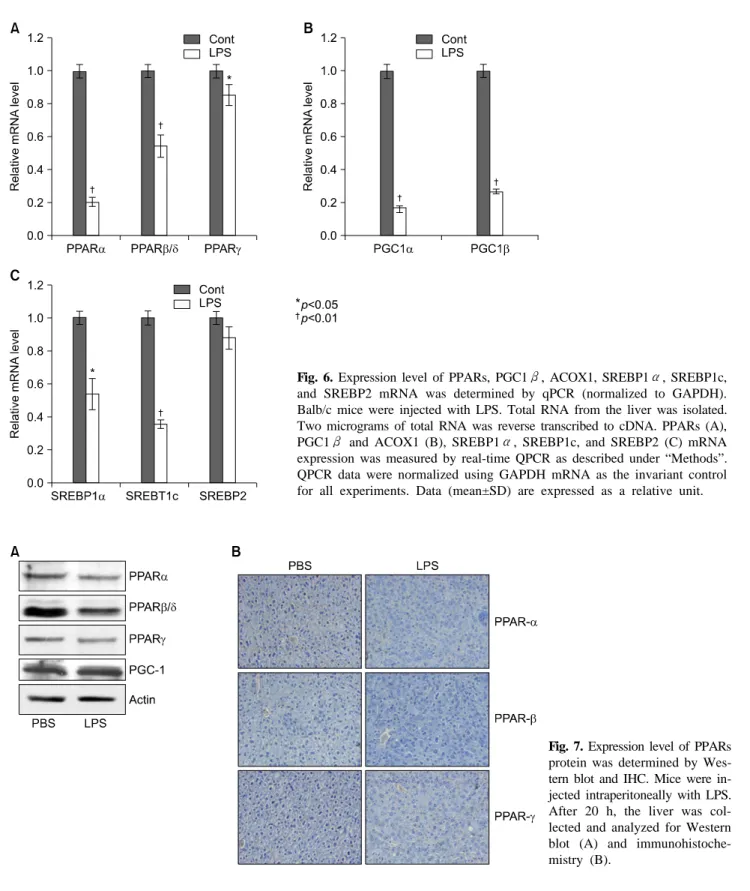
Fig. 7. Expression level of PPARs protein was determined by Wes- tern blot and IHC. Mice were in- jected intraperitoneally with LPS.
After 20 h, the liver was col- lected and analyzed for Western blot (A) and immunohistoche- mistry (B).
Cytokines induced LPS decreased PPARs and co-activators level of mRNA and protein in Balb/c
As shown Fig. 6A, LPS significantly decreased the mRNA levels of PPARα and PPARβ/δ. As reported previously in hamsters, LPS-treated mice also displayed
a decrease in retinoid X receptor α (RXRα), PPARα, PPARγ, and liver X receptor α (LXRα) mRNA levels, indicating that the acute phase response (APR) in vivo de- creases their nuclear hormone receptors. Moreover, PPARγ coactivator 1α (PGC1α) and PGC1β mRNA levels de- creased in the liver (Fig. 6B). In addition, LPS decreased Fig. 6. Expression level of PPARs, PGC1β, ACOX1, SREBP1α, SREBP1c, and SREBP2 mRNA was determined by qPCR (normalized to GAPDH).
Balb/c mice were injected with LPS. Total RNA from the liver was isolated.
Two micrograms of total RNA was reverse transcribed to cDNA. PPARs (A), PGC1β and ACOX1 (B), SREBP1α, SREBP1c, and SREBP2 (C) mRNA expression was measured by real-time QPCR as described under “Methods”.
QPCR data were normalized using GAPDH mRNA as the invariant control for all experiments. Data (mean±SD) are expressed as a relative unit.
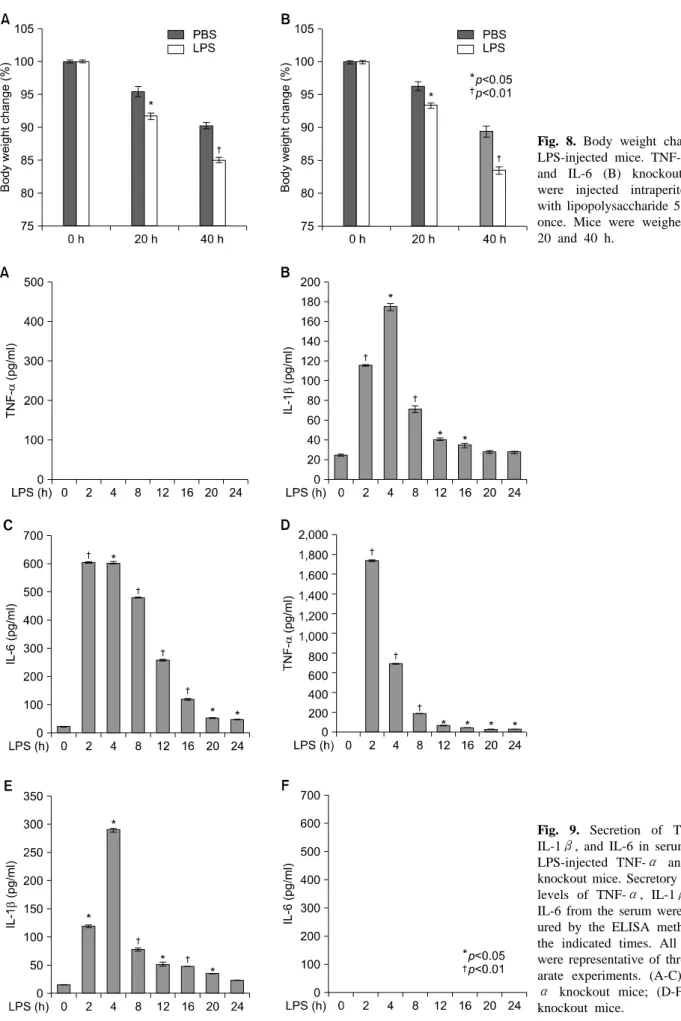
Fig. 8. Body weight change in LPS-injected mice. TNF-α (A) and IL-6 (B) knockout mice were injected intraperitoneally with lipopolysaccharide 5 mg/kg once. Mice were weighed after 20 and 40 h.
Fig. 9. Secretion of TNF-α, IL-1β, and IL-6 in serum from LPS-injected TNF-α and IL-6 knockout mice. Secretory protein levels of TNF-α, IL-1β, and IL-6 from the serum were meas- ured by the ELISA method for the indicated times. All results were representative of three sep- arate experiments. (A-C) TNF- α knockout mice; (D-F) IL-6 knockout mice.
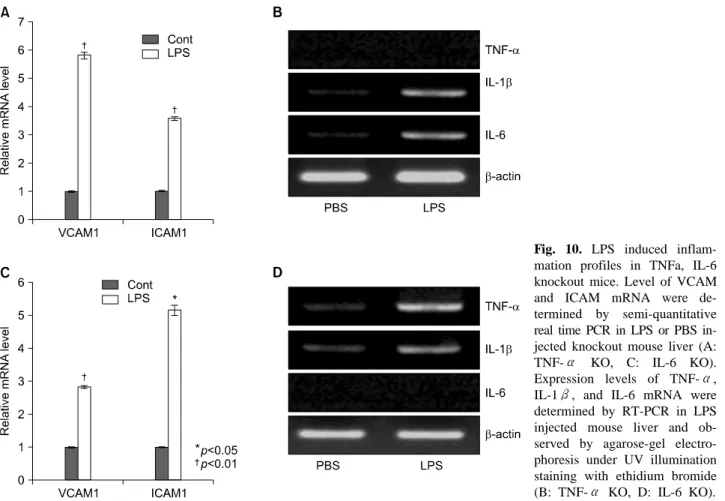
Fig. 10. LPS induced inflam- mation profiles in TNFa, IL-6 knockout mice. Level of VCAM and ICAM mRNA were de- termined by semi-quantitative real time PCR in LPS or PBS in- jected knockout mouse liver (A:
TNF-α KO, C: IL-6 KO).
Expression levels of TNF-α, IL-1β, and IL-6 mRNA were determined by RT-PCR in LPS injected mouse liver and ob- served by agarose-gel electro- phoresis under UV illumination staining with ethidium bromide (B: TNF-α KO, D: IL-6 KO).
the mRNA levels of SREBP-1α and SREBP-1c, an LXR-regulated gene (Fig. 6C). In contrast, the mRNA level of SREBP-2 was not altered by LPS injection. As shown in Fig. 7, LPS decreased PPARα, PPARβ/δ, and PPARγ in the liver of Balb/c.
LPS induced inflammation in TNF-α and IL-6 knock- out mouse; Pro-inflammatory cytokines secreted from se- rum and expressed in liver of LPS-injected KO mice.
To explore the role of PPARs on LPS-induced in- flammation in liver, I next examined with TNF-α and IL-6 knockout mouse. All knockout mice were weighed after LPS injection (Fig. 8). LPS significantly decreased their body weight compared with the PBS-injected group after 20 and 40 hours. Serums of TNF-α and IL-6 KO mice were separated at 2, 4, 8, 12, 16, 20, and 24 h after exposure to 5 mg/kg LPS. The secretion of each proin- flammatory cytokine, including TNF-α, IL-1β, and IL-6, was determined by ELISA. As shown in Fig. 9, LPS injection resulted in a marked increase of IL-1β secre- tion, which was observed as early as 2 h and reached a peak level of 175.2273±3.551 pg/ml at 4 h, and thereafter
gradually decreased in a time-dependent manner (Fig.
9B). LPS also induced an increased release of IL-6, which already reached a peak level of 605.1538±3.085 pg/ml at 2 h, and sustained this level up to 4 h, and then gradually decreased in a time-dependent manner in the TNF-α KO mouse (Fig. 9C). In IL-6 KO mouse, LPS injection re- sulted in a marked increase of TNF-α secretion, which reached a peak level of 1749.417±10.053 pg/ml at 2 h, and then decreased in a time-dependent manner (Fig. 9D).
In addition, LPS induced an increased release of IL-1β, which was observed as early as 2 h (120.3412±2.658 pg/ml) and reached a peak level of 290.9527±3.338 pg/ml at 4h, and then decreased in a time-dependent manner (Fig. 9E). There were no secretions of TNF-α and IL-6 in TNF-α KO (Fig. 9A) and IL-6 (Fig. 9F) KO mouse.
VCAM and ICAM were induced in the liver with LPS-in- jected TNF-α (Fig. 10A) and IL-6 (Fig. 10C) KO mouse.
Interestingly, VCAM and ICAM increased the level of mRNA in KO mice more than Balb/c. Next, I examined the transcriptional activation of proinflammatory cyto- kines in the liver of LPS-injected TNF-α and IL-6 KO
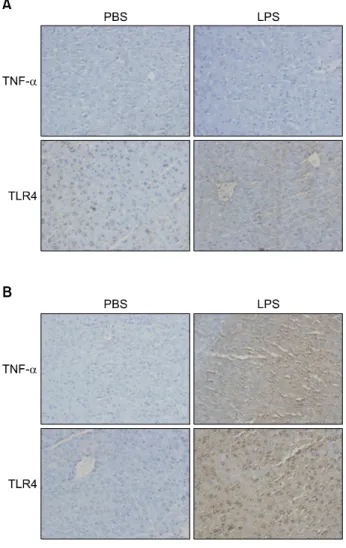
Fig. 11. In vivo effect of LPS on TNF-α and TLR4 ex- pression in the liver of TNF-α (A), IL-6 (B) knockout mice.
Liver from knockout mice injected with PBS or LPS were removed and embedded in paraffin, and then 4 μm sections were prepared. For immunohistochemistry studies, an im- munohistochemistry kit was used, and all the procedures were performed according to the instructions of the manufacturer.
The anti-TNF-α and anti-Tall like receptor (TLR) 4 were used. All results were representative of three separate experiments.
mice. An increase in the RT-PCR products of proin- flammatory cytokine mRNAs was detected (Fig. 10B, D).
Next, I investigated by immunohistochemical staining whether an in vivo injection of LPS affects the expression of TLR4 and proinflammatory cytokines in the liver of TNF-α and IL-6 KO mice. As shown in Fig. 11A, the LPS-injected groups showed very slight expression of the TLR4 protein, similar to that of the PBS control. In addi- tion, no staining of the TNF-α protein was seen in the liver of TNF-α KO mouse. However, as shown in Fig.
11B, the expression of TNF-α and TLR4 protein after LPS treatment was markedly enhanced by LPS in all re-
gions of the liver of IL-6 KO mouse (Fig. 11B).
Cytokines induced LPS decreased PPARs and co-activators level of mRNA and protein in TNF-α and IL-6 knockout mouse
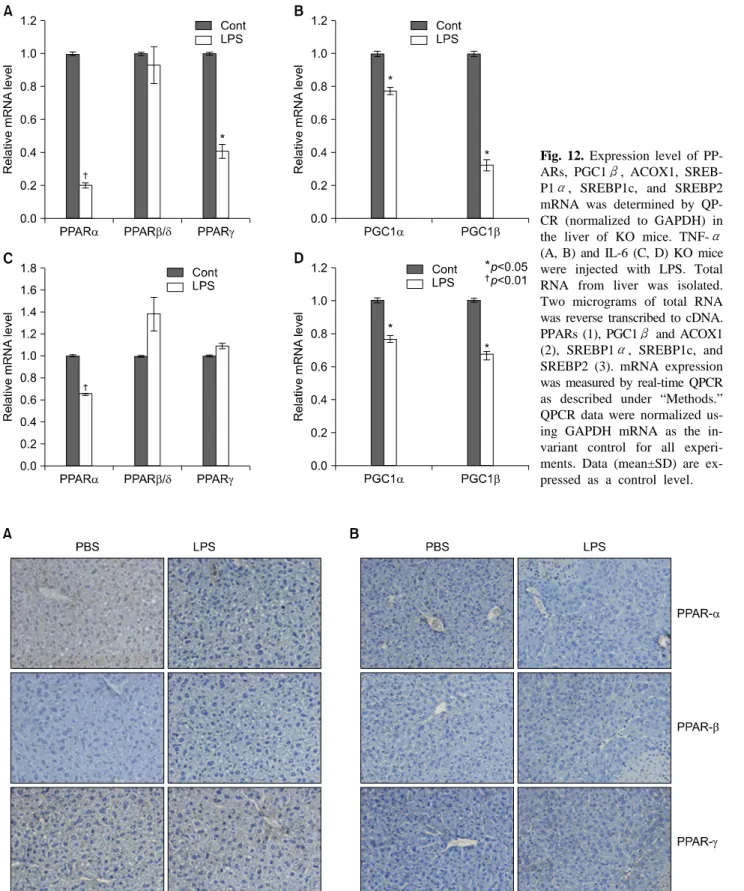
Next I examined the level of PPARs and coactivators mRNA in the liver with LPS-injected TNF-α and IL-6 KO mouse. As shown in Fig. 12A, LPS significantly de- creased the mRNA levels of PPARα and PPARγ in the liver of TNF-α KO mouse. In addition, LPS only sig- nificantly decreased the mRNA levels of PPARα in IL-6 KO mouse (Fig. 12C). Moreover, PGC1α and PGC1β mRNA levels of LPS-treated mice decreased in the liver of TNF-α and IL-6 KO mice (Fig. 12B, D). Furthermore, LPS injection decreased the expression of PPARα pro- tein in TNF-α and IL-6 knockout mice (Fig. 13A, B).
Pretreatment with fenofibrate attenuated leukocyte recruitment and liver injury after LPS To explore the role of PPARα activation on LPS-in- duced proinflammatory cytokines and inflammation-rela- ted PPARs gene expression in the liver, I pretreated the mice with a PPARα agonist, fenofibrate, as described in Fig. 1B. The liver sections from mice injected with LPS alone or fenofibrate plus LPS were stained by hematox- ylin and eosin. More pronounced liver injury was noted in mice treated with LPS. However, fenofibrate admin- istrations produced notable block necrotic inflammation (arrow) and ameliorated leukocyte infiltration (arrowhead, Fig. 14).
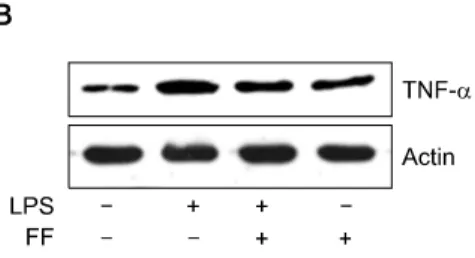
Fenofibrate inhibited LPS-induced elevation of pro-inflammatory cytokines in serum and liver of Balb/c, TNF-α KO, and IL-6 mice
To gain further insight into the mechanisms underlying the proinflammatory profile blockade by fenofibrate, I in- jected fenofibrate as described in ‘Methods’. As shown in Fig. 15A and B, LPS increased the proinflammatory cyto- kines mRNA level (TNF-α, IL-1β, and IL-6) and TNF- α protein level in the liver of Balb/c mouse. However, pretreatment of the liver with fenofibrate decreased the proinflammatory cytokines mRNA and protein level. I al- so checked the IκBα and IκBβ protein levels. LPS decreased the IκBα and IκBβ protein levels.
However, fenofibrate blocked degradation of IκBα and
Fig. 12. Expression level of PP- ARs, PGC1β, ACOX1, SREB- P1α, SREBP1c, and SREBP2 mRNA was determined by QP- CR (normalized to GAPDH) in the liver of KO mice. TNF-α (A, B) and IL-6 (C, D) KO mice were injected with LPS. Total RNA from liver was isolated.
Two micrograms of total RNA was reverse transcribed to cDNA.
PPARs (1), PGC1β and ACOX1 (2), SREBP1α, SREBP1c, and SREBP2 (3). mRNA expression was measured by real-time QPCR as described under “Methods.”
QPCR data were normalized us- ing GAPDH mRNA as the in- variant control for all experi- ments. Data (mean±SD) are ex- pressed as a control level.
Fig. 13. In vivo effect of LPS on PPARs expression in the liver of TNF-α and IL-6 KO mice. Expression level of PPARs protein was determined by immunohistochemistry. TNF-α (A) and IL-6 KO (B) mice were injected intraperitoneally with LPS.
After 20 h, the liver was collected and analyzed for immunohistochemistry.
Fig. 14. Effects of fenofibrate on LPS-induced inflammation in Balb/c mice. Hematoxylin and eosin stain (×100) shows intra- cellular lipid accumulation and inflammation.
IκBβ proteins (Fig. 15C). Next, In order to quantify the effect of fenofibrate on LPS-induced release of proin- flammatory cytokines from serum, I surveyed the proin- flammatory cytokines using the ELISA method in Balb/c, TNF-α KO and IL-6 KO mice. As shown Fig. 16A-C (Balb/c), injection of LPS resulted in a marked increase of TNF-α, IL-1β, and IL-6 secretion in the indicated times. However, fenofibrate significantly decreased the se-
cretion of TNF-α, IL-1β, and IL-6. Fenofibrate alone did not change the secretion of proinflammatory cytokines. As shown Fig. 16D-F (TNF-α KO) and G-I (IL-6 KO), injection of LPS markedly increased proin- flammatory cytokines. However, pretreatment with fenofi- brate significantly decreased secretion of TNF-α, IL-1β, and IL-6.
Fig. 15. Effect of fenofibrate on proinflammatory cytokine mRNA and pro- tein level in Balb/c mice. LPS-induced expression levels of mRNA (A) and protein (B) were determined by RT-PCR and Western blot in the presence and absence of fenofibrate as described under “Methods.” The amplified gene products were observed by agarose-gel electrophoresis under UV illumination staining with ethidium bromide. TNF-α protein level was detected by Western blot. (C) Western blot analyses of IκBα and IκBβ in liver treat- ed with PPAR-α agonist fenofibrate (100 mg/kg) and followed by LPS treat- ment (5 mg/kg).
Fig. 16. Effect of fenofibrate on proinflammatory cytokine mRNA levels in serum of Balb/c, TNF- α KO, and IL6 KO mice. All mice were fed fenofibrate (100 mg/kg) or methylcellulose. After LPS injection, the pro-inflam- matory cytokines were measured by the ELISA method for the in- dicated times. All results were representative of three separate experiments. (A-C) Balb/c mou- se, (D-F) TNF-α KO mouse;
(G-I) IL-6 KO mouse.
Fenofibrate inhibited LPS-induced decrease of PPARs in liver of Balb/c
To investigate if activated PPARα could lead to a dra- matically reduced ability to degrade PPARs in response to LPS treatment, Western blot analyses were performed with anti-PPARα, PPARβ/δ, and PPARγ antibodies on total protein samples extracted from the liver with vari- ous treatments. Western blots revealed that the protein levels of PPARs were decreased in LPS-injected liver (Fig. 17A). Treatment with LPS induced rapid proteolysis of PPARs, and fenofibrate blocked proteolysis of PPARs.
Fenofibrate treatment itself regulated the protein levels of PPARα and PPARγ without LPS stimulation. In addi- tion, treatment with LPS decreased PGC1β and PMP70 proteins. However, treatment with fenofibrate blocked degradation of PGC1β and PMP70 proteins (Fig. 17B).
Fenofibrate inhibited LPS-induced elevation of pro-inflammatory cytokines in HepG2
As shown in Fig. 18, LPS increased the proin- flammatory cytokines mRNA level including TNF-α, IL-1β, and IL-6 in the human hepatoma cell line,
Fig. 16. Continued.
Fig. 17. Effect of fenofibrate on PPARs (A), catalase, PMP70, and PGC1b (B) expression in treated liver tissue of Balb/c.
After pretreatment with fenofi- brate, LPS was injected intra- peritoneally. Whole liver lysates (40 μg of protein) were separa- ted by electrophoresis on SDS 10% polyacrylamide gels and then the protein were transferred onto a nitrocellulose membrane.
Each membrane was immuno- blotted with antibody specific for PPARs, catalase, PGC1, PMP70, and actin. The results were rep- resentative of three separate ex- periments.
Fig. 18. Effect of fenofibrate on proinflammatory cytokine mRNA level in HepG2. Expression levels of TNF-α, IL-1β, and IL-6 mRNA were determined by RT-PCR. PCR products observed by agarose-gel electrophoresis under UV illumina- tion staining with ethidium bromide (TNF-α KO; IL-6 KO).
Fig. 19. Effect of fenofibrate on PPARs mRNA level in the liver of Balb/c. Fenofibrate (100 mg/kg) or its vehicle (water containing 0.5% methylcellulose) were administered. After LPS injection, total RNA from the liver was isolated. Two micrograms of total RNA was reverse transcribed to cDNA.
PPARs mRNA expression was measured by real-time QPCR as described under “Methods.” QPCR data were normalized using GAPDH mRNA as the invariant control for all experiments. Data (mean±SD) are expressed as a relative unit.
HepG2. However, pretreatment with fenofibrate decreased the proinflammatory cytokines mRNA level (Fig. 18).
Pretreatment with fenofibrate elevated PPARs mRNA
LPS causes a decrease in PPARs including PPARα, PPARβ/δ, and PPARγ in the liver of Balb/c. The liver was pretreated with fenofibrate and further maintained with LPS for 20 h. As shown in Fig. 19, treatment with LPS resulted in a significant decrease. PPARα was the most inhibited. However, pretreatment with fenofibrate significantly increased PPARs mRNA levels.
DISCUSSION
In the present study, I report that LPS induces in- flammation in the liver of Balb/c through the NFκB sig- nal pathway as well as in TNF-α KO and IL-6 KO mouse. Furthermore, I demonstrate that LPS decreases mRNA levels of PPARs. However, fenofibrate, a PPARα agonist, attenuates the response of inflammation through blocking NFκB signaling. Finally, I show that fenofibrate regulates, at least in part, mRNA levels of PPARs.
Infection, inflammation, and injury induce the acute phase response, which results in a wide range of metabol- ic changes that are mediated by altered gene expression, caused primarily by the production of inflammatory cyto- kines including TNF-α, IL-1β, and IL-6.23 The mecha- nism of induction of the positive acute phase proteins has been studied in detail.24 Activation of the TNF/IL-1 re- ceptors leads to activation of transcription factors such as NFκB and activator protein 1 (AP1) inducing class I pos- itive acute phase proteins, whereas activation of the IL-6
receptor activates Janus kinase tyrosine kinase, which sub- sequently phosphorylates tyrosine residues of signal trans- ducer and activator of transcription proteins inducing the transcription of class II positive acute phase proteins. LPS increases the recruitment of leukocytes into the liver and proinflammatory cytokines including TNF-α, IL-1β, and IL-6 in Balb/c. In addition, hepatocytes over expressed TLR4 and TNF-α through the JAK-STAT and NFκB signal pathway.
Previous studies have shown that the levels and DNA-binding activity of PPARα, and LXRα are sig- nificantly decreased during LPS-induced APR in the livers of Syrian hamsters. This decrease was accompanied by re- duced expression of their target genes. In the present study, I demonstrate that LPS-induced inflammation de- creases the levels of mRNA, PPARα, PPARβ/δ, and PPARγ in the liver of Balb/c. Moreover, the protein lev- els of PPARs decrease in the liver. These results indicate that proinflammatory cytokines can directly induce chang- es in the levels of PPARα, PPARβ/δ, and PPARγ in hepatic tissue.
LPS increases proinflammatory cytokines including IL-1β and IL-6 in TNF-α KO mouse. The mRNA levels also upregulate in the liver of TNF-α KO. LPS increases proinflammatory cytokines including TNF-α and IL-1β
Fig. 20. PPARα is a modulator of the inflammatory response in the liver.
Fig. 21. Cellular mechanism of the LPS in the liver and inter- action of PPARα at several lev- els of the inflammatory signaling pathway. Interaction with the NF κB pathway. LPS increases cy- tokines including TNF-α, IL-1 β, and IL-6 through the NFκB pathway. Fenofibrate, a PPARα agonist, inhibits the NFκB pathway through blocking trans- location of NFκB into nucleus.
(1) Inhibition of phosphorylation of IκB. (2) Inhibition of nuclear translocation of inflammatory transcription factors. (3) Interfe- rence with activation of the tran- scription initiation complex via cofactor interaction.
in IL-6 KO mouse. The mRNA levels also were upregu- lated in the liver of IL-6 KO. Interestingly, VCAM1 is highly expressed in the absence of TNF-α. However, ICAM1 is highly expressed in IL-6 KO.
LPS in vivo including Balb/c, TNF-α KO, and IL-6 KO mice differentially regulated PPAR isoforms. LPS-in- duced inflammation decreases all PPAR isoforms in Balb/c. However, inflammation significantly decreases PPARα and PPARγ in the liver of TNF-α KO mouse, and decreases PPARα and PPARβ/δ mRNA in IL-6 KO mouse.
A role for PPARα as a general modulator of the in- flammatory response was provided by Devchand et al.,25
who demonstrated that inflammation is prolonged in PPARα-deficient mice. Subsequently, PPARα was found to regulate the inflammatory response in vascular cells (Fig. 20). For example, PPARα activation results in the inhibition of the production of endothelin-1, vas- cular cell adhesion molecule (VCAM)-1, IL-6, and tissue factor in endothelial cells, smooth muscle cells, and macrophages.26-28 In vivo evidence of an antiinflammatory action of PPARα came with the demonstration that aor- tas from PPARα-deficient mice display an exacerbated inflammatory response to lipopolysaccharide stimulation.
Because PPARα is highly expressed in the liver, a role for PPARα as a modulator of the inflammatory response at the hepatic level and the acute phase response was thereafter demonstrated (Fig. 20).14 The acute phase re- sponse is a generalized response of the organism to multi- ple disturbances of its physiological homeostasis, which is exacerbated under conditions of sepsis. Although in- flammatory processes are important for the initiation of defense mechanisms,1 they can become deleterious under situations of chronic activation. Produced as part of sys- temic inflammatory reactions, IL-6 and IL-1 induce acute phase protein (APP) genes in liver cells, such as CRP, fi- brinogen, serum amyloid A (SAA), and α2-macro- globulin2 Elevated levels of IL-6 and liver APPs are found
in patients with acute coronary syndrome and reflect the inflammatory state.3 The expression levels of APPs are regulated by fibrates,29 which act via a PPARα-depen- dent mechanism.30 Hence, several acute phase response markers such as fibrinogen, CRP, SAA, α2-macro- globulin, and plasminogen are lowered after fenofibrate treatment in humans, whereas levels of albumin, a neg- ative acute phase response protein, are raised.
Several studies have delineated the cellular and molec- ular mechanisms explaining the modulation of the hepatic inflammation response by PPARα activation (Fig. 21).
Transcription of target genes by proinflammatory cyto- kines, such as TNF-α, IL-1, and IL-6 is mediated by sev- eral transcription factors acting alone or in combination.
Among such transcription factors are CCAAT-enhancer binding proteins (C/EBP), signal transducer and activator of transcription proteins (STAT), the activator protein-1 (AP-1) complex including c-fos and c-jun, and the NFκB complex, which is most frequently composed of p50 and p65 proteins. Transcriptional activity is mediated by inter- action with cofactors that remodel chromatin and bridge the DNA-bound transcription factors to the basal tran- scription machinery. Therefore, a decrease in cofactor availability would strongly affect transcription. This con- stitutes the first antiinflammatory mode of action of acti- vated PPARα. For instance, through the binding and ti- tration of GRIP1/TIF2, a coactivator for C/EBPβ, PPARα interferes negatively with IL-6 transcription induction.
This mechanism may participate in the inhibition of sev- eral C/EBPβ/GRIP1-regulated APP genes by fibrates, in- cluding fibrinogen-α, fibrinogen-β, and serum amyloid A.30
Treatment with fenofibrate reduces cerebral infarct size caused by cerebral ischemia. Some fibrates, in particular fenofibrate, have been shown to inhibit complex I of the respiratory chain, suggesting a role of fenofibrate in mi- tochondrial dysfunction. Another hypothesis is that a high dose of fenofibrate may exert a massive antiinflammatory effect by inhibiting cytokines (TNF-α, interleukin-1) production. It is known that blockade of cytokines in the early phase is beneficial but their presence is also funda- mental for the processes of tissue repair and regene- ration.31
In this study, I report that treatment with fenofibrate, a PPARα agonist, improved the hepatitis cell damage
and attenuated the recruitment of leukocytes. Fenofibrate blocked the level of proinflammatory cytokines through inhibiting IκBα and IκBβ degradation and inducing NFκB translocation in liver of Balb/c mouse and HepG2 cell. In addition, fenofibrate attenuates levels of proin- flammatory cytokines in the serum of Balb/c, TNF-α KO, and IL-6 KO mouse. The present study also demon- strates that LPS-induced inflammation decreased PPARs mRNA levels in the liver, and fenofibrate significantly in- creased mRNA levels of PPARs.
REFERENCES
1. Streetz KL, Wüstefeld T, Klein C, et al. Mediators of in- flammation and acute phase response in the liver. Cell Mol Biol (Noisy-le-grand) 2001;47:661-673.
2. Hoffmeister A, Rothenbacher D, Bäzner U, et al. Role of novel markers of inflammation in patients with stable coronary heart disease. Am J Cardiol 2001;87:262-266.
3. Ridker PM, Stampfer MJ, Rifai N. Novel risk factors for sys- temic atherosclerosis: a comparison of C-reactive protein, fibri- nogen, homocysteine, lipoprotein(a), and standard cholesterol screening as predictors of peripheral arterial disease. JAMA 2001;285:2481-2485.
4. Heinrich PC, Behrmann I, Müller-Newen G, et al. Interleukin-6- type cytokine signalling through the gp130/Jak/STAT pathway.
Biochem J 1998;334:297-314.
5. Kim H, Baumann H. Dual signaling role of the protein tyrosine phosphatase SHP-2 in regulating expression of acute-phase plas- ma proteins by interleukin-6 cytokine receptors in hepatic cells.
Mol Cell Biol 1999;19:5326-5338.
6. Yoo JY, Wang W, Desiderio S, et al. Synergistic activity of STAT3 and c-Jun at a specific array of DNA elements in the alpha 2-macroglobulin promoter. J Biol Chem 2001;276:26421- 26429.
7. Zauberman A, Lapter S, Zipori D. Smad proteins suppress CCAAT/enhancer-binding protein (C/EBP) beta- and STAT3-me- diated transcriptional activation of the haptoglobin promoter. J Biol Chem 2001;276:24719-24725.
8. Issemann I, Green S. Activation of a member of the steroid hor- mone receptor superfamily by peroxisome proliferators. Nature 1990;347:645-650.
9. Forman BM, Chen J, Evans RM. Hypolipidemic drugs, poly- unsaturated fatty acids, and eicosanoids are ligands for perox- isome proliferator-activated receptors alpha and delta. Proc Natl Acad Sci U S A 1997;94:4312-4317.
10. Gervois P, Chopin-Delannoy S, Fadel A, et al. Fibrates increase human REV-ERBalpha expression in liver via a novel perox- isome proliferator-activated receptor response element. Mol Endocrinol 1999;13:400-409.
11. Kersten S, Seydoux J, Peters JM, et al. Peroxisome prolifera- tor-activated receptor alpha mediates the adaptive response to fasting. J Clin Invest 1999;103:1489-1498.
12. Guerre-Millo M, Gervois P, Raspé E, et al. Peroxisome prolifera- tor-activated receptor alpha activators improve insulin sensitivity and reduce adiposity. J Biol Chem 2000;275:16638-16642.
13. Gervois P, Torra IP, Fruchart JC, et al. Regulation of lipid and lipoprotein metabolism by PPAR activators. Clin Chem Lab Med 2000;38:3-11.
14. Gervois P, Kleemann R, Pilon A, et al. Global suppression of IL-6-induced acute phase response gene expression after chronic in vivo treatment with the peroxisome proliferator-activated re- ceptor-alpha activator fenofibrate. J Biol Chem 2004;279:16154- 16160.
15. Stienstra R, Mandard S, Patsouris D, et al. Peroxisome pro- liferator-activated receptor alpha protects against obesity-induced hepatic inflammation. Endocrinology 2007;148:2753-2763.
16. He W, Barak Y, Hevener A, et al. Adipose-specific peroxisome proliferator-activated receptor gamma knockout causes insulin re- sistance in fat and liver but not in muscle. Proc Natl Acad Sci U S A 2003;100:15712-15717.
17. Marra F, Efsen E, Romanelli RG, et al. Ligands of peroxisome proliferator-activated receptor gamma modulate profibrogenic and proinflammatory actions in hepatic stellate cells. Gastroenterol- ogy 2000;119:466-478.
18. Daynes RA, Jones DC. Emerging roles of PPARs in inflam- mation and immunity. Nat Rev Immunol 2002;2:748-759.
19. Planavila A, Rodríguez-calvo R, Jové M, et al. Peroxisome pro- liferator-activated receptor beta/delta activation inhibits hyper- trophy in neonatal rat cardiomyocytes. Cardiovasc Res 2005;65:
832-841.
20. Planavila A, Laguna JC, Vázquez-carrera M. Nuclear factor- kappaB activation leads to down-regulation of fatty acid oxida- tion during cardiac hypertrophy. J Bio Chem 2005;280:17464- 17471.
21. Xu J, Storer PD, Chavis JA, et al. Agonists for the peroxisome proliferator-activated receptor-alpha and the retinoid X receptor inhibit inflammatory responses of microglia. J Neurosci Res 2005;81:403-411.
22. Jonkers IJ, Mohrschladt MF, Westendorp RG, et al. Severe hy- pertriglyceridemia with insulin resistance is associated with sys-
temic inflammation: reversal with bezafibrate therapy in a randomized controlled trial. Am J Med 2002;112:275-280.
23. Khovidhunkit W, Kim MS, Memon RA, et al. Effects of infection and inflammation on lipid and lipoprotein metabolism: mecha- nisms and consequences to the host. J Lipid Res 2004;45:
1169-1196.
24. Zhong Z, Wen Z, Darnell JE Jr. Stat3 and Stat4: members of the family of signal transducers and activators of transcription.
Proc Natl Acad Sci USA 1994;91:4806-4810.
25. Devchand, PR, Keller H, Peters JM, et al. The PPARalpha-leuko- triene B4 pathway to inflammation control. Nature 1996;384:
39-43.
26. Jackson SM, Parhami F, Xi XP, et al. Peroxisome proliferator- activated receptor activators target human endothelial cells to in- hibit leukocyte-endothelial cell interaction. Arterioscler Thromb Vasc Biol 1999;19:2094-2104.
27. Marx N, Mackman N, Schönbeck U, et al. PPARalpha activators inhibit tissue factor expression and activity in human monocytes.
Circulation 2001;103:213-219.
28. Neve BP, Corseaux D, Chinetti G, et al. PPARalpha agonists in- hibit tissue factor expression in human monocytes and macro- phages. Circulation 2001;103:207-212.
29. Sirtori CR, Colli S. Influences of lipid-modifying agents on hemostasis. Cardiovasc Drugs Ther 1993;7:817-823.
30. Gervois P, Vu-dac N, Kleemann R, et al. Negative regulation of human fibrinogen gene expression by peroxisome proliferator- activated receptor alpha agonists via inhibition of CCAAT box/enhancer-binding protein beta. J Biol Chem 2001;276:33471- 33477.
31. Morganti-kossman MC, Lenzlinger PM, Hans V, et al. Production of cytokines following brain injury: beneficial and deleterious for the damaged tissue. Mol Psychiatry 1997;2:133-136.