D I A B E T E S & M E T A B O L I S M J O U R N A L
This is an Open Access article distributed under the terms of the Creative Commons At- tribution Non-Commercial License (http://creativecommons.org/licenses/by-nc/3.0/) which permits unrestricted non-commercial use, distribution, and reproduction in any medium, provided the original work is properly cited.
Serum Total Bilirubin Levels Provide Additive Risk Information over the Framingham Risk Score for
Identifying Asymptomatic Diabetic Patients at Higher Risk for Coronary Artery Stenosis
Jaechan Leem1, Eun Hee Koh1, Jung Eun Jang1, Chang-Yun Woo1, Jin Sun Oh1, Min Jung Lee1, Joon-Won Kang2, Tae-Hwan Lim2, Chang Hee Jung1, Woo Je Lee1, Joong-Yeol Park1, Ki-Up Lee1
Departments of 1Internal Medicine, 2Radiology, University of Ulsan College of Medicine, Seoul, Korea
Background: The diagnosis of coronary artery disease (CAD) is often delayed in patients with type 2 diabetes. Serum total bili- rubin levels are inversely associated with CAD. However, no studies have examined whether this can be used as a biochemical marker for identifying asymptomatic diabetic patients at higher risk for having obstructive CAD.
Methods: We performed a cross-sectional study of 460 consecutive asymptomatic patients with type 2 diabetes. All patients un- derwent coronary computed tomographic angiography, and their serum total bilirubin levels were measured. Obstructive CAD was defined as ≥50% diameter stenosis in at least one coronary artery.
Results: Serum total bilirubin tertiles showed an inverse association with the prevalence of obstructive CAD. In multivariate lo- gistic regression analysis, the odds ratio for the highest versus the lowest tertile of total bilirubin was 0.227 (95% confidence in- terval [CI], 0.130 to 0.398), and an increment of 1 μmol/L in serum total bilirubin level was associated with a 14.6% decrease in obstructive CAD after adjustment for confounding variables. Receiver operating characteristic curve analysis showed that the area under the curve for the Framingham Risk Score (FRS) plus serum total bilirubin level was 0.712 (95% CI, 0.668 to 0.753), which is significantly greater than that of the FRS alone (P=0.0028).
Conclusion: Serum total bilirubin level is inversely associated with obstructive CAD and provides additive risk information over the FRS. Serum total bilirubin may be helpful for identifying asymptomatic patients with type 2 diabetes who are at higher risk for obstructive CAD.
Keywords: Bilirubin; Coronary artery disease; Diabetes mellitus; Multidetector computed tomography
Corresponding author: Ki-Up Lee
Department of Internal Medicine, University of Ulsan College of Medicine, 88 Olympic-ro 43-gil, Songpa-gu, Seoul 05506, Korea
E-mail: [email protected]
INTRODUCTION
Coronary artery disease (CAD) is the major cause of morbidi- ty and mortality in patients with type 2 diabetes. The diagnosis of CAD is often delayed in patients with type 2 diabetes due to a lack of symptoms [1]. Thus, diabetic patients have more ex- tensive CAD at the time of diagnosis and worse outcomes than
nondiabetic subjects [2,3]. Indeed, the CAD mortality rate af- ter the first myocardial infarction is two to four times higher in patients with diabetes than in those without [3]. Therefore, development of screening approaches for the early detection of CAD is warranted in patients with type 2 diabetes.
Coronary computed tomographic angiography (CCTA) is a rapidly evolving noninvasive method for evaluating CAD and http://dx.doi.org/10.4093/dmj.2015.39.5.414
pISSN 2233-6079 · eISSN 2233-6087
is currently considered to be a reliable alternative to conven- tional coronary angiography [4,5]. However, radiation expo- sure, the use of iodinated contrast agents, and the high cost all limit its use as a screening tool for CAD in asymptomatic pa- tients. Additionally, CCTA is currently not recommended for the routine diagnosis of CAD in asymptomatic patients with di- abetes [6]. Thus, identifying the subgroup of patients who might benefit from CCTA could be important in clinical practice.
Bilirubin, the end product of heme catabolism, is derived primarily from circulating hemoglobin [7]. Although bilirubin has long been considered a waste product, it is currently recog- nized as a potent endogenous antioxidant. A growing number of epidemiological studies report a negative association be- tween serum bilirubin levels and the prevalence of CAD [8-10].
Recently, a large prospective study of primary care patients with no previous history of CAD demonstrated that the serum bilirubin level is an independent risk factor for CAD events and all-cause death [11]. Therefore, much attention has been focused on the potential role of serum bilirubin as a predictive or prognostic marker for CAD in clinical practice. However, the potential role of the serum bilirubin level in identifying pa- tients with obstructive CAD has not been investigated in as- ymptomatic patients with type 2 diabetes.
Here, we used CCTA to examine whether serum total biliru- bin levels are independently associated with coronary artery ste- nosis in asymptomatic patients with type 2 diabetes and asked whether this biochemical marker may help to identify a sub- group of patients at increased risk for obstructive CAD.
METHODS
Study population
Four hundred seventy-eight consecutive asymptomatic patients with type 2 diabetes who visited the diabetes clinic at the Asan Medical Center between October 2009 and December 2010 were enrolled in the study. All patients underwent 64-slice du- al-source multi-detector computed tomography (MDCT) for CCTA. The exclusion criteria were as follows: chest pain or an- gina-equivalent symptoms, as determined using the Rose angi- na questionnaire; abnormal findings on a resting electrocardio- gram, including pathological Q waves, ischemic (≥1 mm de- pression) ST segments, deep negative T waves, or complete left bundle branch block; a previous history of myocardial infarc- tion/angina or percutaneous coronary intervention/coronary artery bypass grafting; ventricular or supraventricular arrhyth-
mia; an estimated glomerular filtration rate (eGFR) <60 mL/
min/1.73 m2; and a previous history of allergies to iodinated contrast agents. This study was originally designed to identify potential risk factors for obstructive CAD in asymptomatic pa- tients with type 2 diabetes. An initial evaluation of this popula- tion is published elsewhere [12]. For the present analysis, 18 patients with chronic liver disease were also excluded: 16 with positive hepatitis B surface antigen and 2 with positive hepatitis C antibodies. Therefore, a total of 460 patients were included in the final analysis. All patients provided written informed con- sent. The study protocol was approved by the Institutional Re- view Board of the Asan Medical Center.
Clinical and biochemical assessment
Basic demographic data were obtained through personal inter- views. All patients were asked about their history of angina, myocardial infarction, revascularization, concomitant noncar- diac comorbidities, age at diagnosis of diabetes, smoking and drinking habits, and current medication profiles. The data were confirmed by a review of their medical records. Type 2 diabetes was diagnosed according to the Report of the Expert Commit- tee on the Diagnosis and Classification of Diabetes Mellitus [13]. Hypertension was defined as a blood pressure ≥140/90 mm Hg or the use of antihypertensive medications. Smoking habits were defined as smoking currently or having stopped smoking within 1 year of the interview.
The body mass index (BMI) was calculated as weight in kilo- grams divided by the square root of the height in meters. Blood pressure was measured on the right arm after a ≥5-minute rest using an automatic manometer fitted with an appropriate size cuff. Blood samples were obtained after a fast of at least 12 hours. Serum total bilirubin levels were measured by the vana- date oxidation method using the Toshiba 200FR (Toshiba, To- kyo, Japan). The levels of total cholesterol, low density lipopro- tein cholesterol (LDL-C), high density lipoprotein cholesterol (HDL-C), aspartate aminotransferase (AST), alanine amino- transferase (ALT), and triglycerides were determined by an en- zymatic colorimetric method using the Toshiba 200FR. The se- rum creatinine levels were measured by the quantitative capil- lary photometry method using the TEST 1 automated analyzer (Alifax SpA, Polverara, Italy). The glycosylated hemoglobin (HbA1c) levels were determined by ion-exchange high-perfor- mance liquid chromatography using the Variant II automated analyzer (Bio-Rad Laboratories, Hercules, CA, USA). The eGFR was calculated using the Modification of Diet in Renal
Disease study equation [14]. A standard 12-lead electrocardio- gram was recorded on the same day that the 64-slice dual- source MDCT was performed. The presence of diabetic reti- nopathy was assessed using retinal photography performed with a wide-angle camera and scored centrally by an experi- enced ophthalmologist. The extent of albuminuria was deter- mined from the albumin-creatinine ratio in a random spot urine collection. The presence of diabetic nephropathy was de- fined as microalbuminuria (30 to 300 µg albumin/mg creati- nine) or overt albuminuria (>300 µg albumin/mg creatinine) in the absence of other conditions capable of causing protein- uria. The Framingham Risk Score (FRS) for estimating the 10- year risk for coronary heart disease was calculated based on age, sex, total cholesterol and HDL-C levels, blood pressure, smoking status, and history of diabetes [15].
Evaluation of coronary stenosis and plaque morphology For all eligible patients, coronary artery calcium (CAC) mea- surements were followed immediately by CCTA using a 64-slice dual-source MDCT scanner (Somatom Definition, Siemens Medical Solutions, Erlangen, Germany). Patients with baseline heart rates >85 beats per minute were given oral β-blockers be- fore CCTA imaging. Each patient was also given 0.6 mg of ni- troglycerin sublingually 1 minute before image acquisition. A standard scanning protocol was applied with 2×32×0.6 mm collimation, 64-slice acquisition per rotation, 330 ms rotation time, 100 to 120 kVp tube voltage, and 250 to 380 mAs/rot tube current according to the patient’s body habitus. All scans were performed using electrocardiogram-gated dose modula- tion. A bolus of 60 to 80 mL of iomeprol (Iomeron 400; Brac- co, Milan, Italy) was intravenously injected (4 to 5 mL/sec), followed by 50 mL of saline chaser. A region of interest was lo- cated in the ascending aorta, and image acquisition was auto- matically initiated once a selected threshold (120 Hounsfield units [HU]) had been reached with bolus tracking. Each pa- tient’s electrocardiogram was simultaneously recorded to al- low for retrospective segmental data reconstruction. The im- ages were initially reconstructed at the mid-diastolic phase (75% of the R-R interval) of the cardiac cycle.
All scans were analyzed on a 3-dimensional workstation (Syngo Workstation; Siemens Medical Solutions). An experi- enced radiologist who was blinded to the patients’ clinical in- formation calculated the CAC scores according to the Agatston method [16]. All coronary computed tomography angiograms were interpreted by two experienced radiologists who were
blinded to the patients’ clinical information and CAC scores and who reached a decision by consensus. Each lesion was identified using a multiplanar reconstruction technique and the maximum intensity projection of short-axis, two-chamber, and four-chamber views. Coronary artery stenosis and plaque characteristics were analyzed on a per-segment basis according to the classification of the American Heart Association criteria [17]. The contrast-enhanced portion of the coronary lumen was semi-automatically traced at the maximal stenotic site and compared with the mean values for the proximal and distal ref- erence sites. Obstructive CAD was defined as ≥50% diameter stenosis in at least one coronary artery. Plaques were defined as structures >1 mm2 within and/or adjacent to the vessel lumen.
Plaques consisting of calcified tissue occupying more than 50%
of the plaque area (density >130 HU in native scans) were clas- sified as calcified plaques, plaques with <50% calcium were classified as mixed plaques, and plaques without any calcium were classified as noncalcified plaques.
Statistical analysis
Continuous variables showing a normal distribution are ex- pressed as the mean±standard deviation, continuous variables showing a skewed distribution are expressed as the median (and interquartile range), and categorical variables are expressed as percentages (%). The study population was divided into the fol- lowing tertiles according to serum total bilirubin levels: T1 (<12 μmol/L), T2 (12 to 17 μmol/L), and T3 (>17 μmol/L). The clin- ical and biochemical characteristics according to the tertiles of serum total bilirubin levels were compared using analysis of variance for continuous variables and the chi-square trend test for categorical variables. The presence of any plaque subtype (calcified, mixed, or noncalcified) was analyzed on a per-patient basis. Multivariate logistic regression analyses were used to cal- culate the odds ratios of serum total bilirubin level as a group or continuous variable to predict the presence of obstructive CAD, a CAC score ≥400, or different plaque subtypes. To compare the abilities of the FRS plus serum total bilirubin level and FRS alone to predict obstructive CAD, receiver operating character- istic (ROC) curves were plotted and the area under the curve (AUC) calculated. MedCalc version 11.6.1.0 (MedCalc Soft- ware, Mariakerke, Belgium) was used to compare AUC values.
All other statistical analyses were performed using SPSS version 14.0 (SPSS Inc., Chicago, IL, USA). A P<0.05 was considered statistically significant.
RESULTS
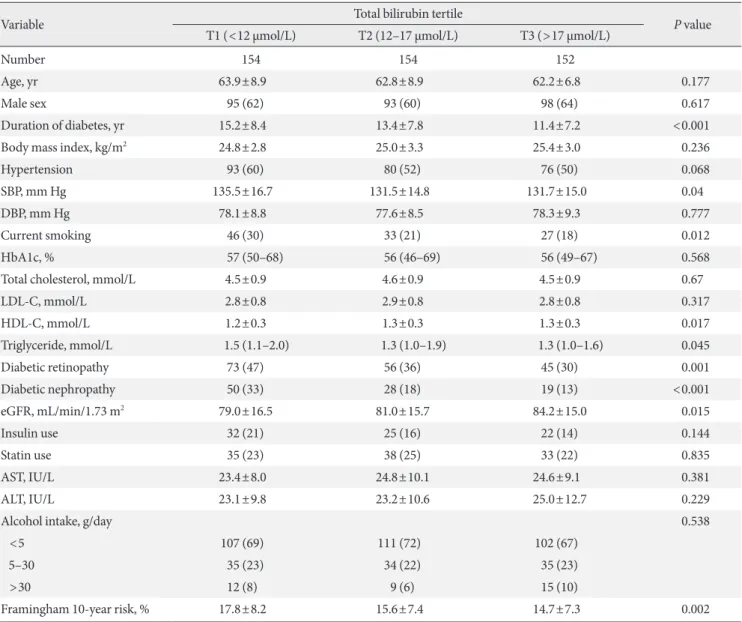
Clinical and biochemical characteristics of the study population according to serum total bilirubin tertiles The study population was composed of 460 asymptomatic pa- tients with type 2 diabetes and no history of CAD (age, 63.0±8.3 years; duration of diabetes, 13.3±7.9 years; 62% male). A longer duration of diabetes (P<0.001), higher systolic blood pressure (P=0.040), current smoking (P=0.012), diabetic retinopathy (P=0.001), diabetic nephropathy (P<0.001), lower level of
HDL-C (P=0.017), higher level of triglycerides (P=0.045), low- er eGFR (P=0.015), and higher FRS (P=0.002) were each sig- nificantly associated with lower total bilirubin tertiles (Table 1).
The prevalence of hypertension tended to decrease across the total bilirubin tertiles; however, the statistical significance was marginal (P=0.068). There were no significant differences in age, male gender, BMI, diastolic blood pressure, levels of HbA1c, total cholesterol, LDL-C, AST, and ALT, current use of insulin and statins, or alcohol consumption among the groups.
Table 1. Clinical and biochemical characteristics of the study population according to serum total bilirubin tertiles
Variable Total bilirubin tertile
P value T1 (<12 μmol/L) T2 (12–17 μmol/L) T3 (>17 μmol/L)
Number 154 154 152
Age, yr 63.9±8.9 62.8±8.9 62.2±6.8 0.177
Male sex 95 (62) 93 (60) 98 (64) 0.617
Duration of diabetes, yr 15.2±8.4 13.4±7.8 11.4±7.2 <0.001
Body mass index, kg/m2 24.8±2.8 25.0±3.3 25.4±3.0 0.236
Hypertension 93 (60) 80 (52) 76 (50) 0.068
SBP, mm Hg 135.5±16.7 131.5±14.8 131.7±15.0 0.04
DBP, mm Hg 78.1±8.8 77.6±8.5 78.3±9.3 0.777
Current smoking 46 (30) 33 (21) 27 (18) 0.012
HbA1c, % 57 (50–68) 56 (46–69) 56 (49–67) 0.568
Total cholesterol, mmol/L 4.5±0.9 4.6±0.9 4.5±0.9 0.67
LDL-C, mmol/L 2.8±0.8 2.9±0.8 2.8±0.8 0.317
HDL-C, mmol/L 1.2±0.3 1.3±0.3 1.3±0.3 0.017
Triglyceride, mmol/L 1.5 (1.1–2.0) 1.3 (1.0–1.9) 1.3 (1.0–1.6) 0.045
Diabetic retinopathy 73 (47) 56 (36) 45 (30) 0.001
Diabetic nephropathy 50 (33) 28 (18) 19 (13) <0.001
eGFR, mL/min/1.73 m2 79.0±16.5 81.0±15.7 84.2±15.0 0.015
Insulin use 32 (21) 25 (16) 22 (14) 0.144
Statin use 35 (23) 38 (25) 33 (22) 0.835
AST, IU/L 23.4±8.0 24.8±10.1 24.6±9.1 0.381
ALT, IU/L 23.1±9.8 23.2±10.6 25.0±12.7 0.229
Alcohol intake, g/day 0.538
<5 107 (69) 111 (72) 102 (67)
5–30 35 (23) 34 (22) 35 (23)
>30 12 (8) 9 (6) 15 (10)
Framingham 10-year risk, % 17.8±8.2 15.6±7.4 14.7±7.3 0.002
Values are presented as mean±standard deviation, number (%), or median (interquartile range).
SBP, systolic blood pressure; DBP, diastolic blood pressure; HbA1c, glycosylated hemoglobin; LDL-C, low density lipoprotein cholesterol;
HDL-C, high density lipoprotein cholesterol; eGFR, estimated glomerular filtration rate; AST, aspartate aminotransferase; ALT, alanine amino- transferase.
Prevalence of obstructive CAD and coronary plaque subtypes according to serum total bilirubin tertiles
Among the 460 patients, 333 had some form of coronary ath- erosclerotic plaque and 178 had obstructive (>50% luminal
narrowing) CAD (Table 2). The prevalence of patients with ob- structive CAD significantly decreased across the total bilirubin tertiles (T1, 64%; T2, 32%; T3, 20%; P<0.001). There was also a significant decrease in the extent of CAD, defined by the num- ber of stenosed vessels, across the tertiles (P<0.001). A lower total bilirubin tertile was significantly associated with a higher CAC score (P<0.001). The percentage of patients with a CAC score ≥400 showed a negative relationship with the tertile (T1, 30%; T2, 16%; T3, 3%; P<0.001). In addition, a higher total bil- irubin tertile was significantly associated with a lower preva- lence of any (T1, 84%; T2, 69%; T3, 63%; P<0.001), calcified (T1, 63%; T2, 55%; T3, 48%; P=0.009), mixed (T1, 35%; T2, 23%; T3, 16%; P<0.001), or noncalcified (T1, 49%; T2, 34%;
T3, 28%; P<0.001) plaques.
Risk for obstructive CAD according to serum total bilirubin level
As shown in Table 3, the odds ratios for obstructive CAD consis- tently showed an increasing trend across the total bilirubin ter- tiles. Serum total bilirubin level as a continuous variable was also inversely associated with the prevalence of obstructive CAD. Se- rum total bilirubin level, as both a categorical and a continuous variable, showed an independent negative relationship with ob- structive CAD after adjusting for age, gender, duration of diabe- tes, prevalence of hypertension, systolic blood pressure, diastolic blood pressure, and current smoking (model 1). These associa- Table 2. Analysis of coronary computed tomographic angiog-
raphy Variable
Total bilirubin tertile
P value (n=154)T1 T2
(n=154) T3
(n=152) Obstructive coronary
artery disease 98 (64) 49 (32) 31 (20) <0.001
No. of stenosed <0.001
1-Vessel disease 39 (25) 28 (18) 17 (11) 2-Vessel disease 30 (19) 11 (7) 10 (7) 3-Vessel disease 29 (19) 9 (6) 4 (3) Coronary artery
calcium score 129 (0–519) 26 (0–145) 7 (0–100) <0.001 Coronary artery
calcium score ≥400 46 (30) 24 (16) 5 (3) <0.001 Plaques (per patient)
Any plaque 130 (84) 107 (69) 96 (63) <0.001 Calcified plaque 97 (63) 84 (55) 73 (48) 0.009 Mixed plaque 54 (35) 35 (23) 25 (16) <0.001 Noncalcified plaque 76 (49) 53 (34) 42 (28) <0.001 Values are presented as number (%) or median (interquartile range).
Table 3. Odds ratios (95% confidence interval) for obstructive coronary artery disease according to serum total bilirubin level as a categorical or continuous variable after adjustments for confounding variables
Variable T1 (n=154) T2 (n=154) T3 (n=152) P value
Tertiles of serum total bilirubin
Unadjusted 1 0.489 (0.310–0.771) 0.210 (0.126–0.350) <0.001
Model 1 1 0.531 (0.331–0.851) 0.222 (0.130–0.379) <0.001
Model 2 1 0.530 (0.327–0.858) 0.224 (0.130–0.388) <0.001
Model 3 1 0.529 (0.324–0.865) 0.227 (0.130–0.398) <0.001
Serum total bilirubin (μmol/L)
Unadjusted 0.854 (0.808–0.903) <0.001
Model 1 0.859 (0.811–0.909) <0.001
Model 2 0.862 (0.812–0.914) <0.001
Model 3 0.864 (0.814–0.918) <0.001
Model 1: adjusted for age, gender, duration of diabetes, hypertension, systolic blood pressure, diastolic blood pressure, and current smoking.
Model 2: adjusted for all of the variables in model 1 plus body mass index, glycosylated hemoglobin, low density lipoprotein cholesterol, high density lipoprotein cholesterol, and triglycerides. Model 3: adjusted for all of the variables in model 2 plus diabetic retinopathy and nephropa- thy, estimated glomerular filtration rate, current use of insulin and a statin, aspartate aminotransferase, alanine aminotransferase, and alcohol intake.
tions remained significant even after adjusting for BMI, HbA1c, LDL-C, HDL-C, and triglycerides (model 2). Further adjust- ment for the prevalence of diabetic retinopathy and nephropa- thy, eGFR, current use of insulin and statins, AST, ALT, and al- cohol intake did not significantly affect the results (model 3). In multivariate logistic regression model 3, the odds ratio for the highest versus the lowest tertile of total bilirubin was 0.227 (95%
confidence interval [CI], 0.130 to 0.398), and an increment of 1 μmol/L in serum total bilirubin level was associated with a 14.6% reduction in the incidence of obstructive CAD.
Risk associated with a CAC score ≥400 and with each plaque subtype according to serum total bilirubin level As a function of the serum total bilirubin level, the odds ratio for a CAC score ≥400 was 0.718 (95% CI, 0.641 to 0.804; P<
0.001) after full adjustment (Table 4). An elevated serum total bilirubin level also appeared to show an independent negative relationship with the presence of a calcified plaque but did not reach statistical significance (odds ratio, 0.955; 95% CI, 0.901 to 1.011; P=0.114). In addition, the odds ratio for the presence of mixed and noncalcified plaques was 0.886 (95% CI, 0.829 to 0.948; P<0.001) and 0.916 (95% CI, 0.867 to 0.969; P=0.002) after full adjustment, respectively (Table 4).
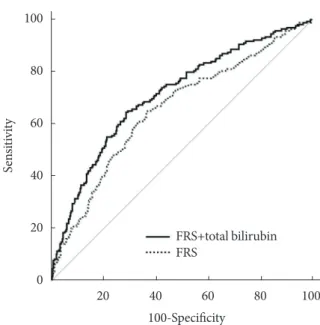
Comparison of the predictive ability of the FRS alone and FRS plus serum total bilirubin level
ROC curve analysis revealed that the AUC for FRS plus serum total bilirubin level was 0.712 (95% CI, 0.668 to 0.753), which was significantly greater than that of the FRS alone (AUC, 0.654;
95% CI, 0.609 to 0.698; P=0.0028) (Fig. 1).
Table 4. Odds ratios (95% confidence interval) for the pres- ence of coronary artery calcium score ≥400 and calcified, mixed, or noncalcified plaques according to serum total bili- rubin level as a continuous variable after adjustments for con- founding variables
Variable Serum total bilirubin (μmol/L) P value CAC score ≥400
Unadjusted 0.771 (0.707–0.842) <0.001
Model 1 0.761 (0.690–0.840) <0.001
Model 2 0.735 (0.661–0.817) <0.001
Model 3 0.718 (0.641–0.804) <0.001
Calcified plaque
Unadjusted 0.943 (0.900–0.988) 0.014
Model 1 0.957 (0.908–1.010) 0.108
Model 2 0.952 (0.901–1.007) 0.086
Model 3 0.955 (0.901–1.011) 0.114
Mixed plaque
Unadjusted 0.880 (0.828–0.935) <0.001
Model 1 0.878 (0.825–0.936) <0.001
Model 2 0.887 (0.832–0.947) <0.001
Model 3 0.886 (0.829–0.948) <0.001
Noncalcified plaque
Unadjusted 0.902 (0.857–0.950) <0.001
Model 1 0.911 (0.864–0.961) 0.001
Model 2 0.917 (0.869–0.969) 0.002
Model 3 0.916 (0.867–0.969) 0.002
Model 1: adjusted for age, gender, duration of diabetes, hypertension, systolic blood pressure, diastolic blood pressure, and current smok- ing. Model 2: adjusted for all of the variables in model 1 plus body mass index, glycosylated hemoglobin, low density lipoprotein choles- terol, high density lipoprotein cholesterol, and triglycerides. Model 3:
adjusted for all of the variables in model 2 plus diabetic retinopathy and nephropathy, estimated glomerular filtration rate, current use of insulin and statin, aspartate aminotransferase, alanine aminotrans- ferase, and alcohol intake.
100 80 60 40 20 0
Sensitivity
20 40 60 80 100 100-Specificity
FRS+total bilirubin FRS
Fig. 1. Receiver operating characteristic curves showing the ability of the Framingham risk score (FRS) alone or the FRS plus serum total bilirubin level to predict obstructive coronary artery disease. The area under the curve for the FRS plus se- rum total bilirubin level was 0.712 (95% confidence interval [CI], 0.668 to 0.753), significantly greater than that of the FRS alone (area under the curve, 0.654; 95% CI, 0.609 to 0.698).
P=0.0028 for the comparison between the two areas.
DISCUSSION
Here, we examined whether serum total bilirubin levels can be used as a marker for identifying subjects with obstructive CAD among asymptomatic patients with type 2 diabetes. We found that serum total bilirubin tertiles were inversely associated with the prevalence of obstructive CAD as assessed by CCTA and that serum total bilirubin levels provided additional risk infor- mation over the FRS.
Accumulating evidence has shown that serum bilirubin lev- els are negatively associated with a prevalence of various dis- eases [10]. Indeed, serum bilirubin makes the largest contribu- tion to total antioxidant capacity within the circulation [7].
Thus, serum bilirubin may be an important protective factor against oxidative damage, preventing the development and progression of oxidative stress-mediated diseases such as CAD.
Indeed, several animal studies have shown that bilirubin treat- ment protects against vascular complications [18,19]. Oxida- tive stress also plays a major role in the pathogenesis of diabe- tes and its associated complications [20]. A recent Japanese population-based study showed that the serum bilirubin level is inversely associated with the prevalence of diabetic retinopa- thy [21]. Fukui et al. [22] also reported a negative correlation between serum bilirubin levels and microalbuminuria and ar- terial stiffness. Furthermore, accumulating evidence consis- tently shows that lower serum bilirubin levels are associated with a higher risk of CAD [8-11]. However, most of these stud- ies were performed using subjects without diabetes, and it has not been verified whether serum bilirubin can serve as a useful biochemical marker for identifying asymptomatic patients with type 2 diabetes at higher risk for obstructive CAD. The cohort examined in the present study was composed exclu- sively of asymptomatic patients with type 2 diabetes. The re- sults showed that serum bilirubin levels are negatively associ- ated with obstructive CAD in patients with type 2 diabetes.
Oxidative stress plays an essential role in the pathogenesis of atherosclerosis [23]. Specifically, lipid oxidation enhances foam cell formation through oxidized LDL formation and uptake.
Importantly, serum bilirubin prevents LDL oxidation more ef- ficiently than other endogenous antioxidants [24]. Therefore, serum bilirubin may protect against atherosclerosis by pre- venting LDL oxidation. On the other hand, there was no asso- ciation between serum bilirubin level and LDL-C level, sug- gesting that bilirubin’s protective effect is not due to the lower- ing of the LDL-C level.
It is suggested that the presence and extent of calcified plaques in coronary arteries are independently associated with CAD events and that taking this into account can increase the predictive power of traditional cardiovascular risk factors in asymptomatic diabetic patients [25]. On the other hand, mixed or noncalcified plaques are thought to be more vulnerable to rupture, which can result in an acute coronary event [26]. Re- cently, Canpolat et al. reported on the association of serum to- tal bilirubin levels and plaque morphology in Turkish patients suspected to have CAD [27]. They found that serum total bili- rubin levels were inversely associated with the presence and ex- tent of noncalcified plaques but not calcified and mixed plaques.
By contrast, a recent cross-sectional studies conducted in a Ko- rean population reported that serum total bilirubin level was in- versely associated with the presence of calcified plaques [28].
Here, we found a significant and inverse relationship between serum total bilirubin levels and the presence of mixed or non- calcified plaques. In addition, the serum total bilirubin levels were negatively associated with a CAC score ≥400 but not the presence of calcified plaques. The discrepancy between our study and the previously mentioned studies may be explained by differences in the study populations, including ethnicity and the presence/absence of diabetes or CAD symptoms.
Assessing the risk for CAD in asymptomatic patients with type 2 diabetes is an important challenge for clinicians. In 1998, the American Diabetes Association recommended CAD screening for diabetic patients with multiple CAD risk factors [29]. However, subsequent studies demonstrated that an ap- proach guided by the number of CAD risk factors is not suc- cessful for the early detection of CAD in diabetic patients be- cause patients with fewer risk factors frequently present with CAD [30]. In addition, when applied to CAD risk assessments in asymptomatic diabetic patients, the effectiveness of predic- tive models such as the FRS is modest [31]. The present study shows that the serum total bilirubin levels provide additive risk information over the FRS and that this may help to identi- fy asymptomatic patients with type 2 diabetes at higher risk for having obstructive CAD.
This study has several limitations. First, the cross-sectional nature of this study did not allow a causal relationship to be determined. Second, this study was performed at a single uni- versity hospital in Korea. There are considerable ethnic genetic differences in bilirubin metabolism between Asian and Cau- casian populations [32]. Therefore, our results may not be ap- plicable to other ethnic groups. Third, an elevated serum total
bilirubin level indicates liver damage, and it may therefore be significantly affected by underlying liver diseases. Here, we ex- cluded patients with known chronic liver diseases. In addition, we adjusted the results of liver function tests such as AST and ALT to rule out the residual confounding effect of unrecognized underlying diseases. Fourth, in several cross-sectional studies, serum total bilirubin level was found to be negatively associated with the prevalence of ischemic stroke or peripheral arterial dis- ease [33,34]. We cannot exclude the possibility that such under- lying conditions affected our analysis in evaluating the relation- ship between serum total bilirubin level and CAD because they were not included in our exclusion criteria and the information about them was not collected carefully. Finally, serum direct and indirect bilirubin levels seem to be different in their anti-in- flammatory and antioxidant activities [35]. A recent study re- ported that direct bilirubin levels are positively correlated with CAD severity assessed by the Gensini score, whereas there is no association between total bilirubin levels and CAD severity [36]. In the present study, we did not measure serum direct bili- rubin levels. Future studies are required for evaluating the rela- tionship between serum direct bilirubin level and CAD.
Our findings suggest that serum total bilirubin levels are neg- atively associated with obstructive CAD among asymptomatic patients with type 2 diabetes. Furthermore, serum total biliru- bin levels provide risk information additional to that provided by the FRS. Serum bilirubin assays are inexpensive and widely available. Therefore, the serum total bilirubin may be helpful for identifying asymptomatic patients with type 2 diabetes at in- creased risk for having obstructive CAD and who require more aggressive screening using CCTA.
CONFLICTS OF INTEREST
No potential conflict of interest relevant to this article was re- ported.
ACKNOWLEDGMENTS
This research was supported by the National Research Foun- dation of Korea funded by the Ministry of Education, Science and Technology (2006-2005412 and 2009-0091988: K.U.L.).
REFERENCES
1. Jouven X, Lemaitre RN, Rea TD, Sotoodehnia N, Empana JP,
Siscovick DS. Diabetes, glucose level, and risk of sudden cardi- ac death. Eur Heart J 2005;26:2142-7.
2. Pundziute G, Schuijf JD, Jukema JW, van Werkhoven JM, Nuci- fora G, Decramer I, Sarno G, Vanhoenacker PK, Reiber JH, Wi- jns W, Bax JJ. Type 2 diabetes is associated with more advanced coronary atherosclerosis on multislice computed tomography and virtual histology intravascular ultrasound. J Nucl Cardiol 2009;16:376-83.
3. Miettinen H, Lehto S, Salomaa V, Mahonen M, Niemela M, Haffner SM, Pyorala K, Tuomilehto J. Impact of diabetes on mortality after the first myocardial infarction. The FINMONI- CA Myocardial Infarction Register Study Group. Diabetes Care 1998;21:69-75.
4. Budoff MJ, Dowe D, Jollis JG, Gitter M, Sutherland J, Halamert E, Scherer M, Bellinger R, Martin A, Benton R, Delago A, Min JK. Diagnostic performance of 64-multidetector row coronary computed tomographic angiography for evaluation of coro- nary artery stenosis in individuals without known coronary artery disease: results from the prospective multicenter AC- CURACY (Assessment by Coronary Computed Tomographic Angiography of Individuals Undergoing Invasive Coronary Angiography) trial. J Am Coll Cardiol 2008;52:1724-32.
5. Moon JS, Yoon JS, Won KC, Cho IH, Lee HW. Diagnostic ac- curacy of 64-slice MDCT coronary angiography for the assess- ment of coronary artery disease in Korean patients with type 2 diabetes. Diabetes Metab J 2013;37:54-62.
6. Taylor AJ, Cerqueira M, Hodgson JM, Mark D, Min J, O’Gara P, Rubin GD; American College of Cardiology Foundation Appro- priate Use Criteria Task Force; Society of Cardiovascular Com- puted Tomography; American College of Radiology; American Heart Association; American Society of Echocardiography;
American Society of Nuclear Cardiology; North American Soci- ety for Cardiovascular Imaging; Society for Cardiovascular Angi- ography and Interventions; Society for Cardiovascular Magnetic Resonance, Kramer CM, Berman D, Brown A, Chaudhry FA, Cury RC, Desai MY, Einstein AJ, Gomes AS, Harrington R, Hoff- mann U, Khare R, Lesser J, McGann C, Rosenberg A, Schwartz R, Shelton M, Smetana GW, Smith SC Jr. ACCF/SCCT/ACR/
AHA/ASE/ASNC/NASCI/SCAI/SCMR 2010 appropriate use criteria for cardiac computed tomography. A report of the Amer- ican College of Cardiology Foundation Appropriate Use Criteria Task Force, the Society of Cardiovascular Computed Tomogra- phy, the American College of Radiology, the American Heart As- sociation, the American Society of Echocardiography, the Amer- ican Society of Nuclear Cardiology, the North American Society
for Cardiovascular Imaging, the Society for Cardiovascular An- giography and Interventions, and the Society for Cardiovascular Magnetic Resonance. J Am Coll Cardiol 2010;56:1864-94.
7. Vitek L. The role of bilirubin in diabetes, metabolic syndrome, and cardiovascular diseases. Front Pharmacol 2012;3:55.
8. Schwertner HA, Jackson WG, Tolan G. Association of low se- rum concentration of bilirubin with increased risk of coronary artery disease. Clin Chem 1994;40:18-23.
9. Djousse L, Levy D, Cupples LA, Evans JC, D’Agostino RB, Elli- son RC. Total serum bilirubin and risk of cardiovascular dis- ease in the Framingham offspring study. Am J Cardiol 2001;
87:1196-200.
10. Novotny L, Vitek L. Inverse relationship between serum biliru- bin and atherosclerosis in men: a meta-analysis of published studies. Exp Biol Med (Maywood) 2003;228:568-71.
11. Horsfall LJ, Nazareth I, Petersen I. Cardiovascular events as a function of serum bilirubin levels in a large, statin-treated co- hort. Circulation 2012;126:2556-64.
12. Leem J, Hee Koh E, Jeong E, Jang JE, Lee SW, Kang JW, Lim TH, Lee WJ, Kim MS, Park JY, Lee KU. Prevalence of angiographi- cally defined obstructive coronary artery disease in asymptom- atic patients with type 2 diabetes according to the coronary cal- cium score. Intern Med 2012;51:3017-23.
13. Expert Committee on the Diagnosis and Classification of Dia- betes Mellitus. Report of the expert committee on the diagno- sis and classification of diabetes mellitus. Diabetes Care 2003;
26 Suppl 1:S5-20.
14. Levey AS, Coresh J, Greene T, Stevens LA, Zhang YL, Hendrik- sen S, Kusek JW, Van Lente F; Chronic Kidney Disease Epide- miology Collaboration. Using standardized serum creatinine values in the modification of diet in renal disease study equa- tion for estimating glomerular filtration rate. Ann Intern Med 2006;145:247-54.
15. Wilson PW, D’Agostino RB, Levy D, Belanger AM, Silbershatz H, Kannel WB. Prediction of coronary heart disease using risk factor categories. Circulation 1998;97:1837-47.
16. Agatston AS, Janowitz WR, Hildner FJ, Zusmer NR, Viamonte M Jr, Detrano R. Quantification of coronary artery calcium us- ing ultrafast computed tomography. J Am Coll Cardiol 1990;
15:827-32.
17. Austen WG, Edwards JE, Frye RL, Gensini GG, Gott VL, Griffith LS, McGoon DC, Murphy ML, Roe BB. A reporting system on patients evaluated for coronary artery disease. Report of the Ad Hoc Committee for Grading of Coronary Artery Disease, Coun- cil on Cardiovascular Surgery, American Heart Association.
Circulation 1975;51(4 Suppl):5-40.
18. Ollinger R, Yamashita K, Bilban M, Erat A, Kogler P, Thomas M, Csizmadia E, Usheva A, Margreiter R, Bach FH. Bilirubin and biliverdin treatment of atherosclerotic diseases. Cell Cycle 2007;6:39-43.
19. Boon AC, Bulmer AC, Coombes JS, Fassett RG. Circulating bilirubin and defense against kidney disease and cardiovascular mortality: mechanisms contributing to protection in clinical investigations. Am J Physiol Renal Physiol 2014;307:F123-36.
20. Sasaki S, Inoguchi T. The role of oxidative stress in the patho- genesis of diabetic vascular complications. Diabetes Metab J 2012;36:255-61.
21. Yasuda M, Kiyohara Y, Wang JJ, Arakawa S, Yonemoto K, Doi Y, Ninomiya T, Ishibashi T. High serum bilirubin levels and di- abetic retinopathy: the Hisayama Study. Ophthalmology 2011;
118:1423-8.
22. Fukui M, Tanaka M, Shiraishi E, Harusato I, Hosoda H, Asano M, Hasegawa G, Nakamura N. Relationship between serum bilirubin and albuminuria in patients with type 2 diabetes.
Kidney Int 2008;74:1197-201.
23. Stocker R, Keaney JF Jr. Role of oxidative modifications in ath- erosclerosis. Physiol Rev 2004;84:1381-478.
24. Sedlak TW, Saleh M, Higginson DS, Paul BD, Juluri KR, Snyder SH. Bilirubin and glutathione have complementary antioxidant and cytoprotective roles. Proc Natl Acad Sci U S A 2009;106:
5171-6.
25. Elkeles RS, Godsland IF, Feher MD, Rubens MB, Roughton M, Nugara F, Humphries SE, Richmond W, Flather MD; PREDICT Study Group. Coronary calcium measurement improves predic- tion of cardiovascular events in asymptomatic patients with type 2 diabetes: the PREDICT study. Eur Heart J 2008;29:2244-51.
26. Pundziute G, Schuijf JD, Jukema JW, Decramer I, Sarno G, Vanhoenacker PK, Boersma E, Reiber JH, Schalij MJ, Wijns W, Bax JJ. Evaluation of plaque characteristics in acute coronary syndromes: noninvasive assessment with multi-slice comput- ed tomography and invasive evaluation with intravascular ul- trasound radiofrequency data analysis. Eur Heart J 2008;29:
2373-81.
27. Canpolat U, Aytemir K, Yorgun H, Hazirolan T, Kaya EB, Sa- hiner L, Sunman H, Tokgozoglu L, Kabakci G, Oto A. Associa- tion of serum total bilirubin levels with the severity, extent and subtypes of coronary atherosclerotic plaques detected by coro- nary CT angiography. Int J Cardiovasc Imaging 2013;29:1371-9.
28. Kang SJ, Kim D, Park HE, Chung GE, Choi SH, Choi SY, Lee W, Kim JS, Cho SH. Elevated serum bilirubin levels are in-
versely associated with coronary artery atherosclerosis. Ath- erosclerosis 2013;230:242-8.
29. Consensus development conference on the diagnosis of coro- nary heart disease in people with diabetes: 10-11 February 1998, Miami, Florida. American Diabetes Association. Diabe- tes Care 1998;21:1551-9.
30. Scognamiglio R, Negut C, Ramondo A, Tiengo A, Avogaro A.
Detection of coronary artery disease in asymptomatic patients with type 2 diabetes mellitus. J Am Coll Cardiol 2006;47:65-71.
31. Guzder RN, Gatling W, Mullee MA, Mehta RL, Byrne CD.
Prognostic value of the Framingham cardiovascular risk equa- tion and the UKPDS risk engine for coronary heart disease in newly diagnosed type 2 diabetes: results from a United King- dom study. Diabet Med 2005;22:554-62.
32. Kang TW, Kim HJ, Ju H, Kim JH, Jeon YJ, Lee HC, Kim KK, Kim JW, Lee S, Kim JY, Kim SY, Kim YS. Genome-wide asso-
ciation of serum bilirubin levels in Korean population. Hum Mol Genet 2010;19:3672-8.
33. Perlstein TS, Pande RL, Creager MA, Weuve J, Beckman JA. Se- rum total bilirubin level, prevalent stroke, and stroke outcomes:
NHANES 1999-2004. Am J Med 2008;121:781-8.
34. Perlstein TS, Pande RL, Beckman JA, Creager MA. Serum to- tal bilirubin level and prevalent lower-extremity peripheral ar- terial disease: National Health and Nutrition Examination Sur- vey (NHANES) 1999 to 2004. Arterioscler Thromb Vasc Biol 2008;28:166-72.
35. Wu TW, Fung KP, Wu J, Yang CC, Weisel RD. Antioxidation of human low density lipoprotein by unconjugated and conjugat- ed bilirubins. Biochem Pharmacol 1996;51:859-62.
36. Erkan A, Ekici B, Ugurlu M, Is G, Seker R, Demirtas S, Kork- maz S. The role of bilirubin and its protective function against coronary heart disease. Herz 2014;39:711-5.