사용자 민감성 자동변속 트레드밀에서의 에너지소비량
이대택1, 손윤선1, 황봉연1, 배윤정2
1국민대학교 체육대학 운동생리학실험실, 2메디플러스 솔루션
Energy Expenditure on a User Sensitive Spontaneous Speed Control Treadmill
Dae-Taek Lee1, Youn-Sun Son1, Bong-Yeon Hwang1, Yoon-Jung Bae2
1Exercise Physiology Laboratory, Department of Physical Education, Kookmin University, 2MediPlus Solution, Seoul, Korea
Background: A conventional treadmill provides manually controlled constant speed during exercise. A fast in- teractive automatic speed control treadmill (FAST), which is highly sensitive to the position of the user on the belt and spontaneously adjusts its speed accordingly, was evaluated in terms of energy expenditure (EE) dur- ing exercise.
Methods: A total of 43 subjects were recruited and assigned to one of three exercise intensity groups- low (LIG;
40-50% of VO2max), moderate (MIG; 55-65% of VO2max), and high (HIG; 70-80% of VO2max). During the first test (Test-1), each subject performed an exercise bout on the FAST while spontaneously changing their loco- motion speed within their assigned range of intensity. The average speed in Test-1 was calculated and applied to the second test (Test-2), in which the subjects exercised at a constant belt speed and matched the total travel distance of Test-1. During the tests, the oxygen uptake (VO2), heart rate (HR), respiratory quotient (RQ), oxy- gen pulse (OP), and EE of each subject were measured.
Results: The average VO2 in Test-1 was higher than that in Test-2 for both the LIG (22.95±2.55 vs. 21.72±2.90 ml/kg/min) and MIG (31.17±3.75 vs. 29.73±4.86 mL/kg/min) (P<.05) subjects. The EE in Test-1 was higher than that in Test-2 for both the LIG (7.09±1.67 vs. 6.71±1.73 kcal/min) and MIG (9.79±2.62 vs. 9.32±2.71 kcal/min) (P<.05) subjects. The HR, RQ, and OP in the LIG and the MIG were similar. There was no difference between Test-1 and Test-2 in any of the metabolic parameters for the HIG subjects.
Conclusions: The results indicated that, low- to moderate-intensity treadmill exercise at varying speeds re- quired higher energy expenditure than that at a constant speed. Thus, a treadmill with a spontaneous speed variation function may be an effective exercise modality that increases energy expenditure.
Korean J Health Promot 2015;15(1):1-8
Keywords: Energy expenditure, Exercise intensity, Speed variation, Walking, Running
■ Received:August 15, 2014 ■ Accepted:November 28, 2014
■ Corresponding author:Bong-Yeon Hwang, PhD Department of Physical Education, Kookmin University, 77 Jeongneung-ro, Seongbuk-gu, Seoul 136-702, Korea Tel: +82-2-910-5183, Fax: +82-2-910-4789 E-mail: [email protected]
■ This research was supported by the R&D Program for Society of the National Research Foundation (NRF) funded by the Ministry of Science, ICT & Future Planning (Grant number: Insung Information co. LTD - 2013M3C8A2A02078582).
INTRODUCTION
The treadmill has served as a valuable tool for scientific research, clinical rehabilitation, and physical training. The major advantages of treadmill tests over overground tests include smaller space requirements, stable speed and gra- dient control, and easy installations of useful support devices. The knowledge of human gait patterns and benefits of physical training has been vastly expanded through stud- ies using treadmills in controlled environments. However,
the treadmill has a limitation in that it does not allow for spontaneous choice of speed for natural locomotion (e.g., changing speed or direction). In addition, treadmill locomo- tion is different from overground locomotion in the reduc- tion in belt speed during the stance phase1-4) and the possible reduction in energy requirements.2) The rationale for using a treadmill to understand gait patterns, rehabilitate patients, and condition physical fitness is based on an assumption that the treadmill resembles real-life overground locomotion.
However, a treadmill does not permit real-life speed changes.
If the ultimate goal of treadmill use is to understand natural locomotion and to simulate normal human overground loco- motion (not treadmill locomotion), then closing the gap be- tween treadmill and unrestricted overground locomotion is helpful. To date, the conventional treadmill has relied mainly on manual speed control, not on spontaneous hu- man movements.
Numerous studies have examined the similarities and differences between these two locomotive modalities, treadmill vs. overground. Some have reported tempo- ral-distance differences in the locomotive patterns be- tween treadmill and overground walking5-7) and between treadmill and overground running;8,9) however, others have reported different results.2,10-14) Similarly, kinematic analyses have demonstrated conflicting outcomes be- tween treadmill and overground walking. Whereas some studies suggested that kinematic parameters are substantially greater in treadmill walking,5) others indicated small or negli- gible differences between these two modes.13,15) Two re- cent studies examined the three-dimensional ground re- action forces and reported similar joint movement pro- files between treadmill and overground walking.13,15) Muscle activities during treadmill walking and over- ground walking have been examined, with inconsistent results.11,16) Previous studies focused mainly on the differ- ences between these two modalities in a constant speed context. Although one study examined the energetics and mechanics of treadmill walking under a prescribed oscil- lating speed,17) no study has examined human responses during treadmill walking with spontaneous speed changes.
Although previous studies reported somewhat con- flicting results, it has been proposed that these two mo- dalities should not show biomechanical differences when the belt speed of the treadmill is constant.18) If this is the case, then the two modalities can be expected to have
equal metabolic energy requirements. Prior research evaluating metabolic responses suggested that treadmill walking results in lower oxygen consumption than over- ground walking19) and that treadmill running results in a lower oxygen debt than overground running.2) By contrast, Parvataneni et al12) demonstrated a higher metabolic cost in treadmill walking than in overground walking. Whereas Murray et al11) did not observe differences in the heart rate, others reported higher heart rates during treadmill walking than during overground walking.10,12)
In studies comparing treadmill vs. overground locomo- tion, investigators used a constant treadmill speed to obtain stable and reliable states of locomotion. However, humans do not walk or run at a constant speed in reality. Recently, Minetti et al20) introduced a new treadmill modality resem- bling real-life speed controls such as continuous accel- erations and decelerations according to the user's demand.
By using a system composed of a treadmill, an ultrasonic range finder, and a computer, the investigators observed the spontaneous choices of gait and speed. The instantly re- sponding treadmill appears to be a valuable tool for improv- ing physical fitness as well as for rehabilitating patients.
Recently, a treadmill that is sensitive to the user's position was developed and is available to the general public. Whereas the speed and grade of a conventional treadmill is controlled by the user or an installed program, the new treadmill can automatically sense the position of users and then increase or decrease the speed accordingly. However, this treadmill should be evaluated before its release to the public. In partic- ular, it is important to determine whether the new treadmill is different from conventional treadmills in terms of meta- bolic requirements. In this regard, the present study exam- ined whether locomotion at varying speeds over a given pe- riod of time results in different energy requirements than the conventional treadmill exercise modality (i.e., exercise at a constant speed). We hypothesized that exercise on a tread- mill at varying speeds would require a greater energy cost mainly because of the extra energy expenditure during the user’s acceleration and deceleration.
METHODS
1. Subjects
This study recruited 43 healthy young adults. They
were free of any metabolic, cardiovascular, pulmonary, orthopedic, or neurological conditions, which could lim- it their participation in the study. Each participant agreed to the informed consent procedure and all filled out a medical history form. They were randomly assigned to one of three exercise groups: 1) low-intensity (LIG; 7 men, 6 women), 2) moderate-intensity (MIG; 7 men, 7 women), and 3) high-intensity (HIG; 8 men, 8 women).
They did not modify their dietary or exercise habits prior to this study.
2. Fast interactive real time auto speed control technol- ogy treadmill (FAST)
The FAST can adjust its speed spontaneously and au- tomatically according to the relative position of the user on its belt (Frevola®, Dasan R&D, Seongnam, Korea).
The treadmill is composed of a driving and braking system, a distance sensor, a control device, and a user interface. The distance sensor, operating dynamically, is located at the center of the front panel approximately 1.2 m above the treadmill belt. The ranges of its speed and grade are 0-21 km/h and 0-15 %, respectively. The maximum rate of its acceleration and deceleration is 1.9 m/sec2.
3. Experimental design
The experiment consisted of a pre-screening session and two tests. In the pre-screening session, the physical characteristics and aerobic capacity of each subject were measured. During the first test (Test-1), each subject per- formed an exercise bout on the FAST while sponta- neously fluctuating his or her locomotion speed within the range of their assigned intensity- low, medium, or high. After the test, the total distance covered within the given time was obtained for each individual, and the aver- age speed was calculated. For the second test (Test-2), each subject exercised on the FAST at a constant speed calculated to match the distance and time recorded in Test-1. The two tests were separated by at least seven days but conducted at the same time of the day.
4. Procedures and measurements
During the pre-screening session, height and weight
were measured. The body mass index was calculated in kg/m2. The body fat content was estimated by the bio- impedance method (InBody 520, BioSpace, Seoul, Korea).
Resting heart rate was measured after at least 15 minutes of seated rest. The individual maximal aerobic capacity (VO2max) was measured by using a modified Bruce pro- tocol while the subjects breathed through the breath-by- breath gas analysis system (K4b2, CosMed Srl, Rome, Italy) until volitional exertion on the treadmill (Quinton, Q65, Quinton Instrument Co., Seattle, USA). Peak heart rate (HR) was measured using an electric HR monitor (Polar S610, Polar Electro Oy, Kempele, Finland) during the test. The results of the aerobic capacity test indicated that each subject's target range of exercise intensity met 40-50%, 55-65%, and 70-80% of VO2max for the LIG, the MIG, and the HIG, respectively. They were fami- liarized with the FAST before leaving the lab.
Approaching the front of the belt accelerated the tread- mill, and moving away from the front panel decelerated the treadmill.
At least three days after the pre-screening session, postprandial subjects abstaining from strenuous exercise and practicing habitual diet visited the laboratory. They were asked to void completely, and their urine sample was taken. Then an electric HR monitor was strapped around each subject's chest. A breathing mask connected to a meta- bolic analyzer system was adjusted to block any gas leakage.
The system was calibrated using the manufacturer-pro- vided standard gas mixture and three-liter syringe.
Once all instruments were fixed, the subjects were al- lowed to rest for approximately 10 minutes in the seated position. Then they were instructed to stand on the belt for Test-1. Before starting, they were encouraged to maintain their target range of exercise intensity through- out the duration of the test. For example, the subjects in the LIG first walked on the treadmill to reach approx- imately 40% of his or her VO2max. When the intensity was reached, the subject was notified. They were then en- couraged to reach 50% of the VO2max by either walking or running (their choice). When they reached the upper limit of intensity, they were allowed to accelerate and de- celerate the belt speed while staying within the intensity range (e.g., 40-50% VO2max). During the exercise, their oxygen uptake (VO2) was continuously monitored by the investigators, and the subjects were promptly re-
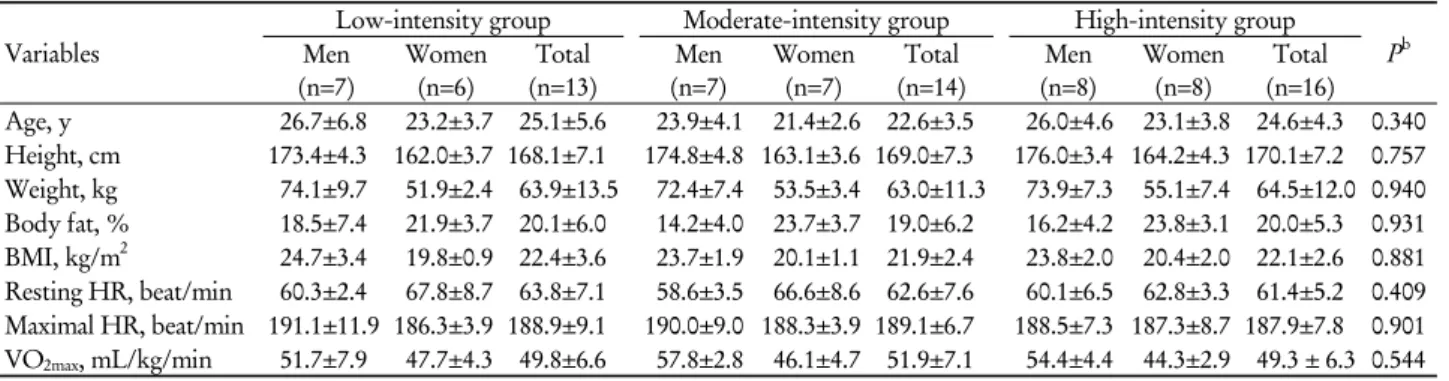
Table 1. Physical characteristics of subjectsa
Variables
Low-intensity group Moderate-intensity group High-intensity group
Pb Men
(n=7)
Women (n=6)
Total (n=13)
Men (n=7)
Women (n=7)
Total (n=14)
Men (n=8)
Women (n=8)
Total (n=16) Age, y 26.7±6.8 23.2±3.7 25.1±5.6 23.9±4.1 21.4±2.6 22.6±3.5 26.0±4.6 23.1±3.8 24.6±4.3 0.340 Height, cm 173.4±4.3 162.0±3.7 168.1±7.1 174.8±4.8 163.1±3.6 169.0±7.3 176.0±3.4 164.2±4.3 170.1±7.2 0.757 Weight, kg 74.1±9.7 51.9±2.4 63.9±13.5 72.4±7.4 53.5±3.4 63.0±11.3 73.9±7.3 55.1±7.4 64.5±12.0 0.940 Body fat, % 18.5±7.4 21.9±3.7 20.1±6.0 14.2±4.0 23.7±3.7 19.0±6.2 16.2±4.2 23.8±3.1 20.0±5.3 0.931 BMI, kg/m2 24.7±3.4 19.8±0.9 22.4±3.6 23.7±1.9 20.1±1.1 21.9±2.4 23.8±2.0 20.4±2.0 22.1±2.6 0.881 Resting HR, beat/min 60.3±2.4 67.8±8.7 63.8±7.1 58.6±3.5 66.6±8.6 62.6±7.6 60.1±6.5 62.8±3.3 61.4±5.2 0.409 Maximal HR, beat/min 191.1±11.9 186.3±3.9 188.9±9.1 190.0±9.0 188.3±3.9 189.1±6.7 188.5±7.3 187.3±8.7 187.9±7.8 0.901 VO2max, mL/kg/min 51.7±7.9 47.7±4.3 49.8±6.6 57.8±2.8 46.1±4.7 51.9±7.1 54.4±4.4 44.3±2.9 49.3 ± 6.3 0.544 Abbreviations: BMI, body mass index; HR, heart rate; VO2max, maximal oxygen consumption.
aValues are presented as mean±SD.
bTotal were analyzed by one way ANOVA.
Table 2. Range of target oxygen consumption and average speed during testsa
Low-intensity group Moderate-intensity group High-intensity group Man
(n=7)
Woman (n=6)
Total (n=13)
Man (n=7)
Woman (n=7)
Total (n=14)
Man (n=8)
Woman (n=8)
Total (n=16) Range of target VO2,
mL/kg/min
20.7±3.2 - 25.8±4.0
19.1±1.7 - 23.8±2.1
19.9±2.6 - 24.9±3.3
31.8±1.5 - 37.6±1.8
25.4±2.6 - 30.0±3.1
28.6±3.9 - 33.8±4.6
38.1±3.1 - 43.5±3.5
31.0±2.0 - 35.4±2.3
34.5±4.4 - 39.5±5.1 Average speed, km/h 6.7±0.4 6.3±0.5 6.5±0.5 8.3±0.4 7.1±0.8 7.7±0.9 10.4±0.9 7.6±1.0 9.1±1.7 Speed(min. - max.) in
Test-1, km/h
3.8±0.6 - 9.4±1.5
3.5±0.6 - 9.2±1.6
3.7±0.6 - 9.3±1.5
3.8±1.1 - 12.2±1.0
4.2±0.6 - 10.3±1.5
4.0±0.9 - 11.3±1.5
4.3±0.5 - 14.4±1.3
3.8±1.4 - 11.6±1.4
4.1±1.0 - 13.0±2.0 Abbreviation: VO2, oxygen uptake.
aValues are presented as mean±SD.
minded whenever they were out of their range. The stride length and cadence were self-selected. The test protocol was identical for all three groups. The LIG, MIG, and HIG subjects exercised for 30, 20, and 20 minutes, respectively. When the exercise bout was completed, the distance traveled within the allotted time was retrieved from the treadmill, and the average speed over the ex- ercise was calculated.
Test-2 was conducted identically to Test-1, except for exercise intensity. The subjects started their exercise in- corporating a pre-set constant speed, which was de- termined from the Test-1 results. The belt speed reached its pre-determined target within 30 sec from the start of the exercise. In this way, the total distance covered in both tests was the same. Both tests were conducted in ambient conditions of 23-28℃ and 45-58% relative humidity.
During the tests, VO2, HR, and respiratory quotient (RQ) were continuously monitored and recorded in 10-sec intervals. Energy expenditure (EE) in kcal was calculated according to the oxygen caloric equivalents estimated by the non-protein RQ. The oxygen pulse (OP) was calcu- lated as VO2 divided by HR in mL/min/beat. Urine sam-
ples were analyzed for urine specific gravity by using a digital refractometer (UG-1, ATAGO, Tokyo, Japan).
5. Justification of the testing order
The testing order could not be balanced because the walking and/or running distance within a given period of time between the two exercise modalities had to be matched. To minimize the influence of the testing order, we recruited those individuals accustomed to exercising on a treadmill, and before Test-1, they were fully fami- liarized with the FAST. In addition, the subjects were not informed of the purpose of the study and the expected outcome to eliminate psychological effects. To verify the test and re-test effects, we conducted a third trial, identi- cal to Test-2, on four randomly selected subjects. The variance of the VO2 and HR responses of Test-2 and the third trial was minimal.
6. Statistical analyses
The means and standard deviations of all measured var-
iables were determined. The physical characteristics of the subjects were analyzed by one way ANOVA. The average values of the two tests for each group were com- pared using the paired t-test. All analyses were per- formed using the SPSS 18.0 Window version(SPSS Inc., Chicago, IL, USA) and the statistical significance was considered at the 5% level.
RESULTS
Table 1 shows the physical characteristics of the subjects. Baseline physical characteristics were not sig- nificantly difference between the three groups. The base- line urine specific gravity was 1.021±0.008, 1.022±0.008, and 1.019±0.01 in Test-1 and 1.021±0.008, 1.021±0.008, and 1.02±0.008 in Test-2 for the LIG, the MIG, and the HIG, respectively (P>.05). They were considered to be euhydrated before testing.
Table 2 shows the target range of VO2 and the average belt speed in Test-1 and Test-2. At all levels of exercise intensity, men showed a higher range of target VO2 and treadmill speed than women. The speed variation in Test-1 was approximately 5.6, 7.3, and 8.9 km/h for the LIG, the MIG, and the HIG, respectively (Table 2), whereas that in Test-2 was virtually zero for all groups.
All subjects in the LIG walked in both tests, whereas those in the HIG ran in both. All of the men in MIG walked fast during Test-1, and the women in MIG walked or ran in Test-2.
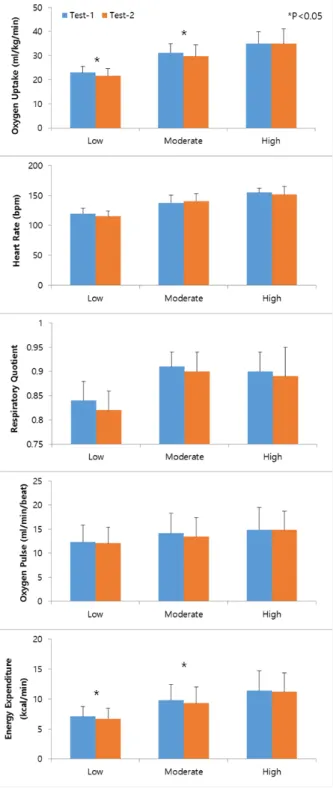
Figure 1 shows the combined VO2, HR, RQ, OP, and EE values for men and women. When the two exercise modalities were compared, VO2 and EE values were higher in Test-1 than in Test-2 for both the LIG and the MIG (P<.05). However, no difference was found in HR, RQ, and OP for both the LIG and the MIG. The average magnitude of the EE increment between the tests (the value of Test-1 minus that of Test-2) was 6.6±6.9% for LIG and 6.5±10.4% for MIG. Ten out of 13 subjects in the LIG and 11 out of 14 subjects in the MIG showed higher VO2 levels in Test-1 than in Test-2. In Test-2, no difference in metabolic parameters was observed in the HIG.
DISCUSSION
A major finding of this study is that energy ex- penditure during exercise on a treadmill with variable speeds was higher than that on a treadmill at constant speed when the distance covered over a given period of time was the same. Further, this trend was observed only when the intensity of exercise was moderate or less; no additional energy expenditure was observed when ex- ercise intensity was greater than moderate. Although sev- eral studies attempted to alter the treadmill speed21) or the oscillating speed at a regular interval,16) few evaluated the human kinetic and kinematic locomotion patterns and/or the metabolic effects of speed changes during treadmill or overground locomotion.4) To the authors' knowledge, the present study is the first to examine the metabolic ef- fects of spontaneous speed variation during treadmill exercise.
Then the question is why does exercising on a treadmill at variable speed require greater energy expenditure? It has been suggested that the energy cost of locomotion can be determined by the magnitude and rate of muscle force development required for the locomotion22,23) and the volume of actively recruited muscle fibers underlying force-generation requirements.24) The present study pro- poses that acceleration and deceleration resulting from changes in speed elevate muscular activity and that such exercise has a greater energy cost than steady walking and running. In humans, the stride frequency during walking and running is chosen in the direction of minimizing en- ergy cost.25) When subjects walk and run at a constant speed, they may incur the least amount of metabolic expenses. However, when their speed varies, they may experience a disturbance in their stride frequency, lead- ing to instability, and thus uneconomical, energy costs.
Biewener et al24) suggested that the estimated active mus- cle volume increases because of the increased inertia dur- ing an individual’s stance as the individual’s speed in- creases and gait changes. Nilsson et al26) showed that the integrated and mean and peak EMG activities gradually increased with velocity in leg muscles for both walking and running. The EMG activity pattern was relatively consistent between subjects, and the basic structure of the pattern was similar over a range of speeds, suggesting common neural control.
Figure 1. Metabolic responses and energy expenditure of three exercise intensity groups by varying and constant treadmill speed.
The results of the present study indicate that the mus- cular coordination required during acceleration and de- celeration might have been different between the two ex- ercise modes, which might have affected energy expenditure.
In addition, changes in the body posture during locomo-
tion at varying speeds may elevate energy expenditure because postural changes accompanying stride frequency can affect muscular force-generating requirements.
However, these points need to be verified.
Increases in energy expenditure during treadmill ex- ercise at varying speeds were apparent only in the low- and moderate–intensity groups, not in the high–intensity group. If the level of muscular activity is associated with treadmill velocity,26) then energy expenditure should be higher during exercise at varying speeds than at a con- stant speed at all exercise intensities. However, this was not our finding. This suggests that muscular activity peaks at the moderate-intensity level, even during steady locomotion. In other words, beyond the moderate-in- tensity exercise, accelerations and decelerations may not induce substantial and additional muscular activity.
Andersson et al27) reported no significant changes in the EMG level in the leg musculature during steady locomo- tion below 2.0 m/sec (=7.2 km/h). Because our subjects in the moderate-intensity group exercised at 7.7 km/h, they might have achieved a stage of elevated EMG activity.
Thus, beyond this speed, no additional muscular activity, by acceleration or deceleration, might have been possible.
The respiratory quotient of <8.5 during exercise in the low-intensity group indicated that no anaerobic metabo- lism was involved.28) If we assume that the daily locomo- tion speed of healthy, young adults is maintained at less than 40% of their maximal aerobic capacity,29) the results of our study demonstrate that higher intensity exercise, without involving anaerobic energy use, can increase en- ergy expenditure more than normal walking speed. On the other hand, the RQ of 0.9 for the moderate-intensity group indicates that an anaerobic threshold was reached.29) Collectively, exercising at varying speeds increases en- ergy expenditure more than that at a constant speed re- gardless of the energy metabolic pathway.
To date, the popular treadmill exercise modality for re- search, rehabilitation, and conditioning has relied on a constant belt speed. However, locomotion at a constant speed is impractical for normal walking and running.
Although the spontaneous speed control treadmill can- not provide an environment that is identical to natural, unrestricted locomotion, this modality may be closer to self-selected locomotion. From a practical point of view, future studies of energy requirements during walking
and running at varying speeds are warranted to better un- derstand the natural locomotion of humans.
The present study shows that, given the same exercise duration and distance covered, exercising on a treadmill with variable speeds leads to higher energy expenditure than on a treadmill at constant speed when exercise in- tensity was moderate or less. Both aerobic and anaerobic metabolic pathways elevated energy expenditure. Thus, a treadmill with a spontaneous speed variation function may be an effective exercise modality that increases en- ergy expenditure.
요 약
연구배경: 일반 트레드밀은 사용자가 수동적으로 운동 중 속도를 조절한다. 자동변속 트레드밀(fast interactive au- tomatic speed control treadmill, FAST)은 벨트 위에서 사 용자의 위치 변화에 높은 민감성을 나타내고 사용자의 움 직임에 따라 속도가 조절되는 트레드밀이다. 본 연구는 일 반 트레드밀과 FAST에서 운동 중 에너지 소비량의 차이를 평가하는 것이다.
방법: 43명의 대상자가 실험에 참여하였고 운동강도에 따라 3그룹(저강도[40-50% of VO2max], 중강도[55-65%
of VO2max], 고강도[70-80% of VO2max])으로 분류하였 다. Test-1에서 대상자들은 지정된 운동강도 범위 안에서 속도가 변화되는 FAST에서 운동을 했다. Test-1에서 평균 속도가 계산되어 Test-2에 동일하게 적용되었다. Test-2에 서는 Test-1의 운동거리와 고정된 속도에서 걷기 또는 달리 기 운동을 했다. 운동 중 산소섭취량, 심박수, 호흡교환율, 산소맥, 에너지소비량이 측정되었다.
결과: Test-1에서 저강도 운동그룹(22.95±2.55 vs. 21.72
±2.90 mL/kg/min)과 중강도 운동그룹(31.17±3.75 vs. 29.73
±4.86 mL/kg/min)의 평균 VO2는 Test-2와 비교하여 더 높았다(P<.05). Test-1에서 저강도 운동그룹(7.09±1.67 vs.
6.71±1.73 kcal/min)과 중강도 운동그룹(9.79±2.62 vs.
9.32±2.71 kcal/min)의 에너지소비량은 Test-2와 비교하여 더 높았다(P<.05). 저강도와 중강도 운동그룹의 심박수, 호 흡교환율과 산소맥은 유사하였다. 고강도 운동그룹은 Test-1과 Test-2 사이에서 측정변인들 간의 유의한 차이는 나타나지 않았다.
결론: 본 연구의 결과 저·중강도에서 속도가 변화되는 트 레드밀에서의 운동은 속도가 고정된 트레드밀에서의 운동 보다 에너지소비량이 더 높았다. 따라서 자동으로 속도 조 절 기능을 갖춘 트레드밀에서의 운동은 에너지소비량을 증 가시키는데 효과가 있을 것이다.
중심 단어: 에너지소비량, 운동강도, 속도변화, 걷기, 달리기
REFERENCES
1. Buchner HH, Savelberg HH, Schamhardt HC, Merkens HW, Barneveld A. Kinematics of treadmill versus overground loco- motion in horses. Vet Q 1994;16(Suppl 2):S87-90.
2. Frishberg BA. An analysis of overground and treadmill sprinting. Med Sci Sports Exerc 1983;15(6):478-85.
3. Pierrynowski MR, Winter DA, Norman RW. Transfers of me- chanical energy within the total body and mechanical efficiency during treadmill walking. Ergonomics 1980;23(2):147-56.
4. Savelberg HH, Vorstenbosch MA, Kamman EH, van de Weijer JG, Schambardt HC. Intra-stride belt-speed variation affects treadmill locomotion. Gait Posture 1998;7(1):26-34.
5. Alton F, Baldey L, Capian S, Morrissey MC. A kinematic com- parison of overground and treadmill walking. Clin Biomech (Bristol Avon) 1998;13(6):434-40.
6. Stolze H, Kuhtz-Buschbech JP, Mondwurf C, Boczek-Funcke A, Jöhnk K, Deuschl G, et al. Gait analysis during treadmill and overground locomotion in children and adults. Electroencephalogr Clin Neurophysiol 1997;105(6):490-7.
7. Warabi T, Kato M, Kiriyama K, Yoshida T, Kobayashi N.
Treadmill walking and overground walking of human subjects compared by recording sold-floor reaction force. Neurosci Res 2005;53(3):343-8.
8. Elliott BC, Blanksby BA. A cinematographic analysis of over- ground and treadmill running by males and females. Med Sci Sports 1976;8(2):84-7.
9. Riley PO, Dicharry J, Franz J, Della Croce U, Wilder RP, Kerrigan DC. A kinematics and kinetic comparison of over- ground and treadmill running. Med Sci Sports Exerc 2008;
40(6):1093-100.
10. Greig C, Btler F, Skelton D, Mahmud S, Young A. Treadmill walking in old age may not reproduce the real life situation. J Am Geriatr Soc 1993;41(1):15-8.
11. Murray MP, Spurr GB, Sepic SB, Gardner GM, Mollinger LA.
Treadmill vs. floor walking: kinematics, electromyogram, and heart rate. J Appl Physiol (1985) 1985;59(1):87-91.
12. Parvataneni K, Ploeg L, Olney SJ, Brouwer B. Kinematic, ki- netic and metabolic parameters of treadmill versus overground walking in healthy older adults. Clin Biomech (Bristol, Avon) 2009;24(1):95-100.
13. Riley PO, Paolini G, Croce UD, Paylo KW, Kerrigan DC. A kinematic and kinetic comparison of overground and treadmill walking in healthy subjects. Gait Posture 2007;26(1):17-24.
14. Stoquart G, Detrembleur C, Lejeune T. Effect of speed on kine- matic, kinetic, electromyographic and energetic reference values during treadmill walking. Neurophysiol Clin 2008;38(2):105-16.
15. Lee SJ, Hidler J. Biomechanics of overground versus treadmill walking in healthy individuals. J Appl Physiol (1985) 2008;
104(3):747-55.
16. Arsenault AB, Winter DA, Marteniuk RG. Treadmill versus walkway locomotion in humans: an EMG study. Ergonomics 1986;29(5):665-76.
17. Minnetti AE, Ardigo LP, Capodaglio EM, Saibene F. Energetics and mechanics of human walking at oscillating speeds. Am Zool 2001;41(2):205-10.
18. van Ingen Schenau GJ. Some fundamental aspects of the bio- mechanics of overground versus treadmill locomotion. Med Sci Sports Exerc 1980;12(4):257-61.
19. Pearce ME, Cunningham DA, Donner AP, Rechnitzer PA, Fullerton GM, Howard JH. Energy cost of treadmill and floor walking at self-selected paces. Eur J Appl Physiol Occup Physiol 1983;52(1):115-9.
20. Minnetti AE, Boldrini L, Brusamolin L, Zamparo P, McKee T.
A feedback-controlled treadmill (treadmill-on-demand) and the spontaneous speed of walking and running in humans. J Appl Physiol (1985) 2003;95(2):838-43.
21. Segers V, Lenoir M, Aerts P, De Clercq D. Influence of M. tibia- lis anterior fatigue on the walk-to-run and run-to-walk tran- sition in non-steady state locomotion. Gait Posture 2007;25(4):
639-47.
22. Kram R, Taylor CR. Energetics of running: a new perspective.
Nature 1990;346(6281):265-7.
23. Taylor CR. Force development during sustained locomotion: a
determinant of gait, speed and metabolic power. J Exp Biol 1985;115:253-62.
24. Biewener AA, Farley CT, Roberts TJ, Temaner M. Muscle me- chanical advantage of human walking and running: implications for energy cost. J Appl Physiol (1985) 2004;97(6):2266-74.
25. Saibene F, Minetti AE. Biomechanical and physiological aspects of legged locomotion in humans. Eur J Appl Physiol 2003;
88(4-5):297-316.
26. Nilsson J, Thorstensson A, Halbertsma J. Changes in leg move- ments and muscle activity with speed of locomotion and mode of progression in humans. Acta Physiol Scand 1985;123(4):457-75.
27. Andersson EA, Nilsson J, Thorstensson A. Intramuscular EMG from the hip flexor muscles during human locomotion.
Acta Physiol Scand 1997;161(3):361-70.
28. Waters RL, Lunsford BR, Perry J, Byrd R. Energy-speed rela- tionship of walking: standard tables. J Orthop Res 1988;6(2):215-22.
29. Waters RL, Mulroy S. The energy expenditure of normal and pathologic gait. Gait Posture 1999;9(3):207-31.