Effects of Psidium guajava Leaf Extract on Apoptosis Induction Through Mitochondrial Dysfunction in HepG2 Cells
Van-Tinh Nguyen1,2, Seok-Chun Ko3, Gun-Woo Oh1,2, Seong-Yeong Heo1,2, and Won-Kyo Jung1,2*
1Department of Biomedical Engineering, and Centre for Marine-Integrated Biomedical Technology (BK21 Plus), 2Marine-Integrated Bionics Research Center, Pukyong National University, Busan 48513, Republic of Korea
3Team of Marine Bio-resources, National Marine Biodiversity Institute of Korea, Seochun 33662, Republic of Korea
Received: July 2, 2018 / Revised: August 20, 2018 / Accepted: September 15, 2018
Introduction
Apoptosis is a form of programmed cell death that is regulated through gene expression and characterized by unique cellular phenomena, including chromatin con- densation, deoxyribonucleic acid (DNA) fragmentation, and membrane blebbing [1, 2]. To date, apoptosis induc- tion has been the primary action of chemotherapeutic agents used to treat cancer. The two major apoptotic pathways are the extrinsic and intrinsic pathways [3, 4].
The mitochondria play a critical role in both pathways, as mitochondrial permeation followed by a drop in mito-
chondrial membrane potential (ΔΨm) has been associ- ated with the release and activation of pro-apoptotic caspases as well as reactive oxygen species (ROS) pro- duction [5, 6]. Previous studies have also reported that ROS and nitric oxide (NO) production act as a death sig- nal in apoptosis [7, 8].
Caspases are a family of cysteine proteases, classically known to cause several morphological and biochemical changes within the cell that lead to cell death [9]. In particular, caspase-3 activation has been known to play a pivotal role in several aspects of the apoptotic path- way, including the cytochrome c (cyt-c) release and the induction of nuclear collapse [10]. Cyt-c is a component of the electron transport chain in mitochondria, and is translocated from the cytosol to the mitochondria follow- ing the induction of apoptosis [11]. Cyt-c translocation is The anticancer activity of guava (Psidium guajava L.) leaf extract (GLE) occurs via the induction of apop- tosis in cancer cells. However, the mechanism behind GLE-induced apoptosis in the human hepatocellular carcinoma cell line HepG2 remains unclear. In the present study, we investigated the apoptotic effects and mechanism of action of GLE in cultured HepG2 cells. The results showed that GLE induced reactive oxygen species (ROS) synthesis and disrupted the mitochondrial membrane potential (ΔΨm). Moreover, GLE increased the expression of apoptotic pathway proteins, such as the cleaved forms of caspase-3, -8, and -9;
the translocation of Bax and cytochrome c (cyt-c) from the mitochondria to the cytosol; and the downregu- lation of Bcl-2. In addition, p53 protein expression was increased upon GLE treatment. These observations indicate that the GLE-induced apoptosis in HepG2 cells is mediated by mitochondrial ROS generation, fol- lowed by caspase activation and cyt-c release, suggesting that GLE may be a promising candidate for the development of novel drugs for the treatment of liver cancers.
Keywords: Psidium guajava, apoptosis, HepG2 cells, mitochondrial dysfunction, reactive oxygen species
*Corresponding author
Tel: +82-51-629-5775, Fax: +82-51-629-5775 E-mail: [email protected]
© 2019, The Korean Society for Microbiology and Biotechnology
regulated by the protein Bax, which itself is upregulated by the tumor suppressor protein p53. Ahmad et al. [12]
observed that upregulation of p53 is associated with cell cycle progression and apoptosis, which is mediated by disruption of the mitochondrial membrane.
In recent years, hepatocellular carcinoma has become one of the most common malignant cancers, and the third-leading cause of cancer-related mortalities in the world [2, 13, 14]. Hence, there is a need for the develop- ment of new agents for the treatment of this liver cancer.
Several studies have indicated that the HepG2 is appro- priate for in vitro studies relating to the pathology of liver cancer and the discovery for potential therapeutic agents [15].
Extracts derived from the guava tree (Psidium guajava L.) have been widely used in traditional herbal medi- cines, as they are rich in tannins, terpenoids, flavonoids, guiajaverin, lectins, vitamins, phenolic, and quercetin [16, 17]. Extracts from the roots, leaves, bark, flowers, and twigs of guava are commonly used in the treatment of conjunctivitis, coughs, dysentery, gastroenteritis, skin sores, ulcers, and other diseases [18−24]. In the recent past, guava leaf extract (GLE) has been used in herbal medicine to treat hyperglycemic disorders, muscle spasms, and inflammation [17, 24, 25]. The guava plant, a member of the Myrtaceae family has been cultivated on the Jeju Island of South Korea extensively [2, 26−28].
However, to date, the mechanism of GLE-induced apop- tosis in HepG2 cells has not been fully characterized.
Therefore, the objective of this study was to evaluate the effect of GLE on HepG2 cell proliferation, and then investigate the mechanism underlying this effect.
Materials and Methods
Materials
HepG2 cells were purchased from American Type of Culture Collection (USA). Normal human dermal fibro- blasts-neonatal (NHDF-neo) cells were obtained from Lonza (USA). Dulbecco’s modified Eagle’s medium (DMEM), phosphate-buffered saline (PBS), penicillin/
streptomycin, trypsin-EDTA, and fetal bovine serum (FBS) were purchased from Gibco BRL, Life Technolo- gies (USA). Ribonuclease A solution, proteinase K and 2’,7’-dichlorofluorescin diacetate (DCFH-DA) were pur- chased from Sigma-Aldrich (USA). The FITC Annexin
V apoptosis detection kit was purchased from BD PharmingenTM (USA). Hoechst 33342 and antibodies were purchased from Santa Cruz Biotechnology, INC (USA). 5,5’,6,6’-tetrachloro-1,1’,3,3’-tetraethylbenzimi- dazolylcarbocyanine iodide (JC-1) Kit was purchased from Abnova Corporation (USA). Mitochondria/Cytosol Fractionation Kit was purchased from BioVision (USA).
All other chemicals were of the highest grade commer- cially available.
Extraction of GLE
Guava leaves were collected from Jeju Island in South Korea during July 2016. Leaves (without signs of necro- sis and with typical color and shape) were washed thrice with fresh water. The leaves were extracted three times with 80% aqueous methanol and filtered through a filter paper (Whatman No.1). The solvent was then evapo- rated at 40℃. Thereafter, the filtrate was lyophilized and kept at -80℃ for further use.
Cell culture and cytotoxicity assay
HepG2 and NHDF-neo cells were cultured in DMEM containing 10% FBS and 1% antibiotics at 37℃ under 5% CO2 atmosphere. Cytotoxicity was measured using MTT assay. HepG2 and NHDF-neo cells seeded onto 96- well plates were pre-incubated and subsequently exposed with GLE with different concentrations (5 to 100 μg/ml) for 48 h. Afterwards, MTT stock solution (50μl; 1 mg/ml in PBS) was added to each well and incu- bated for 4 h. After discarding culture medium from each well, formazan crystals were dissolved with 100 μl of DMSO. The absorbance was then measured with an ELISA reader at 540 nm.
Measurement of reactive oxygen species (ROS) production Cellular ROS levels were detected by using the oxida- tion-sensitive fluorescent dye (DCFH-DA). HepG2 cells seeded onto 24-well plates were pre-incubated and sub- sequently exposed with the GLE with different concen- trations (5 to 100 μg/ml) for 48 h. Then, the cells were treated with DCFH-DA dye and incubated for 30 min.
After incubation, the cells were washed with PBS. The images of the stained cells observed by using a fluorescent microscope (Axio Observer A1, Zeiss, Jena, Germany).
Fluorescence intensity was quantified by an IMT i-solu- tion Auto Ver. 9.6 software (IMT i-solution Inc., Canada).
Measurement of mitochondrial membrane potential (ΔΨm) ΔΨm was determined by using the mitochondria- specific lipophilic cationic fluorescence dye JC-1 detec- tion kit (Abnova Corporation, USA) [9]. HepG2 cells seeded onto 24-well plates were pre-incubated and sub- sequently exposed with the GLE with different concen- trations (5 to 100 μg/ml) for 48 h. The cells were then treated with 50 μM JC-1 dye for 30 min in the dark. The cells were then washed with PBS and observed by using a fluorescent microscope (Carl Zeiss MicroImaging GmbH). The green monomeric of JC-1 was used in filter pairs of 485 nm/535 nm; the red aggregate was used in filter pairs of 590 nm/610 nm. Fluorescence intensity was quantified by an IMT i-solution Auto Ver. 9.6 soft- ware (IMT i-solution Inc., Canada).
DNA fragmentation assay
HepG2 cells were exposed with the GLE with different concentrations (5 to 100 μg/ml) for 48 h. The cells were then washed twice with PBS (pH 7.4) and lysed in RIPA buffer [150 mM NaCl, 50 mM Tris-HCl (pH 7.5), 2 mM EDTA (pH 8.0), 1% Triton X-100, 1% sodium deoxycho- late, and 0.1% SDS] for 30 min on ice. Subsequently, the lysates were centrifuged at 10,000 g for 20 min at 4℃.
The lysates were then incubated with RNAase A (10 mg/
ml) for 1 h at 37℃ and then with proteinase K (10 mg/
ml) for 5 h at 50℃. Fragmented DNA in the supernatant was extracted with an equal volume of chloroform/iso- amyl/alcohol phenol (1:24:25) and electrophoretically analyzed (30 min at 100 V) on 1.5% agarose gels contain- ing 0.01% ethidium bromide (No. C-9009, BioNeer). The intensity of the bands was estimated by a ZoomBrowser EX software (Canon, USA).
Annexin V-FITC/Propidium Iodide (PI) labeling
Annexin V-FITC/Propium Iodide (PI) kit (BD Pharmingen, USA) was used to detect and measure apoptosis as described previously by Vinken et al. [31].
HepG2 cells were exposed with the GLE with different concentrations (5 to 100 μg/ml) for 48 h and then rewashed in the binding buffer [2.5 mM CaCl2, 0.14 M NaCl, 0.01 M Hepes/NaOH (pH 7.4)]. Next, HepG2 cells were incubated with binding buffer containing Annexin V-FITC and PI in the dark for 15 min at room tempera- ture. Culture dishes were washed twice with cold PBS and observed to fluorescence microscopy (Carl Zeiss
MicroImaging GmbH, Germany).
Nuclear staining with Hoechst 33342
To stain the nuclei, HepG2 cells were exposed with the GLE with different concentrations (5 to 100 μg/ml) for 48 h and then washed in PBS and fixed in 4% formalde- hyde for 10 min. The fixed cells were rewashed with cold PBS and stained with a Hoechst 33342 solutions at room temperature in the dark. The nuclear fragments were observed by using a fluorescent microscope (Carl Zeiss MicroImaging GmbH).
Protein extraction and western blotting assay
Western blotting was performed to determine the pro- tein expression according to standard procedures [11].
HepG2 cells were exposed with the GLE with different concentrations (5 to 100 μg/ml) for 48 h and then lysed in lysis RIPA buffer. For separate extraction of mitochon- drial and cytoplasmic proteins, a Mitochondria/Cytosol Fractionation Kit from BioVision (USA) was used follow- ing the manufacturer’s instructions, and protein concen- tration of cell lysates was determined by using the bicinchoninic acid (BCA) protein assay kit (Thermo Fisher Scientific, USA). Equal amounts of protein were loaded for 10% sodium dodecyl sulfate-polyacrylamide gel electrophoresis (SDS-PAGE) and transferred onto polyvinylidene difluoride (PVDF) membranes (Millipore, Billerica). The PVDF membranes were blocked with 5%
nonfat dry milk in TBS-T (0.1% Tween 20). The mem- branes were then incubated with the primary antibodies (1:1000 dilutions) at 4℃ overnight, and then incubated with secondary antibodies (1:5000 dilutions) for 2 h at room temperature. The signals were quantified by using LAS-4000 imaging system (FUJIFILM, Japan).
Statistical analysis
All data are presented as the mean ± standard devia- tion (SD). Significant differences among the groups were determined using the unpaired Student’s t-test. The dif- ferences were considered statistically significant at *p <
0.05 and **p < 0.01.
Results
Cell viability in HepG2 cells exposed to GLE
The cell viability of GLE against HepG2 cells were
examined by using the MTT assay. GLE exhibited growth inhibition on HepG2 cells in a dose-dependent manner. As illustrated in Fig. 1A, the percentages of HepG2 cell viability exposed to the GLE at 5, 20, 50, and 100 μg/ml were 81.85%, 70.65%, 53.19%, and 31.09%, respectively. In addition, the cell viability of GLE in NHDF-neo cells was examined using the MTT assay at 5, 20, 50, and 100 μg/ml. As shown in Fig. 1B, GLE (5, 20, 50, and 100 μg/ml) exhibited no cytotoxicity against NHDF-neo cells, and hence were selected for the subse- quent studies.
Induction effects of apoptosis in HepG2 cells by GLE To evaluate whether GLE possess apoptotic effect on HepG2 cells, we observed the influence on cell morphol- ogy by GLE using light microscopy. Fig. 2A shows that
the morphology of the cells was affected by incubation with GLE for 48 h, whereas untreated HepG2 cells appeared to exhibit normal morphology. The cells appeared to shrink when treated with 20 μg/ml GLE, and the majority of cells exposed to GLE at 100 μg/ml lost their typical flat polygonal shape. Fluorescent microscopy was subsequently used to further determine the impact of GLE on HepG2 cell morphology, with Hoechst 33342 dye to stain the nucleus (Fig. 2A). The nuclei of untreated cells diffused uniformly, whereas the nuclei of GLE-treated cells exhibited nuclear condensa- tion and fragmentation. The intensity of fluorescence indicating nuclear condensation appeared to increase in a dose-dependent manner, up to GLE concentrations of 100 μg/ml. DNA fragmentation is known to produce a characteristic DNA ladder, which is widely regarded as a hallmark of apoptosis. As shown in Fig. 2B, apoptosis was detected by DNA fragmentation using the DNA lad- der assay. The control without the GLE showed no DNA damage. By way of contrast, obvious DNA damage was showed in the GLE-exposed cells (Fig. 2B).
GLE-induced ROS production in HepG2 cells
ROS production is a pivotal action of mechanism in mitochondrial dysfunction, and further contributes to the apoptosis induction in HepG2 cells [28]. Hence, we attempted to determine whether GLE exposure in HepG2 cells increases ROS generation by measuring intracellular ROS levels using the fluorescence probe DCFH-DA. As shown in Fig. 2C, the ROS generation of the control without GLE was recorded as 6%, whereas that of the cells treated with GLE was recorded as 8, 16, 45, and 93% at 5, 20, 50, and 100 μg/ml, respectively.
Especially, GLE was significantly increased the ROS generation at 20, 50, and 100 μg/ml. The increase in ROS production observed in this study further suggests that the generation of ROS is a pivotal mechanism of action involved in GLE-induced apoptosis in HepG2 cells.
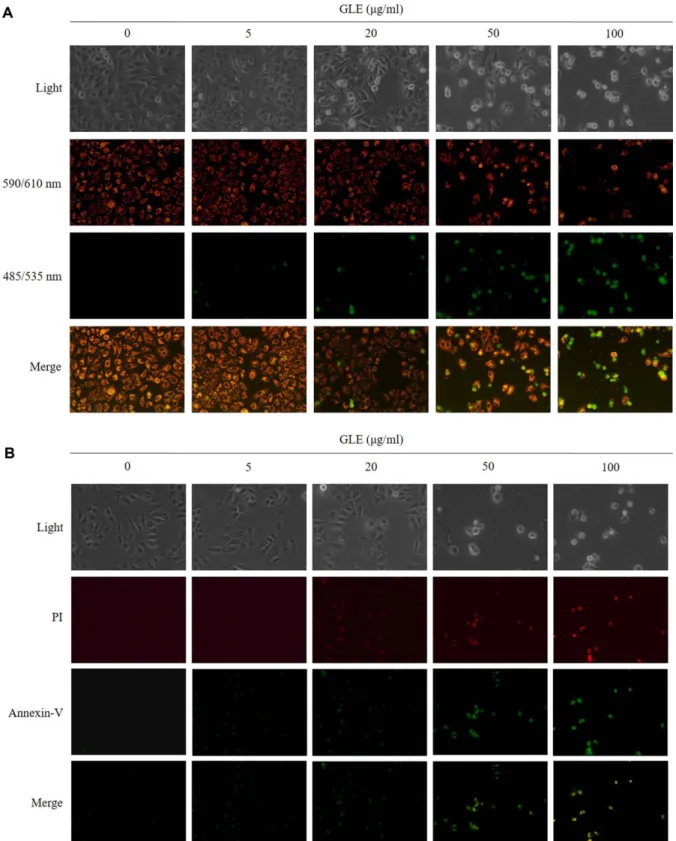
Disruption of mitochondrial membrane potential (ΔΨm) in HepG2 cells incubated with GLE
Disruption of ΔΨm is a critical event in triggering apoptosis. To investigate the disruption of ΔΨm during apoptosis induced by GLE, cells were stained with potential-sensitive fluorophore JC-1 and monitored with a fluorescence microscope. In mitochondria under normal Fig. 1. Effects of GLE on the cell viability in (A) HepG2
HepG2 and (B) NHDF-neo cells. HepG2 and NHDF-neo cells were treated with various concentrations of GLE for 48 h. Cell viability was measured by the MTT assay. The data are expressed as means ± S.D. from three independent experi- ments. *p < 0.05 and **p < 0.01 versus untreated cells.
condition, JC-aggregates form emits red fluorescence, while in apoptosis, JC-1 remains as the monomeric form in the cytoplasm and become green fluorescence. Treat- ment of HepG2 cells with GLE (50 and 100 μg/ml) resulted in loss of red fluorescence and appearance of green monomer fluorescence in the cytoplasm. As shown in Fig. 3A, JC-1-stained untreated cells as red fluores- cence (polarized state of ΔΨm) in mitochondria; however, GLE-treated cells were stained as green fluorescence (depolarized state of ΔΨm), suggesting that GLE changes the ΔΨm levels.
Effects of GLE on HepG2 cell membrane phosphatidylser- ine content
Membrane phosphatidylserine content in HepG2 cell was evaluated by Annexin V-FITC/PI double staining.
During apoptosis, externalization of phosphatidylserine occurs via translocation from the inner leaflet of the cell membrane to the outer leaflet. Phosphatidylserine then binds to Annexin V, which is detectable by green fluores- cence. The membranes of late apoptotic or necrotic cells are permeable to PI and can be detected by red fluores-
cence. In the present study, untreated cells stained neg- ative for both PI (red) and FITC Annexin V (green) (Fig.
3B). On the contrary, GLE-treated groups exhibited annexin-V–positive and PI-negative cells that the cells were in the early stages of apoptosis. Annexin-V/PI staining of HepG2 cells exposed to higher concentrations of GLE (50 and 100 μg/ml) suggested that these cells were at a late apoptotic stage or necrotic. Taken together, these findings provide strong evidence that GLE induced apoptosis in HepG2 cells.
Effects of GLE on the expression of Bcl-2, caspase family proteins, and cyt-c leakage in HepG2 cells
To investigate the mechanism involved in the induc- tion of apoptosis by GLE on HepG2 cells, we determined the effect of the GLE on protein expression related to apoptosis by western blotting. The Bcl-2 family proteins, including the pro-apoptotic Bax and anti-apoptotic Bcl-2 proteins, regulates the ΔΨm and activates the caspase cascade. It is a common characteristic in the death of cell that cytochrome c (the mitochondrial apoptogenic factor) was released from mitochondria into the cytoplasm. As Fig. 2. Induction of apoptosis and ROS by GLE in HepG2 cells. The cells were treated with various concentrations of GLE for 48 h.
(A) Morphological changes were visualized by an invert microscope. (B) The fragmented DNA was separated on 1.5% agarose gel electrophoresis and visualized under UV light after staining with ethidium bromide. (C) ROS levels were measured by image analysis and fluorescence microsrope. ROS levels were measured by IMT i-Solution. The values are expressed as the means ± S.D. of triplicate experiments. *p < 0.05 and **p < 0.01 indicate significant differences compared with the untreated cells.
Fig. 3. (A) Cell ΔΨm dissipation induced by GLE. Cell ΔΨ mdissipation induced by GLE. HePG2 cells were exposed to GLE at 5- 100 uM and stained by JC-1 detection kit. Red fluorescence represents the mitochondrial aggregation form of JC-1 indicating intact ΔΨm. Green fluorescence represents the monomeric form of JC-1 indicating a dissipation of ΔΨm. Green fluorescence represents the monomeric f. (B) Effects of GLE on apoptosis with Annexin V-FITC Apoptosis Detection Kit by a fluorescent microscopy. Viable cells did not bind annexin V-FITC and PI. Apoptotic cells are annexin V-FITC positive, with or without PI positivity. Annexin V/PI stain- ing HepG2 cells revealed that these cells were at a late apoptotic stage or necrotic.
the results in Fig. 4A show, GLE (50 and 100 μg/ml) exposure upregulated the expression of p53 and Bax and downregulated the expression of Bcl-2 compared to that
in untreated HepG2 cells, in a dose-dependent manner.
In addition, the role of mitochondria in GLE-induced apoptosis of HepG2 cells was confirmed by measuring Fig. 4. (A) Effect of GLE on protein expression of p53, Bcl-2, and Bax in HepG2 cells. (B) Effects of GLE on the mitochondrial apoptotic pathway in HepG2 cells. (C) Effect of GLE on protein expression of cleaved caspase-3, -8, and -9 in HepG2 cells. HepG2 cells were incubated for 48 h with or without GLE (5, 20, 50, and 100 μg/ml). The protein expression levels were detected using western blot analysis. The density ratio of the protein expressed in the untreated cells was considered to represent 1-fold. The data is expressed as mean folds of the protein expression versus untreated cells. The values are expressed as the means ± S.D. of triplicate experiments. *p < 0.05 and **p < 0.01 indicate significant differences compared with the untreated cells.
levels of both cytosolic and mitochondrial cyt-c. As shown in Fig. 4B, GLE led to increase in cyt-c within the cytosol fraction, whereas cyt-c decreased within the mitochondrial fraction. These results suggest that the mitochondria have a direct role in GLE-induced apopto- sis in HepG2 cells.
To further investigate the mechanisms by which GLE affects the caspases, HepG2 cells were exposed with GLE, and the cleaved caspase-3, -8, and -9 expression were measured. GLE exposed markedly increased the cleaved caspase-3, -8, and -9 expression in a dose-depen- dent manner (Fig. 4C).
Discussion
P. guajava is rich in antioxidants, vitamins, phenolics (caffeic acid, p-hydroxybenzoic acid, and gallic acid) and phytochemicals [16, 29]. Previous studies have shown that P. guajava effectively induces cytotoxicity, suggest- ing its potential as an anticancer agent [20, 30]. These effects are most likely due to the presence of phenolic compounds [22, 31]. Polyphenolic compounds elicit anti- cancer effects in a variety of cancer cells such as SNU- 16, HepG2, and human gastric carcinoma cell lines [32, 33]. P. guajava has high amounts of phenolic com- pounds. Chen et al. [34] reported that guava leaf extract with high flavonoid (8.29± 0.22 g/100 g) and polypheno- lic acid (16.56± 10.39 g/100 g) content inhibited brain- derived metastatic prostate cancer. In addition, Kaneko et al. [35] indicated that the safety of P. guajava has been reported in food-drug interactions in various sys- tems within animals. However, the mechanisms respon- sible for apoptosis induction by GLE on HepG2 cells has been still unclear. Therefore, in this study, we have demonstrated that GLE induces apoptosis in HepG2 cells. Treatment with 20, 50 and 100 μg/ml GLE for 48 h resulted in significant inhibition in cell viability (Fig.
1A). In order to assess the safety of dosage, we examined GLE toxicity in NHDF-neo cells. There are no significant affects on NHDF-neo cells growth (Fig. 1B). A critical cellular target of GLE may induce cytotoxicity in HepG2 cells.
Apoptosis plays a pivotal role in inhibiting tumorigen- esis [8]. In this study, the anticancer properties of GLE were investigated in HepG2 cells, by determining whether GLE exposure induces classic morphological
features that are associated with apoptosis. In a previ- ous study, Lee and Park [27] found that treatment with extracts from guava branch induced chromatin conden- sation in human colon cancer cells. In this study, changes in nuclear morphology, such as chromatin con- densation, were observed in GLE-exposed cells upon staining with Hoechst 33342, further supporting that GLE induced apoptosis in HepG2 cells. GLE treatment iuced the formation of apoptotic bodies (Fig. 2A). These results are similar to those of studies that have investi- gated the apoptotic effects of GLE in HT-29 [27] and NB4 cells [30]. Furthermore, DNA cleavage is another biochemical hallmark of apoptosis, and was observed in HepG2 cells incubated with GLE. GLE treatment induced DNA fragmentation in HepG2 cells, whereas untreated cells without GLE observed no evidence of DNA fragmention (Fig. 2B). These results suggest that the HepG2 cells may undergo apoptosis after GLE pre- treatment, and there is a good correlation between the extent of apoptosis and the inhibition of cell growth.
The features of apoptosis were also altered by mito- chondrial and caspase pathways [36]. The change in the ΔΨm was suggested to be an essential factor responsible for inducing apoptosis [32]. ROS production is known as a trigger for mitochondria-mediated apoptosis. Numer- ous investigations have indicated that an increase in ROS-mediated cellular changes can induce apoptosis in a wide variety of cancer cells, including HepG2 and Hela cells [5, 12, 37, 38]. Therefore, we attempted to investi- gate whether GLE exposure induces ROS generation in HepG2 cells by measuring the intracellular levels of ROS via DCF-DA staining. In the present study, GLE caused a substantial increase in the ROS levels in a dose-dependent fashion. Especially, the maximum ROS generation with a 15-fold increase relative to the untreated cells, was exhibited after exposure with 100μg/ml GLE (Fig. 2C). Liu et al. [32] exhibited that the apoptosis of HepG2 cells induced by ROS.
On the contrary, the consequence of mitochondrial ROS increase is the activation of the mitochondrial per- meability transition pore [37]. The images of HepG2 cells with GLE were shown in Fig. 3A. In the untreated cells, JC-1 stained with red fluorescence, however, GLE- exposed cells stained with green fluorescence. These results indicated that GLE can indeed alter the levels of mitochondrial membrane potential. Therefore, GLE
might mediated its induction of apoptosis on HepG2 cells by mechanisms involving the mitochondrial dys- function.
To further confirm, apoptotic features of GLE, the FITC-Annexin V and PI dual staining were employed.
The changes of cell morphology, including cell shrink- age, membrane permeability, and chromatin condensa- tion involved in the occurrence of apoptosis [39, 40]. It is divided into early and later stages in the apoptotic pro- cess, and can be distinguished by using cell staining assay. In early stages of apoptosis, the loss of cell mem- brane asymmetry lease to exposure of phosphatidylser- ine (PS) residues (normally hidden within the plasma membrane) on the surface of the cell [41]. FITC-Annexin V binds to the phospholipid pohosphatidylserine, and come to outer membrane in dying cells, mainly used for detection but cannot enter the cell. PI was impermeable to live and apoptotic cells, but permeable to dead cells.
Based on the result, exposed HepG2 cells with various dosages of GLE were found to be FITC-Annexin V and PI positive, which are the signs of early and late apopto- sis, and necrosis (Fig. 3B). Similar reports were found by a mechanism of ethanol [42], long-chain vitamin E metabolites [43] and harmine [13] mediated apoptosis in HepG2 cells.
Cyt-c release from mitochondria triggers caspase acti- vation and is tightly regulated by a variety of factors such as Bcl-2 and Bax [7]. Bax is considered to be the critical pro-apoptotic Bcl-2 family member, whereas overexpression of Bcl-2 has been reported to protect tumor cells from apoptosis. Bax induces the cyt-c release, which activates the executioner caspase-3 in apoptosis [44]. Furthermore, p53 additionally plays a pivotal role in apoptosis and can directly induce the mitochondrial release of cyt-c in HepG2 cells [1, 3]. Our data indicated that GLE exposure in HepG2 cells also induced an increase in p53 expression level. Also, GLE reduced the Bcl-2/Bax proportion, increased the expression level of cytosolic cyc-c (Fig. 4A, B).
Several studies have reported the importance of a variety of toxins and chemicals in triggering caspase activation during apoptosis [30, 33]. In our study, an increase in the cleaved forms of caspase-3, -8, and -9 was observed in GLE-exposed HepG2 cells. As a result, the cleaved caspase-3, -8, and -9 expression increased in exposure to GLE (Fig. 4C) and, suggesting that GLE-
induced apoptosis involves the mitochondrial pathway of apoptosis.
Several studies have focused on the isolation of phyto- chemicals from guava leaves, and those phytochemicals have been found to show promising anti-cancer effects.
Previous studies have revealed that guavinoside C and guavinoside F demonstrates cytotoxicity in Hela cervical cancer cells, SGC-7901 gastric cancer cells and A549 adenocarcinomic human alveolar basal epithelial cells [45]. β-caryophyllene oxide, a sesquiterpene, also exhib- ited apoptosis induction in human prostate and breast cancer cells [46]. In addition, genistein exhibited inhibi- tion of proliferation and induction of apoptosis in HT-29 colon cancer cells [47]. Oleaonic acid has also been reported to induce apoptosis in human leukemia cells [48].
In conclusion, the present study shows that the anti- proliferative effects of GLE observed in HepG2 cells are most likely due to the induction of apoptosis. GLE caused a significant increase in the cleaved forms of caspases. Moreover, the mitochondrial pathways of apoptosis were activated in HepG2 cells following GLE exposure, as evidenced by the downregulation of Bcl-2 and upregulation of Bax and p53 and the release of cyt-c from the mitochondria into the cytosol. These findings suggest that other polyphenols and perhaps other unknown active components in GLE are responsible for inducing apoptosis in HepG2 cells through ROS-medi- ated mitochondrial fission. P. guajava represents a promising candidate for the development of novel thera- peutic agents to treat liver cancer.
Acknowledgments
This study was supported by research funds from Pukyong National University 2017.
Conflict of Interest
The authors have no financial conflicts of interest to declare.
References
1. Zou Y, Niu P, Yang J, Yuan J, Wu TC, Chen X. 2008. The JNK signal- ing pathway is involved in sodium-selenite-induced apoptosis mediated by reactive oxygen in HepG2 cells. Cancer Biol. Ther. 7:
691-698.
2. Lee J, Lim KT. 2010. Apoptotic activity of ethanol extract from
Styrax Japonica Siebold et al. Zuccarini in HepG2 cells. J. Ethno- pharmacol. 131: 210-215.
3. Chen W, Hou J, Yin Y, Jang J, Zheng Z, Fan H, et al. 2010. α-Bisabo- lol induces dose-and time-dependent apoptosis in HepG2 cells via a Fas-and mitochondrial-related pathway, involves p53 and NF-κB. Biochem. Pharmacol. 80: 247-254.
4. Nepal S, Kim MJ, Subedi A, Lee ES, Yong CS, Kim JA, et al. 2012.
Globular adiponectin inhibits ethanol-induced apoptosis in HepG2 cells through heme oxygenase-1 induction. Biochem.
Pharmacol. 84: 974-983.
5. Park C, Jin CY, Hwang HJ, Kim GY, Jung JH, Kim WJ, et al. 2012. J7, a methyl jasmonate derivative, enhances TRAIL-mediated apop- tosis through up-regulation of reactive oxygen species genera- tion in human hepatoma HepG2 cells. Toxicol. In Vitro 26: 86-93.
6. Zou J, Chen Q, Jin X, Tang S, Chen K, Zhang T, et al. 2011. Olaquin- dox induces apoptosis through the mitochondrial pathway in HepG2 cells. Toxicology 285: 104-113.
7. Tripathi M, Singh BK, Mishra C, Raisuddin S, Kakkar P. 2010.
Involvement of mitochondria mediated pathways in hepatopro- tection conferred by Fumaria parviflora Lam. extract against nimesulide induced apoptosis in vitro. Toxicol. In Vitro 24: 495- 508.
8. Lisardo B, Hortelano S. 1999. Mechanisms of nitric oxide-depen- dent apoptosis: Involvement of mitochondrial mediators. Cell.
Signal. 11: 239-244.
9. Chen X, Liu J, Wang T, Shang J. 2012. Colchicine-induced apopto- sis in human normal liver L-02 cells by mitochondrial mediated pathways. Toxicol. In Vitro 26: 649-655.
10. Zhao Q, Guo Y, Feng B, Li L, Huang C, Jiao B. 2011. Neriifolin from seeds of Cerbera manghas L. induces cell cycle arrest and apop- tosis in human hepatocellular carcinoma HepG2 cells. Fitoterapia 82: 735-741.
11. Qiao Y, Xiang Q, Yuan I, Xu L, Liu Z, Liu X. 2013. Herbacetin induces apoptosis in HepG2 cells: Involvements of ROS and PI3K/
Akt pathway. Food Chem. Toxicol. 51: 426-433.
12. Ahmad J, Ahamed M, Akhtar MJ, Alrokayan SA, Siddiqui MA, Musarrat J, et al. 2012. Apoptosis induction by silica nanoparti- cles mediated through reactive oxygen species in human liver cell line HepG2. Toxicol. Appl. Pharmacol. 259: 160-168.
13. Cao MR, Li Q, Liu ZL, Liu HH, Wang W, Liao XL, et al. 2011. Harmine induces apoptosis in HepG2 cells via mitochondrial signaling pathway. Hepatobiliary. Pancreat. Dis Int. 10: 599-604.
14. Ferlay J, Shin HR, Bray F, Forman D, Mathers C, Parkin DM. 2010.
Estimates of worldwide burden of cancer in 2008: GLOBOCAN 2008. Int. J. Cancer 127: 2893-2917.
15. Gerets HHJ, Tilmant K, Gerin B, Chanteux H, Depelchin BO, Dhal- luin S, et al. 2012. Characterization of primary human hepato- cytes, HepG2 cells, and HepaRG cells at the mRNA level and CYP activity in response to inducers and their predictivity for the detection of human hepatotoxins. Cell Biol. Toxicol. 28: 69-87.
16. Rahman MM, Ahmad SH, Lgu KS. 2012. Psidium guajava and Piper betle leaf extracts prolong vase life of cut carnation (Dianthus caryophyllus) flowers. Sci. World J. 2012: 102805-102814.
17. Yoshitomi H, Guo X, Liu T, Gao M. 2012. Guava leaf extracts allevi- ate fatty liver via expression of adiponectin receptors in SHRSP.Z- Leprfa/Izm rats. Nutr. Metab. 9: 1-13.
18. Raja NRL, Sundar K. 2012. Psidium guajava Linn confers gastro protective effects on rats. Eur. Rev. Med. Pharmacol. Sci. 16: 151- 156.
19. Rosa MPG, Mitchell S, Solis RV. 2008. Psidium guajava: A review of its traditional uses, phytochemistry and pharmacology. J. Ethno- pharmacol. 117: 1-27.
20. Ryu NH, Park KR, Kim SM, Yun HM, Nam D, Lee SG, et al. 2012. A hexane fraction of guava leaves (Psidium guajava L.) induces anticancer activity by suppressing AKT/Mammalian target of Rapamycin/Ribosomal p70 S6 kinase in human prostate cancer cells. J. Med. Food 15: 231-241.
21. Kang ZC, Yen MT, Chiu CK, Wu HC, Huang SL, Tai SP, et al. 2013.
The inhibitory effects of aqueous extract from guava twigs, Psid- ium guajava L., on mutation and oxidative damage. J. Chem.
2013: 561905-561912.
22. Soman S, Rajamanickam C, Rauf AA, Indira M. 2013. Beneficial effects of Psidium guajava leaf extract on diabetic myocardium.
Exp. Toxicol. Pathol. 65: 91-95.
23. Uduak EU, Timbuak JA, Musa SA, Ikyembe DT, Abdurrashid S, Hamman WO. 2012. Ulceroprotective effect of methanol extract of Psidium guajava leaves on ethanol induced gastric ulcer in adult wistar rats. Asian J. Med. Sci. 4: 75-78.
24. Barbalho SM, Farinazzi-Machado FMV, Goulart RA, Brunnati ACS, Ottoboni AMMB, Nicolau CCT. 2012. Psidium Guajava (Guava): A plant of multipurpose medicinal applications. Med. Aromat.
Plants 1: 104-110.
25. Shen SC, Cheng FC, Wu NJ. 2008. Effect of guava (Psidium gua- java Linn.) leaf soluble solids on glucose metabolism in type 2 diabetic rats. Phytother. Res. 22: 1458-1464.
26. Lim SW, Kim SW, Lee SC, Yuk HG. 2013. Exposure of Salmonella Typhimurium to guava extracts increases their sensitivity to acidic environments. Food Cont. 33: 393-398.
27. Lee SB, Park HR. 2010. Anticancer activity of guava (Psidium gua- java L.) branch extracts against HT-29 human colon cancer cells.
J. Med. Plant Res. 4: 891-896.
28. Poornima P, Quency RS, Padma VV. 2013. Neferine induces reac- tive oxygen species mediated intrinsic pathway of apoptosis in HepG2 cells. Food Chem. 136: 659-667.
29. Conde GEA, Nascimento VT, Santos SAB. 2003. Inotropic effects of extracts of Psidium guajava L. (guava) leaves on the guinea pig atrium. Brazil J. Med. Biol. Res. 36: 661-668.
30. Bontempo P, Doto A, Miceli M, Mita L, Benedetti R, Nebbioso A, et al. 2012. Psidium guajava L. anti-neoplastic effects: induction of apoptosis and cell differentiation. Cell Prolif. 4: 22-31.
31. Chang CH, Hsieh CL, Wang HE, Peng CC, Chyau CC, Peng RY.
2013. Unique bioactive polyphenolic profile of guava (Psidium guajava) budding leaf tea is related to plant biochemistry of bud- ding leaves in early dawn. J. Sci. Food Agric. 93: 944-954.
32. Liu H, Xiao Y, Xiong C, Wei A, Ruan J. 2011. Apoptosis induced by a new flavonoid in human hepatoma HepG2 cells involves reac-
tive oxygen species-mediated mitochondrial dysfunction and MAPK activation. Eur. J. Pharmacol. 654: 209-216.
33. Moon JY, Mosaddik A, Kim H, Cho M, Choi HK, Kim YS, et al. 2011.
The chloroform fraction of guava (Psidium cattleianumsabine) leaf extract inhibits human gastric cancer cell proliferation via induction of apoptosis. Food Chem. 125: 369-375.
34. Chen KC, Hsieh CL, Peng CC, Hsieh-Li HM, Chiang HS, Huang KD, et al. 2007. Brain derived metastatic prostate cancer DU-145 cells are effectively inhibited in vitro by guava (Psidium gujava L.) leaf extracts. Nutr. Cancer 58: 93-106.
35. Kaneko K, Suzuki K, Iwadate-Iwata E, Kato I, Uchida K, Onoue M.
2013. Evaluation of food-drug interaction of guava leaf tea. Phy- tother. Res. 27: 299-305.
36. Giuliano M, Pellerito O, Portanova P, Calvaruso G, Santulli A, Blasio AD, et al. 2009. Apoptosis induced in HepG2 cells by the syn- thetic cannabinoid WIN: Involvement of the transcription factor PPARγ. Biochimie. 91: 457-465.
37. Yuan L, Kaplowitz N. 2009. Glutathione in liver diseases and hep- atotoxicity. Mol. Aspects Med. 30: 29-41.
38. Menezes C, Alverca E, Dias E, Sam-Bento F, Pereira P. 2013.
Involvement of endoplasmic reticulum and autophagy in micro- cystin-LR toxicity in Vero-E6 and HepG2 cell lines. Toxicol. In Vitro 27: 138-148.
39. Fink SL, Cookson BT. 2005. Apoptosis, pyroptosis, and necrosis:
mechanistic description of dead and dying eukaryotic cells.
Infect. Immun. 73: 1907-1916.
40. Baqheri E, Hajiaghaalipour F, Nyamathulla S, Salehen N. 2018.
The apoptotic effects of Brucea javanica fruit extract against HT29 cells associated with p53 upregulation and inhibition of NF-κB translocation. Drug Des. Devel. Ther. 12: 657-671.
41. Abcam. Introduction to apoptosis. Available from https://www.
abcam.com/ps/pdf/protocols/apoptosis_introduction.pdf.
Accessed Aug. 24, 2018.
42. Chandrasekaran K, Swaminathan K, Kumar SM, Chatterjee S, Cle- mens DL, Dey A. 2011. Evated glutathione level does not protect against chronic alcohol mediated apoptosis in recombinant human hepatoma cell line VL-17A over-expressing alcohol metabolizing enzymes-alcohol dehydrogenase and cytochrome P450 2E1. Toxicol. In Vitro 25: 969-978.
43. Birringer M, Lington D, Vertuani S, Manfredini S, Scharlau D, Gleic M, et al. 2010. Proapoptotic effects of long-chain vitamin E metabolites in HepG2 cells are mediated by oxidative stress. Free Radical Bio. Med. 49: 1315-1322.
44. Lee SH, Ryu BM, Je JY, Kim SK. 2011. Diethylaminoethyl chitosan induces apoptosis in HeLa cells via activation of caspase-3 and p53 expression. Carbohydr. Polym. 84: 571-578.
45. Feng XH, Wang ZH, Meng DL, Li X. 2015. Cytotoxic and antioxi- dant constituents from the leaves of Psidium quajava. Bioorg.
Med. Chem. Lett. 25: 2193-2198.
46. Park KR, Nam D, Yun HM, Lee SG, Jang HJ, Sethi G, et al. 2011. β- Caryophyllene oxide inhibits growth and induces apoptosis through the suppression of PI3K/AKT/mTOR/S6K1 pathways and ROS-mediated MAPKs activation. Cancer Lett. 312: 178-188.
47. Yu Z, Li W, Liu F. 2001. Inhibition of proliferation and induction of apoptosis by genistein in colon cancer HT-29 cells. Cancer Lett.
215: 159-166.
48. Zhang P, Li H, Chen D, Ni J, Kang Y, Wang S. 2007. Oleanolic acid induces apoptosis in human leukemia cells through caspase acti- vation and poly (ADP-ribose) polymerase cleavage. Acta Biochim.
Biophys. Sin. 39: 803-809.