ABSTRACT
Background: Isoflurane, a common anesthetic for cardiac surgery, reduced myocardial contractility in many experimental studies, few studies have determined isoflurane's direct impact on the left ventricular (LV) contractile function during cardiac surgery. We determined whether isoflurane dose-dependently reduces the peak systolic velocity of the lateral mitral annulus in tissue Doppler imaging (S′) in patients undergoing cardiac surgery.
Methods: During isoflurane-supplemented remifentanil-based anesthesia for patients undergoing cardiac surgery with preoperative LV ejection fraction greater than 50% (n = 20), we analyzed the changes of S′ at each isoflurane dose increment (1.0, 1.5, and 2.0 minimum alveolar concentration [MAC]: T1, T2, and T3, respectively) with a fixed remifentanil dosage (1.0 μg/min/kg) by using transesophageal echocardiography.
Results: Mean S′ values (95% confidence interval [CI]) at T1, T2, and T3 were 10.5 (8.8–12.2), 9.5 (8.3–10.8), and 8.4 (7.3–9.5) cm/s, respectively (P < 0.001 in multivariate analysis of variance test). Their mean differences at T1 vs. T2, T2 vs. T3, and T1 vs. T3 were −1.0 (−1.6, −0.3), −1.1 (−1.7,
−0.6), and −2.1 (−3.1, −1.1) cm/s, respectively. Phenylephrine infusion rates were significantly increased (0.26, 0.22, and 0.47 μg/kg/min at T1, T2, and T3, respectively, P < 0.001).
Conclusion: Isoflurane increments (1.0–2.0 MAC) dose-dependently reduced LV systolic long- axis performance during cardiac surgeries with a preserved preoperative systolic function.
Keywords: Echocardiography; Heart function test; Isoflurane
INTRODUCTION
Isoflurane has been widely used for anesthesia for cardiac surgeries, but previous experimental studies showed isoflurane-induced reduction of myocardial contractility.1,2 Considering frequent association of reduced cardiac reserve or pre-existing cardiac dysfunction in patients undergoing cardiac surgeries, further deterioration of left ventricle
Original Article
Ju Deok Kim ,1 Ilsoon Son ,2 Won-kyoung Kwon ,2,3 Tae-Yun Sung ,4 Hanafi Sidik ,5 Karam Kim ,2 Hyun Kang ,6 Jiyon Bang ,7 Gwi Eun Yeo ,8 Dong Kyu Lee ,8 and Tae-Yop Kim 2,3
1Department of Anesthesiology and Pain Medicine, Kosin University College of Medicine, Busan, Korea
2Department of Anesthesiology, Konkuk University Medical Center, Seoul, Korea
3Department of Anesthesiology, Konkuk University School of Medicine, Seoul, Korea
4 Department of Anesthesiology, Konyang University Hospital, Konyang University College of Medicine, Daejeon, Korea
5 Cardiothoracic Anaesthesiology and Perfusion Unit, Sarawak General Hospital, Jalan Tun Ahmad Zaidi Adruce, Sarawak, Malaysia
6Department of Anesthesiology, Chung-Ang University School of Medicine, Seoul, Korea
7Department of Anesthesiology, University of Ulsan College of Medicine, Asan Medical Center, Seoul, Korea
8Department of Anesthesiology and Pain Medicine, Korea University Guro Hospital, Seoul, Korea
Isoflurane's Effect on Intraoperative Systolic Left Ventricular Performance in Cardiac Valve Surgery Patients
Received: Aug 4, 2017 Accepted: Oct 28, 2017 Address for Correspondence:
Tae-Yop Kim, MD, PhD
Department of Anesthesiology, Konkuk University Medical Center, Konkuk University School of Medicine, 120-1 Neungdong-ro, Gwangjin-gu, Seoul 05030, Korea.
E-mail: taeyop@gmail.com
© 2018 The Korean Academy of Medical Sciences.
This is an Open Access article distributed under the terms of the Creative Commons Attribution Non-Commercial License (https://
creativecommons.org/licenses/by-nc/4.0/) which permits unrestricted non-commercial use, distribution, and reproduction in any medium, provided the original work is properly cited.
ORCID iDs Ju Deok Kim
https://orcid.org/0000-0002-9236-5183 Ilsoon Son
https://orcid.org/0000-0003-4388-0178 Won-kyoung Kwon
https://orcid.org/0000-0001-5753-2479 Tae-Yun Sung
https://orcid.org/0000-0002-0714-1477 Hanafi Sidik
https://orcid.org/0000-0003-1122-2576 Karam Kim
https://orcid.org/0000-0002-4872-6594 Hyun Kang
https://orcid.org/0000-0003-2844-5880 Jiyon Bang
https://orcid.org/0000-0002-1031-9539
Anesthesiology & Pain
Gwi Eun Yeo
https://orcid.org/0000-0002-0141-4286 Dong Kyu Lee
https://orcid.org/0000-0002-4068-2363 Tae-Yop Kim
https://orcid.org/0000-0003-0806-8969 Funding
This work was supported by Konkuk University and Konkuk University Medical Center Research Grant 2015.
Disclosure
The authors have no potential conflicts of interest to disclose.
Author Contributions
Conceptualization: Kim JD, Son I, Kwon WK, Sung TY, Sidik H, Kim K, Kim TY. Data curation:
Kim JD, Son I, Kwon WK, Sung TY, Sidik H, Kim K, Bang J, Yeo GE, Kim TY. Formal analysis:
Kim JD, Sung TY, Sidik H, Kim K, Kang H, Bang J, Yeo GE, Lee DK, Kim TY. Writing - original draft: Kim JD, Sung TY, Sidik H, Kang H, Lee DK, Kim TY.
(LV) performance would be problematic in terms of potentially increasing patients' perioperative risk. However, it is difficult to find previous studies that determined isoflurane's direct effect on LV contractile function during cardiac surgeries.
Meanwhile, previous studies determined direct effects of anesthetic agents on the
intraoperative LV systolic function by using peak systolic velocity of the lateral mitral annulus in tissue Doppler imaging (S′) of the mitral annular motion.3-5 Importantly, while mitral annular tissue Doppler imaging (TDI) has been regarded as an easier and less operator- dependent tool for evaluating LV long-axis performance,6-8 S′ showed close relationship with other systolic parameters, including intraventricular pressure change (dP/dt) and left ventricular ejection fraction (LVEF).9,10 Furthermore, its greater sensitivity enabled the detection of small changes in systolic performance which was not detected by LVEF.9-13 Most of all, being relatively less dependent on LV-loading condition seems to be a valuable feature for its use in intraoperative analysis of LV performance.9
Therefore, we analyzed the changes in S′ in response to the increments of isoflurane dosage during the isoflurane-supplemented remifentanil-based anesthesia for cardiac surgeries.
Consequently, we hypothesized that isoflurane would dose-dependently reduce intraoperative S′ in this setting.
METHODS
Patients
Preoperative exclusion criteria included the following: pacemaker implantation, atrial
fibrillation, infective endocarditis, pericardial disease, infiltrative myocardial disease, ischemic heart disease, limited mitral annular motion,14 LVEF < 50% in preoperative transthoracic echocardiography (TTE) or contraindications to transesophageal echocardiography (TEE).
Anesthesia and monitoring
Electrocardiogram, Bispectral index (BIS), and pulse oximetry were applied on patient's arrival in the operation room. A 20–22 G catheter was placed in the radial artery to start invasive blood pressure (BP) monitoring. Anesthesia was maintained with isoflurane (Aerane™; Boxter Healthcare, Deerfield, IL, USA) with O2 and medical air (FiO2 0.4–0.6), rocuronium and target-controlled infusion of remifentanil (target plasma concentration of 20 ng/mL in Minto model, comparable to continuous infusion (0.7–0.8 μg/kg/min) with monitoring of the central venous pressure (CVP), pulmonary arterial pressure (PAP), cardiac output (CO), and mixed venous O2 saturation (SvO2). Intraoperative TEE (Vivid 7™ and Omniplane™ TEE probe; GE Healthcare, Waukesha, WI, USA) was performed. Systemic vascular resistance index (SVRI) was determined regularly.15
Before the start of the present study, hydroxyl ethyl starch and phenylephrine were infused to maintain the mean BP of 80%–120% of the pre-induction value. Patients who were unable to maintain BIS < 60 at isoflurane 1.0 minimum alveolar concentration (MAC), and patients with heart rate (HR) < 45 or > 100 beats/min, requiring extra rescue medication, were excluded.
Intraoperative TEE data recording
After sternotomy, consecutive 3–4 DTI-tracings of the lateral mitral annular motion were recorded with a sweep speed of 6.67 cm/s in the midesophageal 4-chamber view12,16,17
at end-tidal concentration at 1.0, 1.5, and 2.0 age-adjusted MAC (T1, T2, and T3,
respectively).18 Doppler tracings of mitral inflow and two-dimensional (2D) images for LVEF were also traced and recorded in the midesophageal 4-chamber or 2-chamber view at T1, T2, and T3.
All recordings were performed after at least 10-minute-exposure to each isoflurane dosage, and one investigator (TYK) performed all recordings with short interruptions of ventilation and surgical procedure. Recorded data were digitally stored for future off-line analysis after removing patient information and recording time.
Patients were excluded if appropriate DTI alignment to the mitral annular motion was failed or their degree of mitral regurgitation (MR) was changed during the increments.
Other hemodynamic and BIS data recording
BP, HR, PAP, CVP, CO, SvO2, and BIS were also recorded at T1, T2, and T3. During the study period with isoflurane increments, mean BP was maintained within the pre-induction level of 80%–120% with/without titrating the phenylephrine infusion rate. In case of the titration, the data were acquired after allowing at least 5 minutes.
Post-operative off-line analysis of the recorded data
An echocardiographer, who was blinded for our study, performed the following
determinations by using software (EchoPac™; GE Healthcare): S′, peak velocities of tissue Doppler imaging mitral annulus during early relaxation and late atrial contraction (e′ and a′, respectively), peak velocities of transmitral Doppler flow during early relaxation and atrial contraction (E and A, respectively), E/A ratio and deceleration time (DT) of transmitral inflow during early relaxation.
S′, e′, and a′ were determined by using a single DTI tracing out of 3–4 consecutive recorded tracings, and their determination was repeated in the same manner. For statistical analysis, the mean values of two determinations were employed. Stroke volume (SV) and LVEF were calculated by using left ventricle end-diastolic volume (LVEDV) and left ventricle end-systolic volume (LVESVs) in modified Simpson method. During the study period, systolic BP and arterial elastance (Ea = systolic BP/SV, mmHg/mL) were employed to analyze the changes in LV end-systolic pressure and LV afterload, respectively.14,15
Statistical analysis of final data
The primary outcome was the changes in S′ at T1, T2, and T3. Data distribution was evaluated for normality using the Shapiro-Wilk test to compare variables among different concentrations of isoflurane. Sphericity of normally distributed data was evaluated by using Mauchly's test. The changes of data passing normality and sphericity tests were analyzed by using repeated measures of analysis of variance (ANOVA) and Tukey's post-hoc test. The data that just passed the normality test, but not the sphericity test, were analyzed by using Wilks' Lambda's multivariate analysis of variance (MANOVA) and Bonferroni correction.
Abnormally distributed data were analyzed by using Friedman test and Bonferroni correction.
The changes in DT, LVEF, mean BP, SVRI, LVEDV, LVESV, and E/A were analyzed by repeated measures of ANOVA. Those in S′, E, PAP, HR, and SV were analyzed by using MANOVA, and those in BIS, SvO2, CO, phenylephrine infusion rate, e′, a′, A, ratio of E to e′ (E/e′), LVEDV, LVESV, SV, Ea, and the numbers of patients were analyzed by using Friedman test.
In order to visualize the agreement between the first and the second determination of S′, e′, and a′, we constructed Bland-Altman plot.19 Bland-Altman limits of agreement (LOA) was evaluated according to the mean agreement (mean of difference between the first and the second measured values) and 95% LOA (mean ± 1.96 standard deviation of differences).20 Pearson (r) or Spearman rank correlation coefficient (ρ) was employed to examine the relation between the first and the second measured values (r in S′, ρ in e′ and a′). SPSS version 21.0 (IBM Corp., Armonk, NY, USA) was used for statistical analysis.
To obtain a sample size estimate for the study, a pilot study was conducted to obtain S′ from five patients. At T1, T2, and T3, the average values of S′ were 9.5, 8.9, and 8.0 cm/s, respectively, and their standard deviation ranged from 1.5 to 2.2 cm/s. Autocorrelation between adjacent measurements in the same individual was 0.6. For power calculation, we assumed that the first-order autocorrelation adequately represents the autocorrelation pattern and planned to use Greenhouse-Geisser Corrected F-test for the repeated measurement of ANOVA to determine the within-group difference of S′. Consequently, the standard deviation was 0.70 cm/s and the standard deviation of actual effect was 0.62 cm/s, and their effect size was 0.88. For a power of 80% and an α of 0.05, 18 patients were appropriated. As a usual chance of failure for successful DTI tracing of the lateral mitral annulus by using TEE was 10%, we decided to enrol 20 patients.
The PASS 11™ software (NCSS, Kaysville, UT, USA) was employed to compute the sample size.
Ethics statement
Our manuscript adheres to the Strengthening the Reporting of Observational Studies in Epidemiology guidelines. After getting Institutional Review Board approval of Konkuk University Medical Center (KUH 1160052) and registering at www.ClinicalTrials.gov
(NCT01819012), patients undergoing a cardiac surgery were recruited after providing written informed consent (Fig. 1).
RESULTS
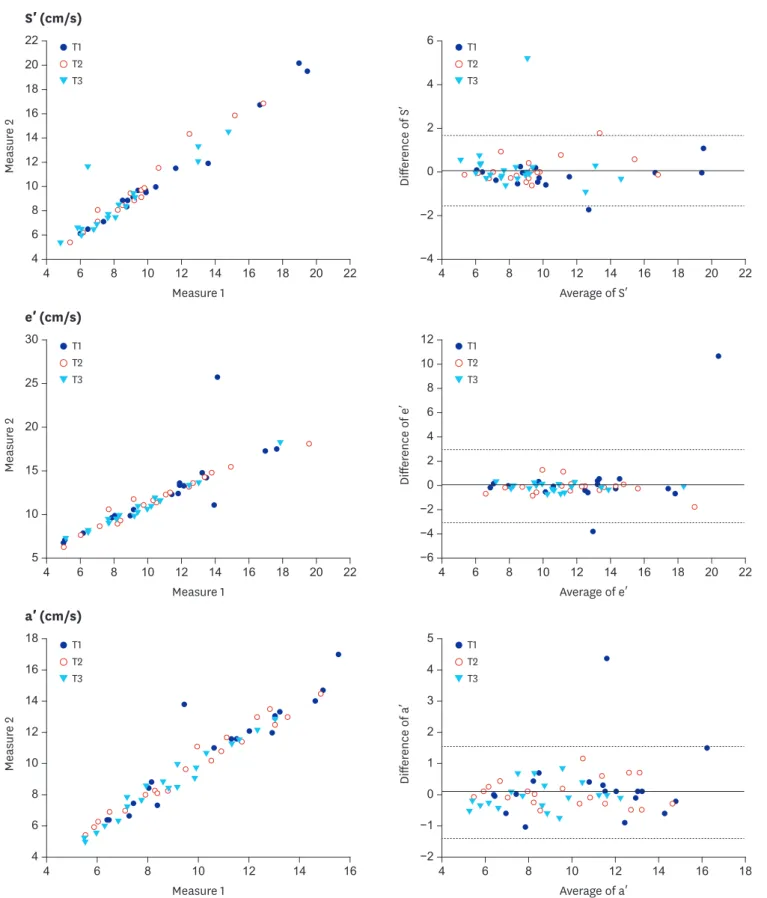
Twenty-five patients were initially recruited, and 5 of them were excluded. Data of 20 patients were finally analyzed (Fig. 1, Table 1). The mean differences between the first and the second measured S′, e′, and a′ values were not significantly different from 0 in Bland-Altman analysis (Fig. 2). The mean agreements (95% LOA) for S′, e′, and a′ were 0.088 (−1.56–1.72), 0.047 (−2.98–3.07), and 0.089 (−1.36–1.54), respectively. Between the first and the second measured values, correlation coefficients were 0.743 for S′, 0.736 for e′, and 0.630 for a′ (all P < 0.001, Fig. 3). The values of intra-class variability of S′, e′, and a′ were 0.966, 0.973, and 0.966, respectively, which indicated acceptable reliability.
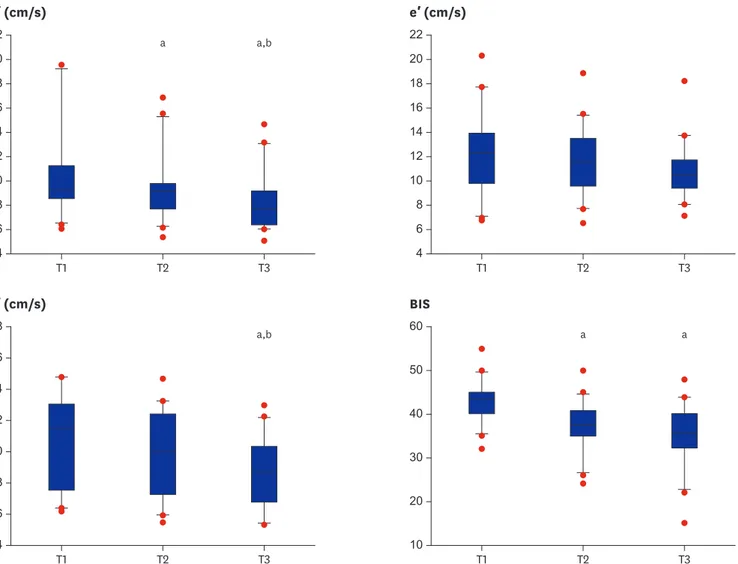
As a primary objective, mean S′ values (95% confidence interval [CI]) at T1, T2, and T3 were 10.5 (8.8–12.2), 9.5 (8.3–10.8), and 8.4 (7.3–9.5) cm/s, respectively, and they were significantly reduced in all increments (P < 0.001 in MANOVA test) with sufficient power (F [3, 17] = 79.598, P < 0.001:
Wilks' Lambda = 0.066, Fig. 3). Mean differences in T1 vs. T2, T2 vs. T3, and T1 vs. T3 were −0.96 (−1.63, −0.32), −1.11 (−1.66, −0.57), and −2.09 (−3.08, −1.09) cm/s, respectively.
Mean values of a′ at T1, T2, and T3 were 10.6 (9.3–12.0), 9.8 (8.5–11.0), and 8.7 (7.7–9.7) cm/s, respectively, and were significantly reduced in T1 vs. T3 and T2 vs. T3 (P < 0.001): mean differences were −1.94 (−3.13, −0.75) and −1.07 (−1.73, −0.41) cm/s, respectively (Fig. 3).
Patients undergoing elective cardiac surgery (n = 25)
Recruited with written informed consent (n = 21)
TDI recordings after sequential exposure to isoflurane 1.0, 1.5, and 2.0 MAC (n = 20)
Off-line analyses of the recorded TDI and TEE data (n = 20) TEE under general anesthesia with isoflurane
1.0 MAC and remifentanil 1.0 µg/kg/min
Contraindication to TEE (n = 0)
BIS > 60 without increasing isoflurane dosage (n = 0) Inability to archive proper TEE alignment for MV annular TDI (n = 1)
Inability to maintain BP 80%–120% of baseline values (n = 0) Inability to maintain HR 45–100 bpm without additional vasoactive drug (n = 0)
Atrial fibrillation/pacemaker implantation (n = 1) Pericardial/myocardial/ischemic disease (n = 3) Infective endocarditis (n = 0)
Mitral valve annular pathology, LVEF < 50% in TTE (n = 0)
Fig. 1. Patient recruitment and analysis diagram. Twenty-one patients were recruited and one was excluded due to the failure to align Doppler beam parallel to the axis of the lateral annular motion during the entire systolic period.
LVEF = left ventricular ejection fraction, TTE = transthoracic echocardiography, TEE = transesophageal
echocardiography, MAC = minimum alveolar concentration, BIS = Bispectral index, MV = mitral valve, TDI = tissue Doppler imaging, BP = blood pressure, HR = heart rate, bpm = beat per minute.
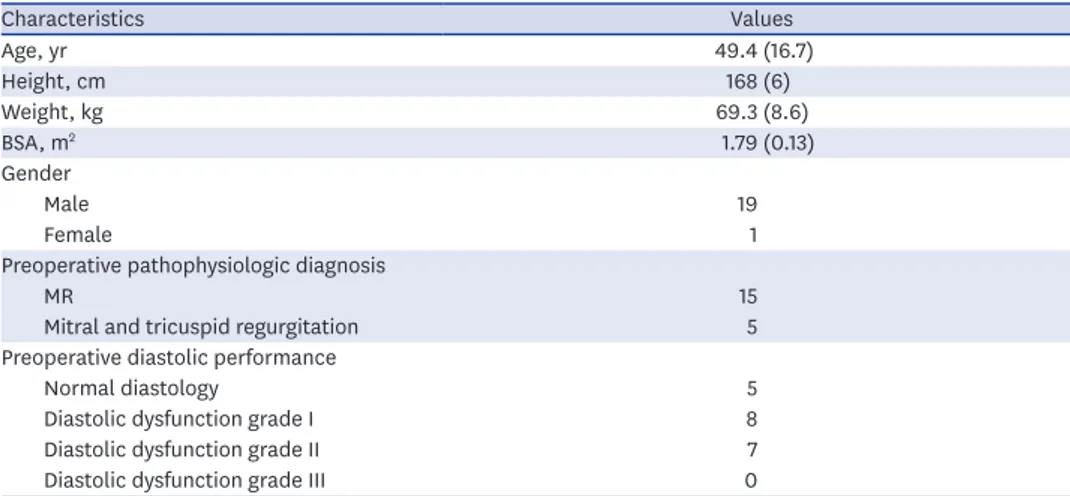
Table 1. Demographic data
Characteristics Values
Age, yr 49.4 (16.7)
Height, cm 168 (6)
Weight, kg 69.3 (8.6)
BSA, m2 1.79 (0.13)
Gender
Male 19
Female 1
Preoperative pathophysiologic diagnosis
MR 15
Mitral and tricuspid regurgitation 5
Preoperative diastolic performance
Normal diastology 5
Diastolic dysfunction grade I 8
Diastolic dysfunction grade II 7
Diastolic dysfunction grade III 0
Values are expressed as means (standard deviation) or the number of patients.
BSA = body surface area, MR = mitral regurgitation.
T1 T2 T3
T1 T2 T3 T1
T2 T3
T1 T2 T3 T1
T2 T3
T1 T2 T3
4 6 8 10 12 14 16 18 20 22 4 6 8 10 12 14 16 18 20 22
4 22 20 18
8 10 12 14 16
6
Measure 2
Measure 1 S′ (cm/s)
−4
−2 6
4
2
ence of SDiffer′ 0
Average of S′
4 6 8 10 12 14 16 18 20 22 4 6 8 10 12 14 16 18 20 22
5 30
25
20
15
10
Measure 2
Measure 1 e′ (cm/s)
−6
Difference of e′
Average of e′ 12
10 8 6
2
−2 0
−4 4
18
8 10 12 14 16
6
4 6 8 10 12 14 16 4 6 8 10 12 14 16 18
4
Measure 2
Measure 1 a′ (cm/s)
−2 5 4 3 2 1
−1 ence of aDiffer′ 0
Average of a′
Fig. 2. Correlation and agreement of the first and second measurements of TDI parameters. Measure 1: first measurements of each variable. Measure 2: second measurements of each variable. The solid line shows the mean difference and the dash lines show the LOAs (mean difference ± 1.96 standard deviations).
TDI = tissue Doppler imaging, S′ = peak velocity of the lateral mitral annulus during systole, e′ = peak velocity of tissue Doppler imaging mitral annulus during early relaxation, a′ = peak velocity of mitral annular TDI during late atrial contraction, LOA = limits of agreement, T1, T2, and T3 = after 10-minute-exposure to isoflurane 1.0, 1.5, and 2.0 MAC, respectively, MAC = minimum alveolar concentration.
Mean values of e′ at T1, T2, and T3 were 12.3 (10.8–13.8), 11.8 (10.5–13.1), and 11.0 (9.9–12.0) cm/s, respectively, and did not show any significant change (P = 0.059) at all increments (Fig. 3).
BIS values at T1, T2, and T3 were 43 (41–45), 37 (35–40), and 35 (32–38) cm/s, respectively, and were significantly reduced at T1 vs. T2 and T1 vs. T3: mean differences were −5.9 (−7.4, −4.4) and
−7.9 (−10.9, −4.8), respectively (Fig. 3).
As shown in Table 2, E, A, and E/e′ did not show any significant change at all increments.
Phenylephrine infusion rate was significantly increased at T1 vs. T2, T2 vs. T3, and T1 vs. T3:
mean differences were 0.26 (0.19–0.33), 0.22 (0.14–0.29), and 0.47 (0.36–0.59) μg/kg/min, respectively. LVEF was significantly reduced in T1 vs. T3: mean difference was −4.45% (−7.52,
−1.38). However, LVEDV, LVESV, and SV did not show any significant change at T1, T2, and T3.
HR, CO, CVP, Ea, SVRI, the severity of MR, and the grades of diastolic function did not show any significant change at all increments.
T3
T1 T2
4 22 20 18
8 10 12 14 16
6
S′ (cm/s)
T3
T1 T2
4 22 20 18
8 10 12 14 16
6
e′ (cm/s)
T3
T1 T2
4 18
8 10 12 14 16
6
a′ (cm/s)
T3
T1 T2
10 60
50
40
20 30
BIS
a,b a
a,b a a
Fig. 3. S′, e′, a′, and BIS during the increments of isoflurane dosage. The boxes show the 25th and 75th percentiles, and horizontal lines within the box show median values. The whiskers show the lowest and highest values in the 25th percentile minus 1.5 IQR and 75th percentile plus 1.5 IQR regions, respectively. The optimal hypnosis level for general anesthesia is a BIS value between 40 and 60.
S′ = peak velocity of the lateral mitral annulus during systole, e′ = peak velocity of tissue Doppler imaging mitral annulus during early relaxation, a′ = peak velocity of tissue Doppler imaging mitral annulus during late atrial contraction, BIS = Bispectral index, IQR = interquartile range, T1, T2, and T3 = after 10-minute- exposure to isoflurane 1.0, 1.5, and 2.0 MAC, respectively, MAC = minimum alveolar concentration.
aP < 0.05 vs. T1; bP < 0.05 vs. T2.
DISCUSSION
In our study, isoflurane increments dose-dependently reduced S′ during remifentanil-based anesthesia in patients with preserved LV systolic function who have undergone cardiac surgery. The changes of S′ was 9.5%–20.0% at isoflurane dosages (1.0–2.0 MAC). This result suggests a possible decline in LV systolic performance, even in the use of clinical dosage of isoflurane. Our result well corresponds to the sevoflurane-induced decline of S′ during the remifentanil-based anesthesia in cardiac surgery patients.5 Considering the bias from the changes in LV loading condition, we increased the phenylephrine infusion rate to maintain BP and attenuate isoflurane-induced dose-dependent vasodilation. The absence of significant changes in CVP, E/e′, LVEDV, Ea and SVRI might support the avoidance of changes in vascular tone and loading condition.
The remifentanil-based anesthesia regimen has several merits including myocardial protective effect in ischemia,21 faster postoperative recovery,22,23 and absence of direct myocardial depressive effect.24 However, remifentanil's lack of hypnotic effect necessitates adjuvant intravenous or volatile anesthetics (hypnotics). Considering the dose-dependent decline of LV systolic performance upon the introduction of intravenous or volatile anesthetics in our study and other studies,3-5 minimizing the dosage of isoflurane may be beneficial for reducing the degree of decline in the LV systolic performance during the concomitant administration of isoflurane to other anesthetic agents, as in isoflurane- supplemented remifentanil-based anesthesia in the present study, especially in patients with reduced myocardial reserve.
Our study and results advocate for the feasibility of S′ for real-time assessment of intraoperative systolic performance during cardiac surgeries.5,25 In most cases, DTI delineation of mitral annular motion by using TEE does not distract the attention of Table 2. Hemodynamic parameters during the isoflurane dosage increments
Parameters T1 T2 T3 P value among
all treatments
Phenylephrine, µg/kg/min 0.04 (0.03–0.05) 0.07 (0.05–0.08)a 0.10 (0.05–0.80)a,b < 0.001
BP, mmHg 77 (72–81) 73 (69–77)a 72 (68–75)a 0.002
PAP, mmHg 18 (17–20) 19 (17–21) 20 (18–22)a 0.018
CVP, mmHg 8 (7–9) 8 (7–9) 9 (7–10) 0.259
HR, beat/min 62 (57–67) 63 (57–68) 64 (59–69) 0.183
SvO2, % 80 (77–82) 81 (78–84) 81 (78–84)a 0.021
CO, L/min/m2 2.4 (2.1–2.7) 2.4 (2.1–2.7) 2.5 (2.1–2.8) 0.952
SVRI, dynes·s/cm5/m2 1,396 (1,162–1,631) 1,345 (1,095–1,596) 1,293 (1,048–1,539) 0.182
E, cm/s 64.8 (55.4–74.2) 67.1 (59.5–74.8) 66.0 (58.8–73.1) 0.660
A, cm/s 46.0 (39.5–52.5) 42.8 (35.5–50.2) 41.8 (34.4–49.2) 0.064
DT, ms 197 (164–231) 185 (153–218) 173 (143–204)a 0.007
E/e′ 5.7 (4.5–6.9) 6.2 (4.9–7.4) 6.4 (5.2–7.5) 0.765
LVEF, % 62 (59–66) 60 (57–62) 58 (54–61)a 0.008
LVEDV, mL 112 (89–135) 112 (90–133) 113 (92–134) 0.964
LVESV, mL 45 (33–56) 48 (37–59) 48 (37–60) 0.391
SV, mL 67 (54–81) 63 (50–77) 65 (53–76) 0.259
Ea, mmHg/mL 0.055 (0.041–0.068) 0.054 (0.040–0.068) 0.059 (0.043–0.074) 0.413
Values are expressed as means (95% confidence interval). T1, T2, and T3: after 10-minute-exposure to isoflurane 1.0, 1.5, and 2.0 MAC, respectively.
BP = blood pressure, PAP = pulmonary arterial pressure, CVP = central venous pressure, HR = heart rate, SvO2 = mixed venous O2 saturation, CO = cardiac output, SVRI = systemic vascular resistance index, MAC = minimum alveolar concentration, e′ = peak velocity of tissue Doppler imaging mitral annulus during early relaxation, E = peak velocity of transmitral Doppler flow during early relaxation, A = peak velocity of transmitral Doppler flow during atrial contraction, DT = deceleration time, E/e′ = ratio of E to e′, LVEF = left ventricular ejection fraction, LVEDV = left ventricle end-diastolic volume, LVESV = left ventricle end-systolic volume, SV = stroke volume, Ea = arterial elastance (systolic BP/SV).
aP < 0.05 vs. T1; bP < 0.05 vs. T2.
cardiac anesthesiologists nor increase their burden.8 The discrepancy in the significant S′
changes, compared to absence of significant change in LVEF during isoflurane increments, 1.0–1.5 MAC, supported the superiority of S′ in detecting small changes in LV systolic function.9,10,26,27
As shown in BIS-guided reduction of anesthetic requirements,28,29 simultaneous monitoring of BIS and S′ may be helpful in finding an appropriate dosage of isoflurane, facilitating optimal depth of hypnosis and reducing dose-dependent decline of LV systolic performance.
In our study, lower S′ and a′ and unnecessarily deep hypnosis (BIS < 40) were noted at higher- dose of isoflurane (1.5–2.0 MAC), in contrast to higher S′ and sufficient hypnosis (BIS 40–60) at lower-dosage (1.0 MAC).
By contrast, despite possible association of type I error in the analyses of variables other than S′, constant e′ and E/e′ suggested the absence of isoflurane-induced changes in the diastolic function. These results corresponded well to those of previous studies performed in healthy volunteers and cardiac surgery patients.3,5 However, the significant decline of a′ in isoflurane increment (14.4% decline at the increment from 1.0 to 2.0 MAC) might suggest a possible reduction in the left atrial (LA) contractile performance at the higher dosage of isoflurane.
This decline can be problematic in terms of aggravating overall LV performance through LA- LV coupling especially in patients with reduced cardiac reserve.
Our study did not determine whether the observed intraoperative S′ decline was sub- clinical, clinically relevant or problematic to increase perioperative risk and outcome. In the meantime, traditional guidelines also have not accounted for anesthetic-induced reduction in intraoperative LV performance, as a negative factor for stratifying perioperative cardiac risks and outcomes in cardiac surgery.30,31 Therefore, our results might be a valuable insight to determine whether anesthesia-induced intraoperative decline of cardiac performance may have to be accounted for planning cardiac surgery or managing patients undergoing cardiac surgery, regardless of its clinical relevancy.
Our study has several limitations. First, S′ values before the administration of isoflurane were not included, since application of TEE was not feasible before establishing general anesthesia.
Second, S′, e′, and a′ are not fully independent to the changes in the LV-loading
condition.32,33 MR flow in moderate to severe degree and vasodilation during the isoflurane increments might affect this bias. However, we excluded patients with the changes in MR degree during the increments and tried to maintain LV loading condition and vascular tone constant by employing extra-volume loading and phenylephrine infusion before and during the study. In addition, we also employed the lateral mitral annular DTI, which is more TEE- compatible and less load-dependent than the medial annular DTI.16,17 Strain with speckle- tracking might be useful in overcoming load- and angle-dependence or site- and dimension- specificity for interrogation.34 However, strain also needs standardization, sophisticated equipment, and vendor specific algorithms for off-line measurements.35
Third, we could not determine the clinical relevancy of S′ decline in our study, because intraoperative S′ values in TEE have not been standardized so far. S′ values indicating the compromised LV systolic performance (≥ 7.5–8.0 cm/s in LVEF ≥ 50% and ≤ 6.7 cm/s in compromised LV function) were determined by using a different modality (TTE, rather than TEE) in previous studies with various conditions.36,37 In addition, use of monoplane
Simpson's method, rather than biplane, for determining LVEF. This might account for interpreting the discrepancy of between S′ and LVEF.
Fourth, due to the lack of correction to adjust their family-wise type I error, most of the positive findings in the secondary outcome measures were not enough to support our interpretation. However, S′, a′, phenylephrine infusion rate and BIS value showed sufficient power supporting our interpretations and conclusions.
In conclusion, our study showed that isoflurane increments of 1.0–2.0 MAC dose- dependently reduce LV systolic long-axis performance during isoflurane-supplemented remifentanil-based anesthesia for patients undergoing cardiac surgery. Further investigations are needed to determine whether this reduction was clinically relevant.
REFERENCES
1. Pagel PS, Kampine JP, Schmeling WT, Warltier DC. Evaluation of myocardial contractility in the chronically instrumented dog with intact autonomic nervous system function: effects of desflurane and isoflurane. Acta Anaesthesiol Scand 1993;37(2):203-10.
PUBMED | CROSSREF
2. Hannon JD, Cody MJ, Sun DX, Housmans PR. Effects of isoflurane and sevoflurane on intracellular calcium and contractility in pressure-overload hypertrophy. Anesthesiology 2004;101(3):675-86.
PUBMED | CROSSREF
3. Yang HS, Song BG, Kim JY, Kim SN, Kim TY. Impact of propofol anesthesia induction on cardiac function in low-risk patients as measured by intraoperative Doppler tissue imaging. J Am Soc Echocardiogr 2013;26(7):727-35.
PUBMED | CROSSREF
4. Yang HS, Kim TY, Bang S, Yu GY, Oh C, Kim SN, et al. Comparison of the impact of the anesthesia induction using thiopental and propofol on cardiac function for non-cardiac surgery. J Cardiovasc Ultrasound 2014;22(2):58-64.
PUBMED | CROSSREF
5. Kwon WK, Sung TY, Yu GY, Sidik H, Kang WS, Lee Y, et al. Effects of sevoflurane increments on left ventricular systolic long-axis performance during sevoflurane-remifentanil anesthesia for cardiovascular surgery. J Anesth 2016;30(2):223-31.
PUBMED | CROSSREF
6. Bergquist BD, Leung JM, Bellows WH. Transesophageal echocardiography in myocardial
revascularization: I. Accuracy of intraoperative real-time interpretation. Anesth Analg 1996;82(6):1132-8.
PUBMED
7. Isaaz K, Thompson A, Ethevenot G, Cloez JL, Brembilla B, Pernot C. Doppler echocardiographic measurement of low velocity motion of the left ventricular posterior wall. Am J Cardiol 1989;64(1):66-75.
PUBMED | CROSSREF
8. Skubas N. Intraoperative Doppler tissue imaging is a valuable addition to cardiac anesthesiologists' armamentarium: a core review. Anesth Analg 2009;108(1):48-66.
PUBMED | CROSSREF
9. Yamada H, Oki T, Tabata T, Iuchi A, Ito S. Assessment of left ventricular systolic wall motion velocity with pulsed tissue Doppler imaging: comparison with peak dP/dt of the left ventricular pressure curve. J Am Soc Echocardiogr 1998;11(5):442-9.
PUBMED | CROSSREF
10. Tabata T, Cardon LA, Armstrong GP, Fukamach K, Takagaki M, Ochiai Y, et al. An evaluation of the use of new Doppler methods for detecting longitudinal function abnormalities in a pacing-induced heart failure model. J Am Soc Echocardiogr 2003;16(5):424-31.
PUBMED | CROSSREF
11. Sohn DW, Chai IH, Lee DJ, Kim HC, Kim HS, Oh BH, et al. Assessment of mitral annulus velocity by Doppler tissue imaging in the evaluation of left ventricular diastolic function. J Am Coll Cardiol 1997;30(2):474-80.
PUBMED | CROSSREF
12. Yu CM, Sanderson JE, Marwick TH, Oh JK. Tissue Doppler imaging a new prognosticator for cardiovascular diseases. J Am Coll Cardiol 2007;49(19):1903-14.
PUBMED | CROSSREF
13. Swaminathan M, Nicoara A, Phillips-Bute BG, Aeschlimann N, Milano CA, Mackensen GB, et al. Utility of a simple algorithm to grade diastolic dysfunction and predict outcome after coronary artery bypass graft surgery. Ann Thorac Surg 2011;91(6):1844-50.
PUBMED | CROSSREF
14. Reichek N, Wilson J, St John Sutton M, Plappert TA, Goldberg S, Hirshfeld JW. Noninvasive determination of left ventricular end-systolic stress: validation of the method and initial application. Circulation
1982;65(1):99-108.
PUBMED | CROSSREF
15. Sunagawa K, Maughan WL, Burkhoff D, Sagawa K. Left ventricular interaction with arterial load studied in isolated canine ventricle. Am J Physiol 1983;245(5 Pt 1):H773-80.
PUBMED
16. Chahal NS, Lim TK, Jain P, Chambers JC, Kooner JS, Senior R. Normative reference values for the tissue Doppler imaging parameters of left ventricular function: a population-based study. Eur J Echocardiogr 2010;11(1):51-6.
PUBMED | CROSSREF
17. Nikitin NP, Witte KK, Thackray SD, de Silva R, Clark AL, Cleland JG. Longitudinal ventricular function:
normal values of atrioventricular annular and myocardial velocities measured with quantitative two- dimensional color Doppler tissue imaging. J Am Soc Echocardiogr 2003;16(9):906-21.
PUBMED | CROSSREF
18. Nickalls RW, Mapleson WW. Age-related iso-MAC charts for isoflurane, sevoflurane and desflurane in man. Br J Anaesth 2003;91(2):170-4.
PUBMED | CROSSREF
19. Bland JM, Altman DG. Statistical methods for assessing agreement between two methods of clinical measurement. Lancet 1986;1(8476):307-10.
PUBMED | CROSSREF
20. Bland JM, Altman DG. Measuring agreement in method comparison studies. Stat Methods Med Res 1999;8(2):135-60.
PUBMED | CROSSREF
21. Wong GT, Li R, Jiang LL, Irwin MG. Remifentanil post-conditioning attenuates cardiac ischemia- reperfusion injury via κ or δ opioid receptor activation. Acta Anaesthesiol Scand 2010;54(4):510-8.
PUBMED | CROSSREF
22. Greco M, Landoni G, Biondi-Zoccai G, Cabrini L, Ruggeri L, Pasculli N, et al. Remifentanil in cardiac surgery: a meta-analysis of randomized controlled trials. J Cardiothorac Vasc Anesth 2012;26(1):110-6.
PUBMED | CROSSREF
23. Lison S, Schill M, Conzen P. Fast-track cardiac anesthesia: efficacy and safety of remifentanil versus sufentanil. J Cardiothorac Vasc Anesth 2007;21(1):35-40.
PUBMED | CROSSREF
24. Bolliger D, Seeberger MD, Kasper J, Skarvan K, Seeberger E, Lurati Buse G, et al. Remifentanil does not impair left ventricular systolic and diastolic function in young healthy patients. Br J Anaesth 2011;106(4):573-9.
PUBMED | CROSSREF
25. Haluska BA, Short L, Marwick TH. Relationship of ventricular longitudinal function to contractile reserve in patients with mitral regurgitation. Am Heart J 2003;146(1):183-8.
PUBMED | CROSSREF
26. Katz WE, Gulati VK, Mahler CM, Gorcsan J 3rd. Quantitative evaluation of the segmental left ventricular response to dobutamine stress by tissue Doppler echocardiography. Am J Cardiol 1997;79(8):1036-42.
PUBMED | CROSSREF
27. Yamada E, Garcia M, Thomas JD, Marwick TH. Myocardial Doppler velocity imaging--a quantitative technique for interpretation of dobutamine echocardiography. Am J Cardiol 1998;82(6):806-9.
PUBMED | CROSSREF
28. Nitzschke R, Wilgusch J, Kersten JF, Trepte CJ, Haas SA, Reuter DA, et al. Bispectral index guided titration of sevoflurane in on-pump cardiac surgery reduces plasma sevoflurane concentration and vasopressor requirements: a prospective, controlled, sequential two-arm clinical study. Eur J Anaesthesiol 2014;31(9):482-90.
PUBMED | CROSSREF
29. Manyam SC, Gupta DK, Johnson KB, White JL, Pace NL, Westenskow DR, et al. When is a bispectral index of 60 too low?: rational processed electroencephalographic targets are dependent on the sedative- opioid ratio. Anesthesiology 2007;106(3):472-83.
PUBMED | CROSSREF
30. Lee TH, Marcantonio ER, Mangione CM, Thomas EJ, Polanczyk CA, Cook EF, et al. Derivation and prospective validation of a simple index for prediction of cardiac risk of major noncardiac surgery.
Circulation 1999;100(10):1043-9.
PUBMED | CROSSREF
31. Fleisher LA, Beckman JA, Brown KA, Calkins H, Chaikof EL, Fleischmann KE, et al. ACC/AHA 2007 guidelines on perioperative cardiovascular evaluation and care for noncardiac surgery: a report of the American College of Cardiology/American Heart Association Task Force on Practice Guidelines (Writing Committee to Revise the 2002 Guidelines on Perioperative Cardiovascular Evaluation for Noncardiac Surgery) developed in collaboration with the American Society of Echocardiography, American Society of Nuclear Cardiology, Heart Rhythm Society, Society of Cardiovascular Anesthesiologists, Society for Cardiovascular Angiography and Interventions, Society for Vascular Medicine and Biology, and Society for Vascular Surgery. J Am Coll Cardiol 2007;50(17):e159-241.
PUBMED | CROSSREF
32. Amà R, Segers P, Roosens C, Claessens T, Verdonck P, Poelaert J. The effects of load on systolic mitral annular velocity by tissue Doppler imaging. Anesth Analg 2004;99(2):332-8.
PUBMED
33. Drighil A, Madias JE, Mathewson JW, El Mosalami H, El Badaoui N, Ramdani B, et al. Haemodialysis:
effects of acute decrease in preload on tissue Doppler imaging indices of systolic and diastolic function of the left and right ventricles. Eur J Echocardiogr 2008;9(4):530-5.
PUBMED | CROSSREF
34. Storaa C, Aberg P, Lind B, Brodin LA. Effect of angular error on tissue Doppler velocities and strain.
Echocardiography 2003;20(7):581-7.
PUBMED | CROSSREF
35. Hanekom L, Cho GY, Leano R, Jeffriess L, Marwick TH. Comparison of two-dimensional speckle and tissue Doppler strain measurement during dobutamine stress echocardiography: an angiographic correlation. Eur Heart J 2007;28(14):1765-72.
PUBMED | CROSSREF
36. Vinereanu D, Khokhar A, Tweddel AC, Cinteza M, Fraser AG. Estimation of global left ventricular function from the velocity of longitudinal shortening. Echocardiography 2002;19(3):177-85.
PUBMED | CROSSREF
37. Alam M, Wardell J, Andersson E, Samad BA, Nordlander R. Effects of first myocardial infarction on left ventricular systolic and diastolic function with the use of mitral annular velocity determined by pulsed wave Doppler tissue imaging. J Am Soc Echocardiogr 2000;13(5):343-52.
PUBMED | CROSSREF