Short-term Predictive Models for Influenza-like Illness in Korea:
Using Weekly ILI Surveillance Data and Web Search Queries
Jae Un Jung
Assistant Professor, Department of Management Information Systems, Dong-A University
한국 인플루엔자 의사환자 단기 예측 모형 개발:
주간 ILI 감시 자료와 웹 검색 정보의 활용
정재운
동아대학교 경영정보학과 조교수
Abstract Since Google launched a prediction service for influenza-like illness(ILI), studies on ILI prediction based on web search data have proliferated worldwide. In this regard, this study aims to build short-term predictive models for ILI in Korea using ILI and web search data and measure the performance of the said models. In these proposed ILI predictive models specific to Korea, ILI surveillance data of Korea CDC and Korean web search data of Google and Naver were used along with the ARIMA model. Model 1 used only ILI data. Models 2 and 3 added Google and Naver search data to the data of Model 1, respectively. Model 4 included a common query used in Models 2 and 3 in addition to the data used in Model 1. In the training period, the goodness of fit of all predictive models was higher than 95% (R2). In predictive periods 1 and 2, Model 1 yielded the best predictions (99.98% and 96.94%, respectively). Models 3(a), 4(b), and 4(c) achieved stable predictability higher than 90% in all predictive periods, but their performances were not better than that of Model 1. The proposed models that yielded accurate and stable predictions can be applied to early warning systems for the influenza pandemic in Korea, with supplementary studies on improving their performance.
Key Words : Korea, Influenza-like Illness, Predictive Model, Machine Learning, Web Search Data
요 약 구글의 인플루엔자 의사환자(ILI) 예측 서비스 시작 이래로 웹 검색 정보를 활용한 ILI 예측 연구들이 급속도로 확산되고 있는 가운데, 본 연구는 ILI 자료와 웹 검색 정보를 활용한 한국 ILI 단기 예측 모형을 개발해 성능을 평가해 보고 자 한다. 한국에 특화된 ILI 예측 모형 개발을 위해 한국질병관리본부의 ILI 감시 자료와 구글 및 네이버의 한국어 검색 정보를 ARIMA 모형과 함께 사용하였다. 모형1은 ILI 자료만 사용하였으며, 모형 2와 3은 모형1에 구글과 네이버의 검색자 료를 각각 추가하였다. 모형4는 모형 2와 3의 공통 검색어를 모형1에 추가하였다. 모형 훈련기간 동안 모든 예측모형들이 95%(R2) 이상의 높은 적합도를 보였으며, 예측기간 1과 2에서 모형1이 가장 우수한 예측력(99.98%, 96.94%)을 보였다. 모형 3(a)와 4(b, c)는 전체 예측기간에서 90% 이상의 안정적인 예측력을 보였지만, 모형1의 성능에는 미치지 못하였다. 본 연구 에서 정확하고 안정적인 예측력을 보인 모형들은 성능개선에 관한 보완적 연구와 더불어 국내 인플루엔자 유행 조기경보 시스템에 활용 가능하다.
주제어 : 한국, 인플루엔자 의사환자, 예측모형, 머신러닝, 웹 검색 정보
*This work was supported by the Ministry of Education of the Republic of Korea and the National Research Foundation of Korea (NRF-2017S1A5A8018867)
*Corresponding Author : Jae Un Jung ([email protected]) Received August 1, 2018
Accepted September 20, 2018
Revised August 27, 2018 Published September 28, 2018
1. Introduction
Since the launch of the web service Google Flu Trends (GFT), which predicts influenza-like illness (ILI) using web search queries correlated to influenza, in the year 2008, Google search query data have attracted considerable attention from the public for predicting epidemics of diseases such as influenza. [1,2].
However, the GFT predictive model, which uses only Google search data, yielded unstable predictions against initial expectations that although weekly ILI surveillance data could be published to the public one or two weeks later, web search queries correlated to influenza might allow for early estimation of ILI [3].
Considering the search variability of correlated web queries, Lazer et al. [4], proposed a complementary modeling approach to obtain better ILI predictions by combining the web search data of GTF (Google) and the ILI surveillance data of Centers for Disease Control and Prevention (CDC) in the United States.
In terms of ILI predictive models specific to Korea, Lee et al. [5] developed monthly ILI prediction models by region using the ILI data of Korea CDC (KCDC) and weights for regional ILI tendency. The goodness of fit of regional ILI predictive models for Seoul and Joenbuk was over 99% (R2).
Considering ILI symptoms (onset of fever higher than 38℃ and cough within the last 10 days) and delays in the publication of ILI surveillance (approximately one or two weeks), weekly predictions are required for preventing the spread of influenza [6,7].
Woo et al. [8] used Daum (Korean portal site) search data for weekly ILI predictions and obtained an accuracy of about 91% (R: 0.956). Kwon et al. [9]
compared a multiple regression model with a logistic regression model using Korean web search queries of Naver (the biggest portal site in Korea) and ILI surveillance data of KCDC. The multiple regression model performed better than the logistic regression model.
Based on previous reviews, herein, it is assumed that a weekly prediction model for ILI in Korea can
provide good predictions using only ILI surveillance data of KCDC, as in the case of the monthly prediction model proposed by Lee et al. [5]. From this assumption, it follows that weekly ILI short-term prediction models can be implemented. When there is room to improve the performance of a naive ILI prediction model, web search queries can be used as complementary predictors in the naive ILI model.
When using web search data for accurate and stable ILI predictions, this study does not limit itself to any one web search engine.
The accuracy and stability of the ILI predictive models should be demonstrated over diverse periods.
Based on these considerations, this study developed four weekly ILI prediction models that employ multiple regression models derived from the autoregressive integrated moving average (ARIMA) model using ILI surveillance data of KCDC, Naver web search data (the biggest portal in Korea), and Google web search data (the biggest in the world).
Model 1 employs only weekly ILI surveillance data.
Model 2 employs Google search query data in addition to the data used in Model 1. Model 3 employs Naver search query data in addition to the data used in Model 1. Model 4 includes web-search-query data using a common query between Models 2 and 3 in addition to the data used in Model 1.
The performance of the predictive models was measured thrice, namely, in the training period and in predictive periods 1 and 2.
In the training period, the goodness of fit of all ILI predictive models was higher than 95% (R2). In predictive periods 1 and 2, Model 1, which yielded the lowest goodness of fit (95.66%) in the training period, yielded the best predictions (99.98% and 96.94%, respectively). Models 3(a), 4(b) and 4(c) (sub-models of Models 3 and 4) showed stable accuracy of more than 90% during predictive periods 1 and 2; however, their accuracies were not higher than that of Model 1.
The proposed ILI-prediction models that yielded accurate and stable predictions can be applied for early
warning systems for the influenza pandemic in Korea with supplementary studies on improving their performances.
2. Model 1: Baseline Predictive Model for Influenza-like Illness in Korea
ILI is defined as an acute respiratory infection with the onset of fever of 38℃ or higher and cough within the last 10 days [6]. ILI surveillance data are expressed in the form of ILI rate (‰) as follows:
× (1)
where IRt denotes ILI rate, IVt is the number of weekly ILI visits, and OPt is the number of weekly outpatients [10]. As mentioned in the Introduction section, ILI data are published with a delay of one or two weeks. Hence, weekly short-term prediction of ILI is helpful for early detection of influenza pandemic.
This study collected ILI data of KCDC from the first week of 2016 to the 26thweek of 2018 (total: 131 weeks;
refer to Table 1) and divided the entire period into three periods: (1) training period (53 weeks in 2016), (2) predictive period 1 (52 weeks in 2017), and (3) predictive period 2 (26 weeks in 2018).
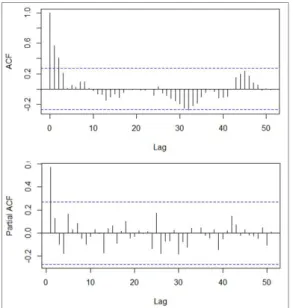
To establish a baseline predictive model (Model 1) for ILI in Korea by using the training dataset (ILI data of 53 weeks in 2016), this study first identified the stationarity of the ILI data from diagnostic plots of the autocorrelation function (ACF) and the partial autocorrelation function (PACF) [11].
In Fig. 1(a), raw ILI data show high variability. To reduce this variability, this study normalized the ILI data via the log transformation (see Fig. 1(b)) and diagnosed stationarity of the logarithmized ILI data with the residuals of the ACF and the PACF. In Fig.
2, PACF presents a sharp cutoff and the lag 1 autocorrelation is positive, i.e., underdifferenced [12].
Thus, this study took the first difference. As a result, ACF tails off with a sinusoidal decay within the blue
Week 2016 2017 2018
1 10.6 39.4 72.1
2 12.1 23.9 69.0
3 13.5 17.0 59.6
4 20.7 12.5 43.6
5 27.2 9.9 35.3
6 41.3 9.0 31.7
7 53.8 7.1 30.7
8 46.1 6.7 18.8
9 43.0 6.1 15.1
10 32.1 7.0 11.7
11 28.8 9.3 9.8
12 30.1 13.1 8.0
13 30.5 13.7 7.2
14 32.0 16.7 6.2
15 28.3 15.8 6.8
16 21.1 14.5 5.8
17 15.4 13.3 7.6
Table 1. Rate of influenza-like illness in Korea (‰)
18 11.8 9.5 6.2
19 7.7 6.8 6.1
20 6.3 7.6 6.0
21 5.9 6.7 5.6
22 5.4 4.9 5.6
23 5.3 5.1 5.1
24 4.5 5.6 4.6
25 5.6 5.7 4.3
26 5.1 5.3 4.1
27 4.8 5.8
28 4.3 6.0
29 5.3 6.3
30 4.7 3.9
31 4.7 4.5
32 5.4 4.4
33 4.2 3.8
34 4.5 5.2
35 4.4 4.8
36 3.8 4.9
37 4.6 5.1
38 3.9 5.1
39 3.9 4.7
40 4.2 3.1
41 3.7 3.8
42 3.7 4.2
43 4.0 4.1
44 4.8 5.2
45 4.2 5.3
46 4.5 6.3
47 5.9 7.7
48 7.3 11.5
49 13.3 19.0
50 34.8 30.7
51 61.8 53.6
52 86.2 71.8
53 63.5 -
※ Retrieved from KCDC [10]
dotted lines of the confidence intervals, while PACF displays a sharp cutoff at lag 1 (see Fig. 3). This result intuitively considers a second-order autoregressive or AR(2) model as Model 1.
For a more precise estimation of Model 1, this study used the auto.arima function in R [13]
Fig. 1. ILI rate in Korea
Fig. 2. ACF and PACF after normalization
Fig. 3. ACF and PACF after differencing
As a result, Model 1 was estimated as ARIMA(1,1,0), which is a first-order autoregressive or AR(1) model with one order of non-seasonal differencing and a constant term [14].
Compared to ARIMA(2,0,0), ARIMA(1,1,0) shows the better goodness of fit in terms of Akaike information criterion (AIC) that a lower value indicates a better fit [15] (see Table 2). Therefore, ARIMA(1,1,0) was selected as the final estimated Model 1. When estimating coefficients of Model 1, the auto.arima function omitted a constant; thus, this study employed the sarima function in R [16] in addition to measuring the AIC values of the models in Table 2 (see Table 3).
Model AIC
ARIMA(2,0,0) -7.85
ARIMA(1,1,0) -8.15
Table 2. Alternative models
Model1
Model ARIMA(1,1,0)
Coefficients AR1 .5809
Constant .0283
Table 3. Estimated ARIMA model
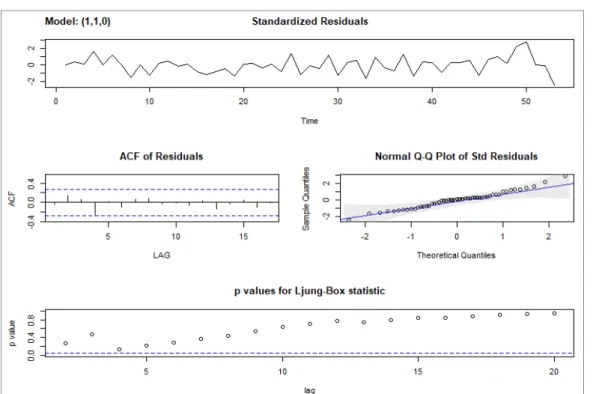
Fig. 4 shows the diagnostic result of Model 1.
Standardized residuals display no particular pattern and autocorrelation residuals are within the confidence intervals. These residuals are normally distributed and all p values are significant.
The following Equation (2) expresses ARIMA(1,1,0).
Here,μis the constant term andφis an autoregressive coefficient [14].
(2)
By pushing Yt-1 to the right side, Ŷ estimated at time t can be represented as Equations (3) and (4) [14].
(3)
(4)
Equation (4) can simply be represented as Equation (5) for Model 1. Here, and are the observed and estimated rate of ILI, respectively.
Model 1: ln ln
ln
(5)
Predictor Unstandardized β
(Std. Error) Standardized β t Sig.
Constant .142(.080) 1.779 .082
ln(Xt-1) 1.604(.116) 1.548 13.871 .000 ln(Xt-2) -.663(.122) -.606 -5.432 .000
R2(Adjusted) .957(.955)
Std. Error of the Estimate .21091 Significance of the Regression
Model .000
Table 4. Estimated coefficients of Model 1
In the present study, SPSS Statistics 25 was employed, and the coefficients of Equation (5) were estimated (see Table 4). The goodness of fit of the estimated Model 1 (Equation (6)) was approximately 96%.
Model1: ln ln
ln
(6)
Fig. 4. Diagnostic plots of Model 1
To identify whether there is room to improve Model 1, this study developed Models 2, 3, and 4 by adding Korean web search query data (predictors) of Google and Naver to Model 1. Models 2 and 3 employ Google and Naver search data, respectively.
3. Predictive Models Using Web Search Data
3.1 Model 2: Using Google Search Data For web search data complementary to Model 1, this study employed a list of 20 Korean keywords (Q1-Q20) associated with influenza created by Kwon et al. [9]
(see Table 5) and retrieved the search frequencies (transformed as relative frequencies on a scale of 0-100) of these 20 words from Google Trends [17].
In the collected Google search queries Q7, Q8, Q9, Q10, Q12, Q14, Q17, Q18, Q19, and Q20, many values were found to be missing, not 0 (zero). These queries were excluded from the Google search dataset.
Keywords Keywords
Q1 독감
(influenza) Q11 독감증상
(symptoms of influenza)
Q2 플루
(flu) Q12 플루증상
(symptoms of flu)
Q3 신종플루
(new flu) Q13 신종플루증상
(symptoms of new flu)
Q4 인플루엔자
(influenza) Q14 인플루엔자증상
(symptoms of influenza)
Q5 A형독감
(influenza A) Q15 A형독감증상
(symptoms of influenza A)
Q6 독감예방
(influenza prevention) Q16 독감치료
(remedy for influenza)
Q7 플루예방
(flu prevention) Q17 플루치료
(remedy for flu)
Q8 신종플루예방
(prevention of new flu) Q18 신종플루치료 (remedy for new flu)
Q9 인플루엔자예방
(influenza prevention) Q19 인플루엔자치료 (remedy for influenza)
Q10 A형독감예방
(prevention of influenza A) Q20 A형독감치료 (remedy for influenza A) Table 5. 20 keywords associated with influenza
In addition, in the remaining queries, those with 0 values were set to 0.000001 (near zero) for successful log transformation, and then, correlation analysis was performed with the ILI data.
As a result, eight query data (Q1, Q2, Q3, Q5, Q11, Q15, and Q16) exhibited significant correlations with the ILI data for 53 weeks in 2016, corresponding to the training period (see Table 6).
Query Correlation Query Correlation
Q1 .403** Q11 .647**
Q2 .525** Q13 .680**
Q3 .482** Q15 .571**
Q5 .867** Q16 .673**
**Correlation is significant at the 0.01 level (2-tailed) Table 6. Correlated Google search queries
These eight queries were added as additional predictors (ln(Qtk)) to Model 1 to obtain Model 2 as follows.
ln ln
ln
ln (7)
Model 2(a) Predictor Unstandardized β
(Std. Error) Standardized β t Sig.
Constant .641(.144) 4.441 .000
ln(Xt-1) 1.382(.116) 1.334 11.930 .000 ln(Xt-2) -.593(.108) -.542 -5.468 .000
ln() .023(.006) .185 3.951 .000
R2(Adjusted) .967(.965)
Std. Error of the Estimate .18467 Significance of the Regression Model .000
Model 2(b) Predictor Unstandardized β
(Std. Error) Standardized β t Sig.
Constant .217(.229) .949 .348
ln(Xt-1) 1.257(.123) 1.214 10.216 .000 ln(Xt-12) -.515(.109) -.471 -4.732 .000
ln() .153(.066) .070 2.314 .025
ln() .025(.006) .208 4.527 .000
R2(Adjusted) .971(968)
Std. Error of the Estimate .17667 Significance of the Regression Model .000 Table 7. Estimated coefficients of Model 2
Models 2(a) and 2(b) were determined via the stepwise method in SPSS Statistics 25. Model 2(a) contained the data of Google search query Q5 in addition to the data in Model 1, and Model 2(b) contained the data of Google search queries Q2 and Q5 in addition to the data in Model 1.
Models 2(a) (96.7%) and 2(b) (97.1%) showed better fit than Model 1 (95.7%) (see Table 7).
Model 2(a): ln ln
ln ln
(8)
Model 2(b): ln ln
ln ln
ln
(9)
3.2 Model 3: Using Naver Search Data
For Model 3, in which Naver search query data were used, this study collected weekly Naver search data of the 20 queries in Table 5 from Naver DataLab [18] and checked the timeline of the collected Naver dataset.
In the Naver query data, a week was counted from Monday to Sunday, but in the ILI data of Korea CDC, a week was counted from Sunday to Saturday.
Therefore, this study collected daily Naver search query data and transformed the data daily into weekly data.
To transform the query data from daily () to weekly ( ), the arithmetic mean method was used as follows. k = {1, 2, ..., 7} means a day of the week (from Sunday to Saturday).
(10)In the collected Naver search queries Q6, Q8, Q9, Q10, Q12, Q14, Q15, Q16, Q18, Q19, and Q20, many missing values were observed. Hence, those queries were excluded from the Naver query dataset.
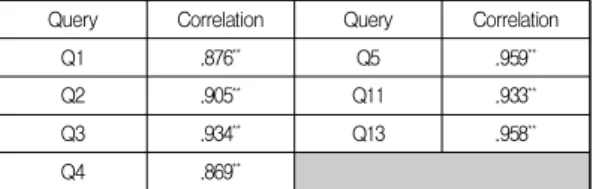
With the transformed weekly Naver query data, this study performed correlation analysis. As a result, Q1, Q2, Q3, Q4, Q5, Q11, and Q13 exhibited high
correlations of over 0.8 with the ILI data in Korea during the 53 weeks in 2016 (see Table 8).
Query Correlation Query Correlation
Q1 .876** Q5 .959**
Q2 .905** Q11 .933**
Q3 .934** Q13 .958**
Q4 .869**
**Correlation is significant at the 0.01 level (2-tailed) Table 8. Correlated Naver search queries
Model 3(a) Predictor Unstandardized β
(Std. Error) Standardized β t Sig.
Constant 1.210(.157) 7.686 .000
ln(Xt-1) .872(.129) .842 6.760 .000
ln(Xt-2) -.270(.101) -.247 -2.681 .010
ln() .164(.023) .402 7.248 .000
R2(Adjusted) .980(.978)
Std. Error of the Estimate .14647 Significance of the Regression
Model .000
Model 3(b) Predictor Unstandardized β
(Std. Error) Standardized β t Sig.
Constant 1.294(.152) 8.534 .000
ln(Xt-1) .839(.122) .810 6.781 .000
ln(Xt-2) -.228(.096) -.209 -2.376 .022
ln() .267(.045) .657 6.002 .000
ln() -.135(.051) -.262 -2.646 .011
R2(Adjusted) .982(.981)
Std. Error of the Estimate .13793 Significance of the Regression
Model .000
Table 9. Estimated coefficients of Model 3
Model 3 (Equation (7)) was obtained using the stepwise method in SPSS Statistics 25. Model 3(a) contained the data of Naver search query Q5 in addition to the data in Model 1, and Model 3(b) contained the data of Naver search queries Q5 and Q11 in addition to the data of Model 1.
Models 3(a) (98.0%) and 3(b) (98.2%) showed better fit than Model 1 (see Table 9).
Model 3(a): ln ln
ln ln
(11)
Model 3(b): ln ln
ln ln
ln
(12)
3.3 Model 4: Using Combined Data
Models 2 and 3 contained Google and Naver search data, respectively. Web search query Q5 was common to Models 2 and 3. From this observation, this study composed additional web search query predictors using Q5 for Model 4.
As a web query predictor, Model 4(a) contained
, which was composed of the arithmetic mean value of Google query Q5 () and Naver query Q5 ( ) used in Models 2 and 3.
Model 4(b) contained and together with the data of Model 1, and Model 4(c) contained all web queries used in Models 2 and 3 (, , , and
).
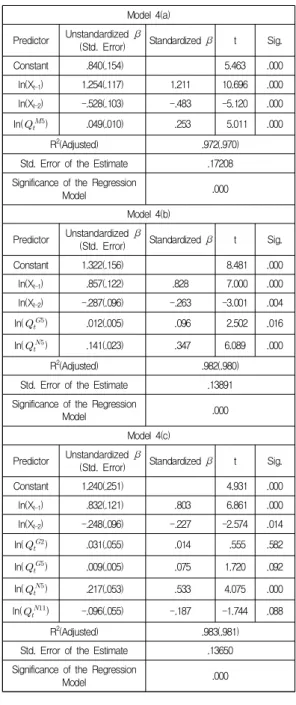
Based on Equation 7, each coefficient in the sub-models of Model 4 (Models 4(a), 4(b), and 4(c)) was estimated, and the values obtained are listed in Table 10.
Compared to Model 1, Models 4(a), 4(b), and 4(c) provided the better fits (97.2%, 98.2%, and 98.3%, respectively).
In the training period, all models for estimating ILI in Korea showed goodness of fit higher than 95%, and Model 4(c) exhibited the best fit (98.3%).
Model 4(a): ln ln
ln ln
(13)
Model 4(b): ln ln
ln ln
ln
(14)
Model 4(c): ln ln
ln ln
ln ln
ln
(15)
Model 4(a) Predictor Unstandardized β
(Std. Error) Standardized β t Sig.
Constant .840(.154) 5.463 .000
ln(Xt-1) 1.254(.117) 1.211 10.696 .000 ln(Xt-2) -.528(.103) -.483 -5.120 .000
ln() .049(.010) .253 5.011 .000
R2(Adjusted) .972(.970)
Std. Error of the Estimate .17208 Significance of the Regression
Model .000
Model 4(b) Predictor Unstandardized β
(Std. Error) Standardized β t Sig.
Constant 1.322(.156) 8.481 .000
ln(Xt-1) .857(.122) .828 7.000 .000
ln(Xt-2) -.287(.096) -.263 -3.001 .004
ln() .012(.005) .096 2.502 .016
ln() .141(.023) .347 6.089 .000
R2(Adjusted) .982(.980)
Std. Error of the Estimate .13891 Significance of the Regression
Model .000
Model 4(c) Predictor Unstandardized β
(Std. Error) Standardized β t Sig.
Constant 1.240(.251) 4.931 .000
ln(Xt-1) .832(.121) .803 6.861 .000
ln(Xt-2) -.248(.096) -.227 -2.574 .014
ln() .031(.055) .014 .555 .582
ln() .009(.005) .075 1.720 .092
ln() .217(.053) .533 4.075 .000
ln() -.096(.055) -.187 -1.744 .088
R2(Adjusted) .983(.981)
Std. Error of the Estimate .13650 Significance of the Regression
Model .000
Table 10. Estimated coefficients of Model4
4. Predictive and Comparative Analysis
To evaluate the predictability of the estimated models, this study computed the coefficient of determination (R2) and root mean squared error
(RMSE). R2represents magnitude of association, and a higher value is better. RMSE denotes prediction errors, and a lower value means more accurate predictions [19,20].
(16)
(17)
The coefficient of determination and RMSE are expressed by Equations (16) and (17), respectively, where X is the observed ILI rate in Korea, denotes the mean of X, and denotes the predicted values.
To measure the accuracy and stability of the ILI predictive models, the 52-week data corresponding to predictive period 1 and the 26-week data corresponding to predictive period 2 were employed in each model.
In predictive period 1, Models 1, 3(a), 4(a), 4(b), and 4(c) showed the predictability higher than 90%. Model 1 exhibited the best performance of 99.98% (RMSE:
0.0107). During predictive period 2, all predictive models except Model 3(b) showed predictability higher than 90%, and Model 1 exhibited the best performance of 96.94% (RMSE: 0.1613; see Table 11).
Model R2 RMSE
Predictive Period 1
Model 1 .9998 .0107
Model 2(a) .8961 .2236
Model 2(b) .8923 .2277
Model 3(a) .9261 .1885
Model 3(b) .8988 .2207
Model 4(a) .8926 .2274
Model 4(b) .9112 .2067
Model 4(c) .9020 .2171
Predictive Period 2
Model 1 .9694 .1613
Model 2(a) .9551 .1953
Model 2(b) .9537 .1983
Model 3(a) .9328 .2390
Model 3(b) .8884 .3078
Model 4(a) .9522 .2015
Model 4(b) .9388 .2280
Model 4(c) .9082 .2792
Table 11. Predictability of models
Consequently, Model 1 was recommended as the most stable and accurate in terms of predictability during the entire predictive period.
Models 3(a), 4(b), and 4(c), too, showed stable predictability higher than 90% during the predictive periods, but not better than Model 1.
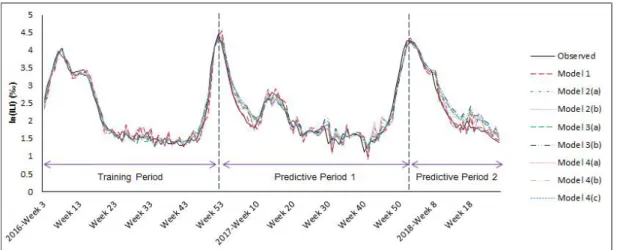
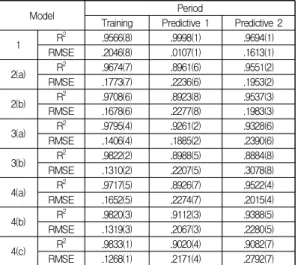
Fig. 5 shows the prediction performance for ILI in Korea by model, and Table 12 summarizes the performance of the predictive models.
Fig. 5. Prediction performance for ILI in Korea by model
Model Period
Training Predictive 1 Predictive 2
1 R2 .9566(8) .9998(1) .9694(1)
RMSE .2046(8) .0107(1) .1613(1)
2(a) R2 .9674(7) .8961(6) .9551(2)
RMSE .1773(7) .2236(6) .1953(2)
2(b) R2 .9708(6) .8923(8) .9537(3)
RMSE .1678(6) .2277(8) .1983(3)
3(a) R2 .9795(4) .9261(2) .9328(6)
RMSE .1406(4) .1885(2) .2390(6)
3(b) R2 .9822(2) .8988(5) .8884(8)
RMSE .1310(2) .2207(5) .3078(8)
4(a) R2 .9717(5) .8926(7) .9522(4)
RMSE .1652(5) .2274(7) .2015(4)
4(b) R2 .9820(3) .9112(3) .9388(5)
RMSE .1319(3) .2067(3) .2280(5)
4(c) R2 .9833(1) .9020(4) .9082(7)
RMSE .1268(1) .2171(4) .2792(7)
※ The number in the round brackets refers to the ranking of model performance
Table 12. Summary of models’ predictability
5. Conclusion
ILI symptoms are similar to those of other epidemic diseases (e.g., fever, cough, etc.). However, if there exist data correlated to ILI, preceding ILI, or concurrent to ILI, a short-term ILI prediction model can be implemented.
In this regard, Google launched a flu (ILI) prediction service by using web search data so-called online big data.
Even though the ILI prediction model of Google failed, adequate potential to predict ILI trends was observed, and it was sufficient to fuel research on ILI predictions by using web search data worldwide.
In addition to this impetus, the Korean government initiated its own efforts toward early prediction and detection of epidemic disease (Korea struggled with the largest outbreak of Middle East Respiratory Syndrome outside the Middle East).
This study developed eight multiple regression models, derived from the ARIMA model, for short-term ILI prediction in Korea by using the ILI surveillance data of KCDC and web search query data of Google and Naver.
As a result, in the training period, all predictive models showed goodness of fit higher than 95%.
During predictive periods 1 and 2, the naive Model 1 using only the ILI data consistently exhibited the best prediction performance (99.98% and 96.94%, respectively).
Models 3(a), 4(b), and 4(c), which employed web search query data in addition to the ILI data, achieved predictability higher than 90% but not better than Model 1 during predictive periods 1 and 2.
For practical application of the proposed models that yielded accurate and stable predictions, follow-up studies on detecting early warning signals from the ILI prediction models are required, in addition to improvement of model performance.
To improve the proposed ILI models with web search data, specially, the overfitting problem due to the addition of web search query predictors to the naive ILI model should be solved.
REFERENCES
[1] Google Flu Trends (Online). https://www.google.org/
flutrends/about
[2] J. Ginsberg, M. H. Mohebbi, R. S. Patel, L. Brammer, M.
S. Smolinski & L. Brilliant. (2009). Detecting Influenza Epidemics Using Search Engine Query Data. Nature, 457, 1012-1014. DOI: 10.1038/nature07634
[3] A. Alessa & M. Faezipour. (2018). A Review of Influenza Detection and Prediction through Social Netweorking Sites. Theoretical Biology & Medical Modelling, 15(1), 2. DOI : 10.1186/s12976-017-0074-5
[4] D. Lazer, R. Kennedy, G. King & A. Vespignani. (2014).
The Parable of Google Flu: Traps in Big Data Analysis.
Science, 343(6176), 1203-1205. DOI: 10.1126/science.1248506 [5] J. S. Lee, S. H. Park, J. W. Moon, J. Lee, Y. G. Park &
Y. K. Roh. (2011). Modeling for Estimating Influenza Patients from ILI Surveillance Data in Korea. Public Health and Research Perspectives, 2(2), 89-93. DOI : 10.1016/j.phrp.2011.08.001
[6] WHO Surveillance Case Definitions for ILI and SARI.
World Health Organization(Online). http://www.who.int/
influenza/surveillance_monitoring/ili_sari_surveillance_case
_definition/en/
[7] H. Archrekar, A. Gandhe & R. Lazarus. (2011).
Predicting Flu Trends using Twitter data. 2011 IEEE Conference on Computer Communications Workshops.
(pp. 702-707). Shanghai : IEEE.
[8] H. Woo, Y. Cho, E. Shim, J. K. Lee, C. G. Lee & S. H.
Kim. (2016). Estimating Influenza Outbreaks Using Both Search Engine Query Data and Social Medical Data in South Korea. Journal of Medical Internet Research, 18(7), e177. DOI : 10.2196/jmir.4955
[9] C. M. Kwon, S. W. Hwang & J. U. Jung. (2014).
Monitoring Seasonal Influenza Epidemics in Korea through Query Search. Journal of the Korea Society for Simulation, 23(4), 31-39. DOI : 10.9709/JKSS.2014.23.4.031 [10] Korea Centers for Disease Control & Prevention
(Online). http://www.cdc.go.kr/CDC/eng/main.jsp [11] G. E. P. Box, G. M. Jenkins, G. C. Reinsel & G. M.
Ljung. (2015). Time Series Analysis: Forecasting and Control. Hoboken : Wiley.
[12] Summary of Rules for Identifying ARIMA Models (Online). https://people.duke.edu/~rnau/arimrule.htm [13] R. Hyundman et al. (2018). Package ‘forecast’. R
Project(Online). https://cran.r-project.org/web/packages/
forecast/forecas t.pdf
[14] Introduction to ARIMA: Nonseasonal Models(Online).
https://faculty.fuqua.duke.edu/~rnau/Decision411_2007/41 1arim.htm#arima110
[15] E. A. Mohammed, C. Naugler & B. H. Far. (2015).
Emerging Trends in Computational Biology, Bioinformatics, and Systems Biology: Algorithms and Software Tools. MA : Morgan Kaufmann.
[16] G. N. Boshnakov & J. Halliday. (2018). Package ‘sarima’.
R Project(Online). https://cran.r-project.org/web/packages/
sarima/sarima.p df
[17] Google Trends(Online). https://trends.google.com [18] Naver DataLab(Online). https://datalab.naver.com/keyword/
trendSearch.naver
[19] D. L. J. Alexander, A. Tropsah & D. A. Winkler. (2015).
Beware of R2: Simple, Unambiguous Assessment of the Prediction Accuracy of QSAR and QSPR Models.
Journal of Chemical Information and Modeling, 55(7), 1316-1322. DOI : 10.1021/acs.jcim.5b00206
[20] T. Chai & R. R. Draxler. (2014). Root Mean Square Error (RMSE) or Mean Absolute Error (MAE)? - Arguments against Avoiding RMSE in the Literature. Geoscientific Model Development, 7, 1247-1250. DOI : 10.5194/
gmd-7-1247-2014
Jung, Jae Un(정재운) [정회원]
▪Feb. 2008 : Dong-A University, M.S. in MIS
▪Oct. 2010 : Dong-A University, Ph.D. in MIS
▪Mar. 2017 ~ Present : Dong-A University, Dept. of MIS, Assistant Professor
▪Research Area : System Dynamics, Advanced Analytics, Logistics Information Systems
▪E-Mail : [email protected]