Effect of Under and Over Refractive Correction on Visual Acuity Performance using Two Different Charts
Ai-Hong Chen*, Siti Salwa Mohamad Shah, and Saiful Azlan Rosli
Dept. of Optometry, Faculty of Health Sciences, Universiti Teknologi MARA (UiTM), 42300 Selangor, Malaysia (Received May 28, 2013: Revised September 2, 2013: Accepted September 14, 2013)
···
Purpose: The purpose of this study was to investigate the effect of under and over refractive correction on visual acuity performance and the variation of the visual performance measurement using two different visual acuity charts. Methods: Ten young adults, aged between 19 and 25 years old, were recruited. Inclusion criteria: no history of ocular injury or pathology with a best-corrected visual acuity of 6/6 on dominant eye. The over and under refractive corrections were induced using minus and plus spherical ophthalmic lenses in 0.50 D steps up to 3.00 D; as well as using three axis orientations of cylindrical ophthalmic lenses (45°, 90° and 180°) in 0.50 D steps. The variation of visual acuity performance measurements was investigated using Bailey-Lovie LogMAR chart and Landolt C chart. Results: The visual acuity changes with lenses were significantly different between two charts [F = 49.15, p < 0.05 with plus spherical ophthalmic lenses and F = 174.38, p < 0.05 with minus spherical ophthalmic lenses]. The visual acuity changes with three different cylindrical axis showed no significant difference between Bailey-Lovie LogMAR chart [F = 2.35, p > 0.05] and Landolt C chart [F = 3.12, p = 0.05].
Conclusions: The over and under refractive correction affected the visual acuity performance differently. The Landolt C chart and Bailey-Lovie LogMAR chart demonstrated variation in measurements.
Key words: Over or under refractive correction, Astigmatism axis correction error, Visual acuity chart, Visual acuity
···
INTRODUCTION
Visual acuity is important in reading, face recognition, identification and detection of objects or road hazards.[1-7]
Uncorrected refractive errors, luminance and contrast sensi- tivity were among factors that were linked to visual per- formance.[8-18] At all luminance and contrast levels, the reduction in visual acuity was greatest for dioptric blur up to 2.0 D, with a more gradual reduction in visual acuity for dioptric blur greater than 2.0 D.[8] Background lumi- nance, contrast and dioptric blur affected the visual acuity and appeared to be additive.[8] However, visual acuity under refractive blur condition showed improvement after 30 minutes of blur adaptation.[19] The effect of dioptric blur on different driving tasks which include road sign recognition showed decrement in road sign recognition as well as increment in total driving time.[6-8] Differences in visual acuity
had been reported when different charts were used to mea- sure the same astigmatism error.[14] Approximately 90%
complained of blurred vision when the axis of induced astig- matic error was at 45° or 90° while 70% complained at 180°.[11]
Visual acuity performance varied with chart designs due to difference in legibility or readability level of the opto- types used in the chart.[20-22] The greater number of opto- types per line contributes to more precise visual acuity estimation with better reliability and repeatability.[21] Letter charts with more optotypes were more easily recognized compared to the broken ring chart.[22] Lea Symbols chart was better for visual acuity measurement in comparison to Bailey-Lovie chart.[2] Lea Symbols chart overestimated Landolt C chart by 1.4 lines on an average.[3] Detection and resolution acuity losses were correlated but poorly.[18]
The effect of dioptric blur on grating and Snellen acuity
*Corresponding author: Ai-Hong Chen, TEL: +60-12-334-7032, Email: [email protected]
showed that grating acuity was less affected by dioptric blur compared to Snellen acuity that was drastically affected by the stimulated dioptric blur.[18] Two diopters of blur reduced the grating acuity from 6/6 to 6/12 while for Snellen acuity, it reduced from 6/6 to 6/36. Accommodation response to blur had been associated with visual acuity measure- ment.[23-24]
The purpose of this study was to investigate the effect of under and over refractive correction on visual acuity performance and the variation of the performance measure- ment using Bailey-Lovie LogMAR chart and Landolt C chart.
MATERIALS AND METHODS
Ten young adults, aged between 19 and 25 years old, were recruited. Inclusion criteria: no history of ocular injury or pathology with a visual acuity of 6/6 on dominant eye with full correction. The refractive error of subjects ranged from plano to −4.00 D, with cylindrical power less than
−2.00 D. All subjects were tested under their respective full prescription that gave visual acuity of 6/6 with maxi- mum plus as the end point of subjective refraction. The induced power by minus or plus spherical lenses was added to the subject's prescription to induce over-correc- tion with minus lenses and under-correction with plus lenses regardless of the original prescription power of the subjects. In other words, measurements for all subjects started at the artificial emmetropic point of each subject.
The over- and under- refractive corrections were induced using minus and plus spherical ophthalmic lenses in 0.50 D steps up to 3.00 D as well as three axis orientations of cylindrical ophthalmic lenses (45°, 90° and 180°) in 0.50 D steps. The variation of visual acuity performance measure- ments was investigated using Bailey Lovie LogMAR chart and Landolt C chart. Baseline visual acuity reading for each subject was recorded with plano lenses (pl). Defocus spherical ophthalmic lenses and defocus cylindrical oph- thalmic lenses ranging from +3.00 D to 3.00 D and −0.50 D to −3.00 D respectively, in steps of 0.50 D were induced monocularly on the dominant eye. In each induced astig- matism lens, three different orientations of axis (45°, 90°
and 180°) were introduced.
Bailey-Lovie LogMAR chart and Landolt C chart were used to measure the visual acuity with a series of defocus
lenses. The visual acuity measurement was tested at 4 m for the Bailey-Lovie LogMAR chart; and at 6 m for the Landolt C chart. The charts were tested under the respec- tive recommended distance based on the manufacturing design and construction because the heights of alphabets were calibrated according to the recommended distances.
The outcome or findings would be easier to associate with real clinical setting of respective charts by eye care practi- tioners.
RESULTS
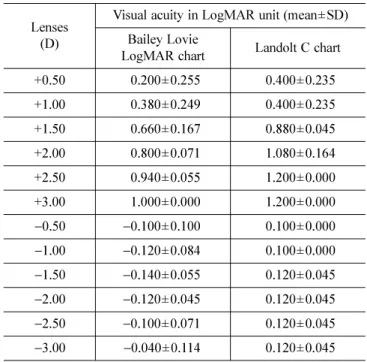
Bailey Lovie LogMAR chart and Landolt C chart showed significant difference in visual acuity measurement with plus spherical ophthalmic lenses (F = 49.15, p < 0.001) and minus spherical ophthalmic lenses (F = 174.38, p < 0.05).
There was no significant difference between axis 45°, 90°, and 180° for both Bailey Lovie LogMAR chart (F = 2.35, p > 0.05) and Landolt C chart (F = 3.12, p = 0.05).
For Bailey Lovie LogMAR chart, one way ANOVA showed that there were significant differences of visual acuity esti- mates with different power of plus spherical ophthalmic lenses (F = 13.67, p < 0.001); but no significance difference of visual acuity estimates with different power of minus spheri- cal ophthalmic lenses (F = 0.72, p = 0.64). Post-hoc analysis
Table 1. Comparison of visual acuity performance on a series of plus and minus spherical ophthalmic lenses between Bailey-Lovie and Landolt Charts
Lenses (D)
Visual acuity in LogMAR unit (mean±SD) Bailey Lovie
LogMAR chart Landolt C chart
+0.50 0.200±0.255 0.400±0.235
+1.00 0.380±0.249 0.400±0.235
+1.50 0.660±0.167 0.880±0.045
+2.00 0.800±0.071 1.080±0.164
+2.50 0.940±0.055 1.200±0.000
+3.00 1.000±0.000 1.200±0.000
−0.50 −0.100±0.100 0.100±0.000
−1.00 −0.120±0.084 0.100±0.000
−1.50 −0.140±0.055 0.120±0.045
−2.00 −0.120±0.045 0.120±0.045
−2.50 −0.100±0.071 0.120±0.045
−3.00 −0.040±0.114 0.120±0.045
with Tukey for plus sphere lenses showed that visual acu- ity was significantly different with p < 0.05.
For Landolt C chart, one way ANOVA showed similar changing patterns as Bailey Lovie LogMAR chart where there were significant differences of visual acuity esti- mates with different power of plus spherical ophthalmic lenses (F = 48.477, p < 0.001), but no significant differ- ence of visual acuity estimates with different power of minus spherical ophthalmic lenses (F = 0.88, p = 0.53). Post-hoc analysis with Tukey for plus sphere lenses showed that visual acuity was significantly different with p < 0.05.
DISCUSSION
The over and under refractive correction affected visual acuity performance. The comparison of Landolt C chart and Bailey Lovie LogMAR chart in visual acuity measure- ments revealed variation in spherical lenses, but not in cylindrical lenses. The finding was consistent with find- ings in previous studies on the variation in visual acuity measurement due to difference in chart design.[20-22] The difference in visual acuity estimates for different types of charts might be due to difference in legibility or readabil- ity level of the optotypes that were used in the chart.[4] In
this study, the gap of the letter ‘C’ in Landolt C chart might be hard to distinguish in comparison to the optotypes used in the Bailey-Lovie LogMAR chart that was constructed by many letters so that the blur images could easily be distinguished due to shape clues. The construction of the total optotypes numbers and the constant spacing of opto- types were among the possible explanations why the Bailey Lovie LogMAR chart revealed better visual acuity in comparison to Landolt C chart.[2-4,12,21] Optically, when astigmatism was induced by the different axis with differ- ent diopters of lens in this study, it might lead to the for- mation of two focal points, which are tangential and sagittal rays. Within the astigmatic eye, the intersection of the refracted pencil with the retina formed an ellipse, a circle or a straight line. The higher the dioptric power in astig- matism, the farther apart these two points become (tangen- tial and sagittal). At the same time, there is an increased distance interval of Sturm, and the circle of least confu- sion (CLC) will also increase in size. In both stimulation conditions of plus and minus lenses, the points between these two rays located at the anterior and posterior of the macula location; therefore the blur images might be simi- lar in both charts.
As the visual acuity changed with induced lens power, both charts showed significant changes with plus spherical ophthalmic lenses but not with minus spherical ophthalmic lenses. This might be due to the accommodation factor where the eyes were required to relax in order to see clearly with the plus lenses. Compared to plus lens, minus lens stimu- lated the accommodation. It was more difficult to relax the accommodation than to stimulate the accommodation.[23-24]
Although there was no significant difference in visual acu- ity changes with minus lenses, the variation of visual acu- ity was not constant especially at −2.00 D and −2.25 D.
This might be due to the fluctuation of accommodation response. The significant difference found on plus spheri- cal ophthalmic lens might be due to the inability of the crystalline lens to re-focus the optical point back to the macula. Stimulation with a higher power of plus lens, a more anterior displacement of the optical point in relation to the macula location would occur.[25] Therefore, a more blurred image might be projected to the visual cortex, which resulted in reduction of visual acuity measurements in both charts. A study by Otte &Young [26] found that plus lens decreased around 51% on accommodation response Table 2. Comparison of visualacuity performanceon a series
of cylindrical ophthalmic lenses byusing Bailey LovieLogMAR chart and Landolt C chart
Lenses (D)
Visual acuity in LogMAR unit (mean±SD)
45° 90° 180°
Bailey Lovie LogMAR chart
−0.50 0.020±0.110 0.000±0.071 0.000±0.071
−1.00 0.100±0.071 0.020±0.084 0.100±0.071
−1.50 0.320±0.148 0.200±0.141 0.260±0.114
−2.00 0.420±0.239 0.320±0.228 0.420±0.192
−2.50 0.500±0.245 0.360±0.230 0.580±0.268
−3.00 0.286±0.307 0.214±0.283 0.286±0.320 Landolt C chart
−0.50 0.300±0.100 0.240±0.152 0.280±0.295
−1.00 0.380±0.084 0.420±0.130 0.400±0.274
−1.50 0.660±0.055 0.660±0.055 0.520±0.130
−2.00 0.800±0.122 0.800±0.000 0.660±0.182
−2.50 0.860±0.055 0.860±0.055 0.740±0.207
−3.00 0.900±0.000 0.900±0.000 0.820±0.084
stimulation due to variability subject accommodation parame- ter. However, when the eyes were stimulated by the minus spherical ophthalmic lens, the optical point would be dis- placed further than the location of the macula (behind the macular), thus naturally the crystalline lens could be re- focused back on the macula to produce clear retinal image.[25]
Gwiazda et al.[23] found that the magnitude of accommoda- tion response was less in minus lens-induced than plus lens- induced blur. The best visual acuity measurement would not change because of the ability of the eye to respond to the increased demand of accommodation (due to the posi- tive versus negative fusional reserve) to maintain the focusing magnitude at the macula.[27] Keating[28] described the concept of accommodative demand between hyperopes and myopes. The corrected hyperopes or the emmetropes who were induced with minus lens had higher accommodation demand than the corrected myopes or the emmetropes who were induced with plus lens. When the stimuli were at a constant distance, the minus lens might stimulate more accommodation than the plus lens. This might explain the insignificant changes in visual acuity with the minus lenses. Even though the concept of accommodation is well established, the effect and application were not discussed in relation to the optical properties that happened in the eye in previous studies.[25,27,28]
This study was a part of research projects that linked to the investigation of road signs in Malaysia. Our focus was on the effect of the legibility of the signal board interpreta- tion if there were any changes on the accommodation stimu- lus. The stimulation with plus and minus spherical ophthalmic lenses mimic the conditions of the accommodation prob- lem, such as accommodation spasm or insufficiency, or any disease that could influence the accommodation func- tion.[29] The Bailey Lovie LogMAR and Landolt C charts was chosen because the sign board features are usually a combination of letters and shapes. Letters used in Bailey Lovie LogMAR were more relevant to road signs that are widely used to show the location, stop signal, warning sig- nal, speed limit and temporary signs in construction areas.
The stimulation in Landolt C testing focused more on the determination of the location on gaps, which might be more relevant to usage in school area signs, obstacle signs and contraction signs. The difference between the two charts is important to represent the real view of signboard patterns at roads or railways.
CONCLUSIONS
The legibility distance due to reduction in visual acuity affects the performance in the eye-hand coordination in maneuvering the vehicle, especially in high-speed zones.[30]
Under or over correction could be due to wrong prescrip- tion given by untrained personnel or due to changes caused by eye diseases. Wrong prescription in adults might affect the quality of life through symptoms such as nau- sea, headaches, eye strain, blurriness and etc. Symptoms, especially eye strain and blurriness, were reported by the majority of subjects when exposed to a series of plus and minus spherical ophthalmic lenses. Eye strain associated with blur adaptation might remain due to a blurred image of overcorrection (nearsighted) or under correction (farsighted), which might cause the eyes to be unable to achieve a relaxed state. For optometrists who provide consultation for pri- mary eye care especially for clients who are still actively involved in driving, these findings will provide some insights to advise how prescriptions might affect visual perfor- mance in relation to driving.[6-8] This study could be enhanced and explored further by using larger sample size and using real road sign as stimulation targets.
ACKNOWLEDGEMENTS
This study was supported by 600-RMI /ST/ DANA 5/3/
Dst (375/2011).
REFERENCES
[1] Chung ST, Jarvis SH, Cheung SH. The effect of dioptric blur on reading performance. Vision Research. 2007;
47(12):1584-1594.
[2] Dobson V. Maguire M, Orel-Bixler D, Quinn G, Ying GS, Visual auity results in school-aged children and adults:
Lea Symbols chart versus Bailey-Lovie chart. Optm Vis Sci. 2003;80(9):650-654.
[3] Grf M. Becker R. Determining visual acuity with LH symbols and Landolt rings. Klinische Monatsbltter fr Augenheilkunde. 1999;215(2):86-90.
[4] Grimm W, Rassow B, Wesemann W, Saur K, Hilz R.
Correlation of optotypes with the Landolt ring-a fresh look at the comparability of optotypes. Optom Vis Sci.
1994;71(1):6-13.
[5] Hazel CA, Elliott DB. The dependency of logMAR visual acuity measurements on chart design and scoring rule.
Optom Vis Sci. 2002;79(12):788-792.
[6] Higgins KE, Wood J, Tait A. Vision and driving: selective effect of optical blur on different driving tasks. Human Factors. The J Hum Factors. 1998;40(2):224-232.
[7] Johnson CA. Vision requirements for driver's license examiners. Optom Vis Sci. 2005;82(8):779-789.
[8] Johnson CA, Casson EJ. Effects of luminance, contrast, and blur on visual acuity. Optom Vis Sci. 1995;72(12):
864-869.
[9] Mann DL, Abernethy B, Farrow D. The resilience of nat- ural interceptive actions to refractive blur. Human move- ment science. 2010;29(3):386-400.
[10] Miller AD, Kris MJ, Griffiths AC. Effect of small focal errors on vision. Optom Vis Sci. 1997;74(7):521-526.
[11] Ohlendorf A, Tabernero J, Schaeffel F. Visual acuity with simulated and real astigmatic defocus. Optom Vis Sci.
2011;88(5):562-569.
[12] Raasch TW. Spherocylindrical refractive errors and visual acuity. OptomVis Sci. 1995;72(4):272-275.
[13] Radhakrishnan H, Pardhan S, Calver RI, O'Leary DJ.
Unequal reduction in visual acuity with positive and neg- ative defocusing lenses in myopes. Optom Vis Sci. 2004;
81(1):14-17.
[14] Remon L, Tornel M, Furlan WD. Visual acuity in simple myopic astigmatism: Influence of cylinder axis. Optom Vis Sci. 2006;83(5):311-315.
[15] Rossi EA, Weiser P, Tarrant J, Roorda A. Visual perfor- mance in emmetropia and low myopia after correction of high-order aberrations. J of Vis. 2007;7(8):14.
[16] Seidel D, Gray LS, Heron G. The effect of monocular and binocular viewing on the accommodation response to real targets in emmetropia and myopia. Optom Vis Sci.
2005;82(4):279-285.
[17] Smith G, Jacobs RJ, Chan CD. Effect of defocus on visual acuity as Measured by source and observer methods.
Optom Vis Sci. 1989;66(7):430-435.
[18] Thorn F, Schwartz F. Effects of dioptric blur on Snellen and grating acuity. Optom Vis Sci. 1990;67(1):3-7.
[19] Cufflin MP, Mankowska A, Mallen EA. Effect of blur
adaptation on blur sensitivity and discrimination in emmetropes and myopes. Invest Ophthalmol & Visual Sci. 2007;48(6):
2932-2939.
[20] Chen AH, Norazman FN. and Buari NH. Comparison of visual acuity estimates using three different letter charts under two ambient room illuminations. Ind J of Ophthal- mol. 2012;60(2):101-104.
[21] Raasch TW, Bailey IL, Bullimore MA. Repeatability of visual acuity measurement. Optom Vis Sci. 1998;75(5):
342-348.
[22] Van den Brom H, Kooijman A, Blanksma L, Van Rij G.
Measurement of visual acuity with two different charts; a comparison of results and repeatability in patients with cataract. Documenta ophthalmologica. 1995;90(1):61-66.
[23] Gwiazda J, Thorn F, Bauer J, Held R. Myopic children show insufficient accommodative response to blur. Invest Ophthalmol & Visual Sci. 1993;34(3):690-694.
[24] Subbaram MV, Bullimore MA. Visual acuity and the accuracy of the accommodative response. Ophthalmic and Physiological Optics. 2002;22(4):312-318.
[25] Charman WN. The eye in focus: accomodation and pres- byopia. Clinical & Experimental Optometry. 2008;91(3):
207-225.
[26] Goss DA, Otte N, Young J. Accommodative responses under binocular conditions with various amounts of plus add. Journal of Behavioral Optometry. 2011;22(3):64.
[27] Anderson HA, Glasser A, Stuebing KK, Manny RE.
Minus lens stimulated accommodative lag as a function of age. Optom Vis Sci. 2009;86(6):685-694.
[28] Keating MP. Thin lens eye models. In: Geometric, physi- cal, and visual optics, 2nd Ed. St. Louis: Butterworth-Hei- nemann, 2002;85-87.
[29] Cacho Martnez P, Garca Muoz A, Ruiz-Cantero MT. Treat- ment of accommodative and nonstrabismic binocular dys- functions: a systematic review. Optometry. 2009;80(12):
702-716.
[30] Lerner N, Singer J, Jenness J. Safer drivers. Vanasse Hangen Brustlin. 2010;3:1-51.