DOI https://doi.org/10.7845/kjm.2018.8044 eISSN 2383-9902 Copyright ⓒ 2018, The Microbiological Society of Korea
Inferring transmission routes of avian influenza during the H5N8
outbreak of South Korea in 2014 using epidemiological and genetic data
Sang Chul Choi*
Department of Biotechnology, Sungshin Women's University, Seoul 01133, Republic of Korea
역학과 유전학적 데이터를 이용한 한국에서 2014년 발생한 H5N8 조류독감 전염경로의 유추
최상철*
성신여자대학교 지식서비스공과대학 바이오생명공학과
(Received July 9, 2018; Revised August 5, 2018; Accepted August 21, 2018)
*For correspondence.
E-mail: [email protected];Tel.: +82-2-920-2751; Fax: +82-2-920-2047
Avian influenza recently damaged the poultry industry, which suffered a huge economic loss reaching billions of U.S. dollars in South Korea. Transmission routes of the pathogens would help plan to control and limit the spread of the devastating biological tragedy. Phylogenetic analyses of pathogen’s DNA sequences could sketch transmission trees relating hosts with directed edges. The last decade has seen the methodological development of inferring transmission trees using epidemiological as well as genetic data. Here, I reanalyzed the DNA sequence data that had originated in the highly pathogenic avian influenza H5N8 outbreak of South Korea in 2014. The H5N8 viruses spread geographically contiguously from the origin of the outbreak, Jeonbuk. The Jeonbuk origin viruses were known to spread to four provinces neighboring Jeonbuk. I estimated the transmission tree of the host domestic and migratory wild birds after combining multiple runs of Markov chain Monte Carlo using a Bayesian method for inferring transmission trees. The estimated transmission tree, albeit with a rather large uncertainty in the directed edges, showed that the viruses spread from Jeonbuk through Chungnam to Gyeonggi. Domestic birds of breeder or broiler ducks were estimated to appear to be at the terminal nodes of the transmission tree. This observation confirmed that migratory wild birds played an important role as
one of the main infection mediators in the avian influenza H5N8 outbreak of South Korea in 2014.
Keywords: genomic epidemiology, influenza virus, Markov chain Monte Carlo, transmission tree
Seasonal influenza led to the deaths of tens or hundreds of
thousands of children younger than five years in 2008 alone
worldwide (Nair et al., 2011). Avian influenza viruses have
been posing a significant threat to human public health because
they might adapt to humans, which could be a devastating flu
pandemic (de Jong et al., 1997; Reperant et al., 2012). World
Health Organization recognized the importance of genotyping
influenza viruses almost half a century ago (World Health
Organization, 1971). Since then, influenza viruses isolated
from birds have been described to carry a combination of 18
hemagglutinin (HA) and 11 neuraminidase (NA) subtypes
(Chanock et al., 1972; Hinshaw et al., 1979; Fouchier et al.,
2005; Ku et al., 2014). Some of the subtypes can be highly
pathogenic that could devastate the poultry industry and
potentially public health. Highly pathogenic avian influenza
(HPAI) viruses would carry H5 and H7 subtypes among the
possible combinations of the two subtypes (Alexander, 2007).
Fig. 1. Map of South Korea. Names of the six provinces of South Korea are Jeonbuk (JB), Jeonnam (JN), Chungbuk (CB), Chungnam (CN), Gyeonggi (GG), and Gyeongnam (GN). The closed circles in the six regions are the coordinates of latitude and longitude.
The HPAI H5N1 viruses appeared in Asia in 1996 (Li et al., 2004). It persistently spread to South East Asia, Western Europe, and Africa (Sonnberg et al., 2013). The H5N1 outbreaks prompted surveillance efforts in countries of South East Asia including Indonesia between 2008 and 2010 (Mahardika et al., 2016), Vietnam between 2007 and 2010 (Nguyen et al., 2012), Bangladesh between 2010 and 2011 (Osmani et al., 2014), and Cambodia in 2011 (Theary et al., 2012). European countries also suffered from the H5N1 outbreaks; e.g., the Czech Republic in 2007 (Nagy et al., 2009) and Europe between 2005 and 2010 (Alkhamis et al., 2015).
The HPAI N5N1 also damaged the poultry industry in South Korea (Kim et al., 2012) and Japan (Sakoda et al., 2012) during the winter season between 2010 and 2011. These outbreaks prompted more strict surveillance of the HPAI N5N1 viruses in both countries (Kwon et al., 2011; Uchida et al., 2012).
The first H5N1 outbreak in South Korea led to an epidemic in poultry in 2003 and 2004 following the outbreaks of HPAI N5N1 in countries around the world (Liu et al., 2005). The
avian influenza virus subtypes diverged into other strains in South Korea (Kim et al., 2017a). The subtype H5N8 devastated the poultry industry in South Korea in 2014 (Shin et al., 2015) although the HPAI H5N1 outbreaks in South Korea prompted more strict HPAI virus surveillance (Baek et al., 2010; Kang et al., 2010). The year 2014 outbreak of H5N8 viruses originating in Jeonbuk, a southwestern province of South Korea (Fig. 1). It spread the H5N8 HPAI viruses into neighbors towards north and south of the origin (Jeong et al., 2014; Hill et al., 2015).
The subtype H5N8 also reappeared in Korea during the H5N6 HPAIV outbreak between 2016 and 2017 (Kim et al., 2017b).
Migratory wild birds in South Korea would follow the East Asian-Australasian Flyway (Olsen et al., 2006). There was evidence of reassortant between North American and Korean lineages, suggesting that migratory wild birds might deviate from the usual flyway (Lee et al., 2011). As migratory wild birds played an essential role in the occurrence of H5N1 HPAI viruses in Asia (Tian et al., 2015), they also appeared to play a vital role in the spread of the H5N8 HPAI viruses in South Korea in 2014 (Jeong et al., 2014).
Pathogens of avian influenza viruses and their hosts of domestic and migratory birds evolve together, often sharing evolutionary trajectories during infectious disease outbreaks.
Tracking the transmission route of pathogens through the hosts is of epidemiological importance because the route would clue epidemiologists in about the distribution of infectious diseases and possibly the etiology of it. A network of infection paths represents which hosts transmit pathogens to which other hosts. Simpler forms of such a network can be a multifurcating tree. Such a simple tree is called a pathogen transmission tree, which maps who infected whom (Didelot et al., 2017). Trans- mission trees may inform on the intertwined epidemiological relationship of infected hosts. Such transmission trees connect hosts infected by genetically similar pathogens although hosts themselves may not be genetically related. Thus, one may indirectly infer the transmission route between hosts based on a phylogenetic tree that relates pathogen’s genetic sequences.
Inferring the transmission route of pathogens, unfortunately,
has often been neglected partly because of the lack of biological
sequences with epidemiological data and also partly because of
methodological underdevelopment for such data. I consider
these two reasons in the next two paragraphs.
The paucity of epidemiological data has hindered epide- miologically informative approaches to tracking transmission routes of pathogens with genetic data. Epidemiological studies based on biological sequences would hardly benefit from sequence data alone (Didelot et al., 2014). Biological sequence data should come with matching sampling dates and locations, allowing to interpret pathogen sequence evolution epide- miologically. However, it should be noted that National Center for Biotechnology Information (NCBI) and the Global Initiative on Sharing Avian Influenza Data (GISAID; Shu and McCauley, 2017) allow the access to biological sequences with epidemiological data for researchers from various fields in genomic epidemiology. Sampling and, more importantly, sharing epidemiological and genetic data together warrant further development of such data management in the future.
Methods of tracking pathogen transmission routes used the techniques of molecular phylogenetics (Cottam et al., 2008).
Geographic visualization of the phylogenetic tree of pathogens would illuminate the spread of infectious diseases (Janies et al., 2007). The phylogenetic approach tried to interpret pathogens’
evolutionary patterns as a surrogate transmission tree. However, pathogen’s evolutionary trees are not a transmission history (Ypma et al., 2013). Pathogens evolve at least in two distinct modes along the transmission tree connecting hosts. First, pathogens would undergo within-host evolution after they infected hosts, of which the adaptive immune system would act as selective pressure on the pathogens’ evolution. Second, pathogens could evolve as they passed through different hosts of a population. The population-wise host immunities would shape the evolution of a pathogen population. Methods for inferring the transmission tree of hosts should consider the two different modes of pathogen evolution. To tease apart the different modes of within-host and between-host evolution needed more than biological sequence data alone. Thus, methods for inferring transmission trees considered biological sequences and epidemiological data together (Morelli et al., 2012; Pybus et al., 2012; Ypma et al., 2013).
Recently, Hall et al. (2015) noted that a host transmission tree could be a partition of the collection of a phylogenetic tree’s nodes. They set up Markov chain Monte Carlo (MCMC) moves of a phylogenetic tree that respect the node partitions in the transmission tree under the framework of Bayesian
Evolutionary Analysis Sampling Trees (BEAST; Drummond et al., 2012; Bouckaert et al., 2014). The MCMC moves consisted of three MCMC operators; infection branch operator, phylogeny operator, and infection times. Two of these operators are worth mentioning because they allowed for a joint sampling of phylogenetic and transmission trees. First, infection branch operator moves the partition of a phylogenetic tree with the phylogeny fixed. Second, because BEAST carried out a few phylogeny operators that may not respect a proposed transmission tree, Hall’s method implemented a phylogeny operator that respected partitions of phylogenetic tree’s nodes.
They considered three models in building a probabilistic procedure; the first one for transmission, the second one for within-host evolution, and the last for pathogen’s sequence evolution. Parameters of interest in the first model for trans- mission include the base transmission rate and the functional relationship between two hosts. The base transmission rate determines the base-level speed of the pathogen transmission.
The functional relationship between two hosts defines the force of infection between hosts. The second model for within-host evolution uses a deterministic model. The BEAST package provides a variety of the third sequence evolution models. Most notably, Hall’s method is implemented in the BEAST package that can be readily used without many technical difficulties.
Additionally, one of the exceptions for the paucity of epide- miological data is the study of the H5N8 HPAI virus outbreak in South Korea in 2014 (Jeong et al., 2014). Statistical genetic methods were already started to be applied to such kind of data for the epidemiological study (Hill et al., 2015). Similarly, I take the opportunity of the readily applicable method and available epidemiological data to investigate epidemiological inferences with the power of a statistical genetic method.
Here, I will show a case study of inferring transmission trees
(Hall et al., 2015) based on the DNA sequence data published
with epidemiological data such as sampling dates and locations
(Jeong et al., 2014). I will address the following questions with
a transmission tree estimate. Could such a method of inferring
transmission trees confirm the importance of the role of
migratory wild birds in the outbreak? Could I provide more
evidence telling on the possible transmission path of the H5N8
avian viruses spreading through South Korea in 2014? I will
also discuss parameters of the first infection date and infected
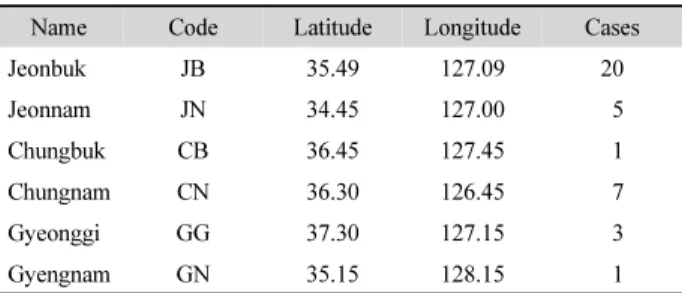
Table 1. The six provinces of South Korea analyzed for transmission tree inference
Name Code Latitude Longitude Cases
Jeonbuk JB 35.49 127.09 20
Jeonnam JN 34.45 127.00 5
Chungbuk CB 36.45 127.45 1
Chungnam CN 36.30 126.45 7
Gyeonggi GG 37.30 127.15 3
Gyengnam GN 35.15 128.15 1
Each province is referred by a two-letter code. The representative location for a province is denoted by a latitude and longitude coordinate. The avian viral sampling size for each province is given at the last column named Cases.
periods that are estimated along with the transmission tree parameter in the statistical method.
Materials and Methods
Data collection: viral DNA sequences, alignment, and sampling locations
I collated the DNA sequences published by Jeong et al.
(2014) using NCBI’s influenza virus database. They sampled the avian influenza virus sequences from 18 domestic ducks and chickens and 19 wild birds. The avian influenza viruses contain eight parts of the viral genome sequences. I followed the approach of Hill et al. (2015), concatenating three segments of PB2, HA, and NA. I aligned the 37 concatenated sequences using MUSCLE (Edgar, 2004). The multiple sequence alignment of the viral DNA sequences was of 5475 nucleotides long. The DNA sequence alignment varied not much, leaving 83 site patterns. Each sequence came with sampling date. I used sampling locations described by Jeong et al. (2014); Jeonbuk, Jeonnam, Chungbuk, Chungnam, Gyeonggi, and Gyenognam (Fig. 1). A coordinate of the longitude and latitude specifies a location of the six provinces (Table 1). Each host was examined once to sample a single viral DNA sequence.
Epidemiological data preparation for BEAST analysis I used an evolutionary software package called BEAST (Drummond et al., 2012; version 1.8.4), inferring the transmission tree of the domestic and migratory wild bird hosts
using viral DNA sequences and epidemiological data (Hall et al., 2015). The method of inferring transmission trees uses sampling locations and times as well as genetic data (BEASTLIER. Retrieved 2018, May 28. from https://github.
com/mdhall272/beastlier). It is worth noting the two types of input data for Hall’s method. First, the epidemiological data table includes a list of a host individual, the date when the host became noninfectious, and the locations in latitude and longitude. The spatial coordinate of a host’s sampling region specifies the location of a bird host (Table 1). I used a province-level representative sampling location for each viral sample, and refer interested readers to Fig. 1 of Jeong et al.
(2014) for the rough sampling locations of the 37 viral genotype data. Second, I prepared a taxon data table where three columns were the host used in the epidemiological data, a pathogen identifier used as a sequence identifier in the multiple sequence alignment, and pathogen’s sampling date.
Hall’s method was known to allow multiple pathogen sampling from a single host. I assumed that each avian influenza virus was sampled only once from a host. The date in the epide- miological data table was only for future use at the time of the analysis. Each sampling date of the taxon data table was equal to the date of the epidemiological data table for each host.
Transmission tree inference: priors and MCMC setups
Hall’s method assumes three models as described in the
section of Introduction. For the model for transmission, I used
the logistic kernel for the prior for the function of the distance
between two hosts. The prior distribution of the infectious
period was chosen to be the normal distribution, Normal (mu,
1/tau), with Normal (10, 1/(tau ․ 100)) for the unknown mean
value of mu and gamma hyperprior of Gamma (1, 1) for the
unknown precision value of tau. The prior for the latent periods
was set to a gamma distribution of Gamma (200, 100) where the
first value was the shape parameter and the second one was the
rate parameter. For the sequence evolution model, I assumed
the HKY model with site heterogeneity of gamma and invariant
sites for the pathogen’s DNA sequence evolution. I chose the
uncorrelated relaxed clock with log-normal distribution for the
molecular clock model. With the prior setup of the MCMC run,
I carried out 50 independent MCMC runs to make sure that the
Markov chains converged to stationarity. The BEAST’s MCMC
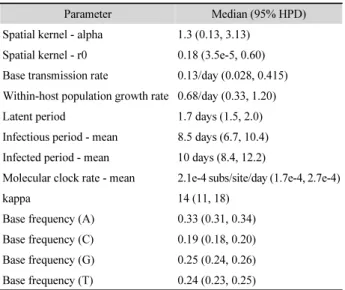
Table 2. The parameter estimates of the transmission tree inference using genetic and epidemiological data
Parameter Median (95% HPD)
Spatial kernel - alpha 1.3 (0.13, 3.13) Spatial kernel - r0 0.18 (3.5e-5, 0.60) Base transmission rate 0.13/day (0.028, 0.415) Within-host population growth rate 0.68/day (0.33, 1.20)
Latent period 1.7 days (1.5, 2.0)
Infectious period - mean 8.5 days (6.7, 10.4) Infected period - mean 10 days (8.4, 12.2)
Molecular clock rate - mean 2.1e-4 subs/site/day (1.7e-4, 2.7e-4)
kappa 14 (11, 18)
Base frequency (A) 0.33 (0.31, 0.34) Base frequency (C) 0.19 (0.18, 0.20) Base frequency (G) 0.25 (0.24, 0.26) Base frequency (T) 0.24 (0.23, 0.25)
runs took 3.4 days on average. The tracer plot of posterior for all the BEAST runs suggested the convergence of the MCMC chains (Tracer. Retrieved 2018, June 10. from http://tree.bio.
ed.ac.uk/software/tracer/). I combined the results using the LogCombiner BEAST utility to ensure at least 150 of the effective sample sizes for the parameters shown in Table 2. I used the BEAST package component of FigTree to display the estimated pathogen’s phylogeny (Fig. 2).
Transmission tree summary
The BEAST runs with BEASTLIER subpackage produced a posterior sample of scalar values, phylogenetic trees, and transmission trees. I used a python script of “MPCTree.py”
provided by BEASTLIER to summarize the combined collection of the posterior samples of transmission trees in a maximum parent credibility (MPC) transmission tree (Hall et al., 2015). The summary of transmission trees was a multi- furcating tree with a root named “Start”. Edges of the posterior summary transmission tree were labeled with posterior prob- abilities denoting the uncertainty in transmission trees. The BEAST software family often came with auxiliary software packages including Tracer, FigTree, and others that were available at http://beast.community/. Instead of using one of the BEAST software family, I used a network visualization tool of Cytoscape (Shannon et al., 2003; Retrieved 2018, May 28.
from http://cytoscape.org) for displaying transmission trees as
employed by Hall et al. (2015). The summary of transmission trees was produced in a comma-separated values (CSV) file with three columns; Child, Parent, and MPC credibility. I imported a network from the CSV file and modified it to aesthetically lay out the transmission tree with transmission uncertainties (Fig. 3).
Results
The inferred phylogenetic tree of the viral DNA sequences relates the HPAI H5N8 viruses (Fig. 2). The small amount of variability in the viral DNA sequences resolves internal nodes of the phylogenetic tree. Although the phylogenetic tree relates the viruses, I could interpret it epidemiologically by presuming that each virus was the host examined to sample the viral DNA sequence of the virus. The phylogenetic tree divides into two groups almost evenly. The upper subtree has a group of hosts originating in Jeonbuk near the root. The host birds group by matching regions. Hosts originating in Gyeonggi form a clade.
Hosts originating in Chungnam and Jeonnam also appear to group as each own clade. Some of the branch lengths from hosts in Jeonbuk are smaller than some of those from hosts in Gyeonggi, Chungnam, and Jeonnam. It might indicate that the H5N8 outbreak originated in Jeonbuk. The lower subtree contains mostly hosts in Jeonbuk. A few hosts in Chungnam, Chungbuk, and Gyeongnam are dotted across the lower subtree. The lower subtree also has the longer branches from the non-Jeonbuk origin hosts than those from the Jeonbuk origin hosts. The pattern of branch lengths in both subtrees appears to confirm that the outbreak started at Jeonbuk and spread to the other provinces. However, the phylogenetic tree, which does not allow for determining which hosts transmitted viruses to which other hosts, displays the viral evolutionary pattern not the transmission route.
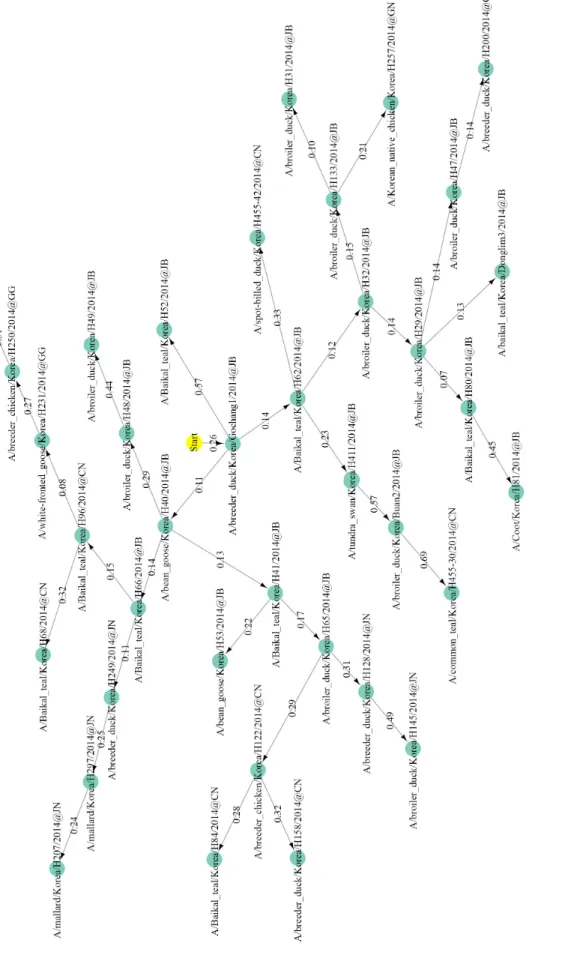
The posterior samples of the transmission tree were combined to produce a maximum parent credibility (MPC) transmission tree (Fig. 3). Posterior probabilities of the directed edges of the transmission tree are smaller compared with those on the internal nodes of a typical phylogenetic tree Bayesian estimate.
The acceptance rate of transmission tree parameter in the
MCMC runs is low (0.08 and 0.007 for transmission tree
Fig. 2. Bayesian estimate of the phylogenetic tree of the avian influenza viral DNA sequences sampled from the H5N8 outbreak of South Korea in 2014. The phylogenetic tree relates the viral DNA sequences. Tips at the external node are labelled host names that each consists of the virus name and a region code separated by at sign. The region codes are JB for Jeonbuk, JN for Jeonnam, CB for Chungbuk, CN for Chungnam, GG for Gyeonggi, and GN for Gyeongnam.
Fig. 3. Transmission tree of the bird hosts examined during the H5N8 outbreak of South Korea in 2014. The tree consists of nodes and directed edges. The nodes represent host birds examined to sample viral DNA sequences. The arrows are the directed edges. The tree with directed edges begins with the node named “Start.”
exchange operator type A and B, respectively) compared with other parameters’ acceptance rates, which are roughly in the range of 20 percent (0.23 for nucleotide equilibrium frequencies).
The low acceptance rate of the transmission tree parameter may mean that the posterior distribution of transmission tree is a rugged landscape with many local valleys and peaks because of multiple maxima, suggesting a considerable uncertainty in the transmission tree. The multiple MCMC chains employed in the current study should be able to capture the common pattern in the transmission tree. Therefore, I combined multiple MCMC chains to grasp the average picture of transmission tree instead of having a few transmission tree estimates.
The transmission tree of the bird hosts shows a few patterns of node locations, suggesting the importance of migratory wild birds’ role as the transmission vehicle of the South Korea outbreak in 2014 (Fig. 3). First, for instance, the hosts originating in Jeonbuk are situated mostly in the internal nodes in the transmission tree. The host of “A/Baikal_teal/Korea/
H52/2014@JB” is of genetic group type B. The transmission tree divides into two subtrees by “A/breeder_duck/Korea/
Gochang1/2014@JB,” which is of genetic group type B. Two hosts, originating in Jeonbuk, of “A/bean_goose/Korea/H40/
2014@JB” and “A/Baikal_teal/Korea/H62/2014@JB” are the roots of the two subtrees and appear to transmit the avian influenza viruses to the other hosts originating in Jeonnam. The host of “A/broiler_duck/Korea/H65/2014@JB” also appears to have passed the viruses to the hosts in Chungnam. The hosts of “A/Baikal_teal/Korea/H66/2014@JB” and “A/Baikal_teal/
Korea/H62/2014@JB” appear to carry the viruses on the hosts in Chungnam as well. Each host of “A/breeder_duck/Korea/
H200/2014@CB” and “A/Korean_native_chicken/Korea/H257/
2014@GN” are estimated to have received the viruses from hosts originating in Jeonbuk. The hosts of “A/Baikal_teal/
Korea/H66/2014@JB” and “A/broiler_duck/Korea/H65/2014@
JB” appear to have carried the viruses on the hosts in Jeonnam.
Groups of migratory wild birds would travel in time, which would likely give rise to a consistent transmission pattern from Jeonbuk to each province. Second, domestic birds of broiler and breeder ducks are estimated to be located mostly in the terminal nodes. On the contrary, migratory wild birds tend to be near the root of the transmission tree. This location pattern of domestic and migratory birds might confirm that migratory
wild birds arrived in South Korea, carrying the HPAI H5N8 viruses along with them before passing the deadly pathogens on the domestic birds.
The first infection time is estimated to be at January 5th, 2014 with the 95% HPD between January 2nd and 9th. The host of “A/bean_goose/Korea/H40/2014@JB” is estimated to be the root of a transmission subtree, splitting off the genetic group type B, “A/breeder_duck/Korea/Gochang1/2014@JB.”
The host H40 was sampled on January 19th, 2014, and is estimated to be infected on January 10th, 2014. The host H40’s infected period is estimated to be eight days with 95% HPD ranging from 3.5 to 13 days. The host of “A/Baikal_teal/
Korea/H62/2014@JB,” being the root of another transmission subtree, was sampled at January 21st, 2014, and is estimated to be infected at January 10th, 2014. The host H62’s infected period is estimated to be ten days with 95% HPD ranging from 6.1 to 15 days.
Discussion
Here, I have inferred the transmission tree of avian influenza H5N8 viruses that devastated poultry farms of South Korea in early 2014 using Hall’s method developed under the frame- work of the phylogenetic software BEAST package. The estimated transmission tree confirms the importance of migratory wild birds as the main player of the HAPI H5N8 outbreak of South Korea in 2014. The outbreak is estimated to originate in the virus sample from migratory wild birds of
“A/Baikal_teal/Korea/ H62/2014@JB” and “A/bean_goose/
Korea/H40/2014@JB” about ten days earlier than the sampling.
The outbreak, then, spread towards the north and the south of Jeonbuk as described by Jeong et al. (2014). Overall, the inferred transmission route similarly follows the progress of the outbreak reported in Jeong et al. (2014). The current study of transmission tree inference provides three more refined aspects of the disease outbreak: a more resolved phylogenetic tree, possible transmission routes, and the first infection date.
First, the phylogenetic tree estimated with the transmission tree
resolves internal nodes better than those of the previous study
as shown in Fig. 2 in Jeong et al. (2014). It may be partly
because the phylogenetic tree of the current study respects the
node partitions in the transmission tree, and partly because the phylogenetic tree is inferred by using epidemiological as well as genotypic data. Second, the transmission tree may inform of the infection route of H5N8 HPAIV outbreak of South Korea in 2014. Consider two viral samples that are genetic group type B:
“A/breeder_duck/Korea/Gochang1/2014@JB” and “A/Baikal_
teal/Korea/H52/2014@JB” with 0.57 of posterior probability on the directed edge (Fig. 3). The two viral samples should be connected not just because pathogenic viruses were passed on from one to the other, but because they shared much of genotypes. Most of the posterior probabilities on the trans- mission tree edges tend to be low, indicating that the edges may have high uncertainty. The edge connecting the viral samples, Gochang1 and H52, that are of the same genetic group often occurred in the posterior sample of transmission trees. Thus, being guided by the posterior probability of 0.57 on the transmission tree edge, I find edges that are as likely to occur in the posterior sample as that of the two hosts of Gochang1 and H52 above. Three host birds are related by transmission edges:
“A/tundra_swan/Korea/H411/2014@JB” through “A/broiler_
duck/Korea/Buan2/2014@JB” with 0.57, and to “A/common_
teal/Korea/H455-30/2014@CN” with 0.69 of posterior prob- ability. This may suggest that the wild bird of tundra swan passed pathogenic viruses through other host birds, reaching the common teal. There are other pairs of nodes with posterior probability greater than 0.4: “A/breeder_duck/Korea/H128/
2014@JN” to “A/broiler_duck/Korea/H145/2014@JN” with 0.49, “A/broiler_duck/Korea/H48/2014@JB” to “A/broiler_
duck/Korea/H49/2014@JB” with 0.44, and “A/Baikal_teal/
Korea/H80/2014@JB” to “A/Coot/Korea/H81/2014@JB” with 0.45. These may indicate that the two hosts were geo- graphically proximal to each other because they were sampled in the same province. Third, Jeong et al. (2014) described the progress of the HPAI outbreak from January 16th to May 8th, 2004 in three phases. No first infection dates were reported in Jeong et al. (2014). The transmission tree inference provides an estimate of the first infection date of the outbreak. The point estimate is January 5th, 2014, and the 95% HPD ranges from January 2nd and 9th. The first infection date estimate roughly coincides with the arrival of the migratory wild birds.
Most of the estimated transmission trees from a single MCMC chain had high posterior probabilities on the directed
edges while the transmission tree summarized from the combined multiple MCMC runs had low probabilities ranging from 0.07 to 0.69 on mission tree topology (Fig. 3). It suggested that the transmission tree summary for a single MCMC chain might stay in one of the local maxima along the landscape of the transmission tree distribution. Thus, it should be cautious to interpret the result of the estimated transmission tree. However, I observed a few patterns in the estimated transmission tree.
First, the domestic birds such as breeder duck or broil duck were mostly situated at the terminal areas of the transmission tree, whereas many wild birds in the transmission tree were in the internal nodes. Second, the transmission tree shows a dispersal of H5N8 viruses following the geographically neighboring regions. For instance, the avian viruses are likely to have been carried along from Jeonbuk through Chungnam to Gyeonggi. However, I cannot rule out the possibility of rather a direct dispersal of H5N8 avian viruses from Jeonbuk to each of the five provinces considered here in the analysis because of the high uncertainty in the directed edges of the transmission tree. Besides, because the area of South Korea is small enough for migratory birds to fly to any resting places easily, the avian viruses during the H5N8 outbreak in 2014 might have been transmitted by the migratory birds.
The analysis that I applied Hall’s method to the viral DNA sequence data has potential limitations in interpreting the results with the estimates. First, a sampling of the avian viruses was unbalanced among the six provinces considered here in the analysis. Most of the hosts were sampled at Jeonbuk, and a smaller number of hosts were sampled at the other provinces.
This unbalanced sampling may force the samples of Jeonbuk to be at the center of the transmission tree. Second, the method assumed that I observed all of the hosts in infectious disease outbreaks, and consequently it ignored the unsampled hosts.
Unsampled hosts may mislead about interpretation of the
results because the unsampled hosts could be in between
sampled hosts in the transmission tree. Other unsampled hosts
may exist between sampled hosts, inferring a directed edge
between the two samples mistakenly. Third, geographical
locations of the sampling were not accurate because I used
fictitious locations for the six provinces. More precise
sampling locations might provide better interpretation of the
transmission tree. Fourth, avian influenza viruses were sampled
only once per host because of lack of data, not because of incapability of Hall’s method. Multiple sampling might increase the transmission signal at the expense of computational time.
Here, I examined the usage of inferring transmission trees of avian influenza virus sampled during the H5N8 outbreak of South Korea in 2014 using the pathogen DNA sequences and epidemiological data such as sampling locations and times. I found that the inference of transmission trees was possible at the cost of computing power for executing and combining multiple MCMC runs while a single MCMC run might produce one of the local maxima in the transmission tree distribution.
The transmission tree inferred with epidemiological data of sampling locations and times provided the patterns and direction of transmission routes that were hard to obtain with the phylogenetic tree of pathogen’s genetic data. The surveillance of infectious diseases would greatly benefit from the readily available transmission trees of infected hosts. However, genetic data alone would achieve only a marginal goal of such surveillance. Therefore, epidemiological data of sampling locations and times should be available for improving epidemiological studies based on genetic data. The future study of genomic epidemiology using genetic and epidemiological data will be more beneficial to better surveillance of infectious diseases.
적 요
최근 양계업에 막대한 피해를 끼치는 조류독감은 한국에서 수천억원의 거대한 경제적 손실을 초래하였다. 병원균의 전염 경로를 파악할 수 있다면 막대한 손해를 끼치는 생물학적 피 해의 확산을 막고 일부 지역으로 제한하는데 큰 도움이 될 것 이다. 병원균 DNA 서열의 계통학적인 분석을 통하여 감염된 숙주들을 방향성이 있는 연결선으로 연관짓는 전염 계통수를 얻을 수 있다. 지난 10여년간 유전적 데이터뿐만 아니라 역학 데이터를 이용한 전염 계통수 추론의 방법론적 발전이 이루어 졌다. 이에, 본 연구에서는 전염 계통수 추론 방법을 이용하여 지난 2014년 한국에 발병한 고병원성 조류독감 H5N8에서 유 래한 DNA 서열을 재분석하였다. 당시, H5N8 바이러스는 전 라북도에서 시작하여 지역적으로 접해있는 4개의 지역으로 확산되어 나갔던 것으로 알려져 있다. 전염 계통수를 추론하 는 베이지언 통계 방법인 Markov chain Monte Carlo를 반복적
으로 시행하고 이를 종합하여 철새 외래종과 국내종 조류 숙 주들의 전염 계통수를 추정하였다. 비록 연결선의 불확실성은 높았으나 추정된 전염 계통수를 통하여 당시 H5N8 바이러스 는 전라북도에서 시작하고 충청남도를 거쳐 경기도로 퍼져나 간 것을 확인할 수 있었다. 사육하는 오리와 같은 국내종 조류 는 전염 계통수의 말단 노드에 위치하는 것으로 추정되었다.
이러한 결과를 통하여 야생 철새종이 2014년 한국의 H5N8 조 류독감의 감염 매개자로 주된 역할을 하였다는 것을 재확인하 였다.
Conflict of Interest
The author has no financial conflict of interest.
Acknowledgements
I thank the reviewers for valuable comments and suggestions that helped improve the manuscript. This research was supported by Basic Science Research Program through the National Research Foundation of Korea (NRF) funded by the Ministry of Education (2015R1D1A1A02062381/1).
References
Alexander DJ. 2007. An overview of the epidemiology of avian influenza. Vaccine 25, 5637–5644.
Alkhamis MA, Moore BR, and Perez AM. 2015. Phylodynamics of H5N1 highly pathogenic avian influenza in Europe, 2005-2010:
potential for molecular surveillance of new outbreaks. Viruses 7, 3310–3328.
Baek YH, Pascua PNQ, Song MS, Park KJ, Kwon HI, Lee JH, Kim SY, Moon HJ, Kim CJ, and Choi YK. 2010. Surveillance and characterization of low pathogenic H5 avian influenza viruses isolated from wild migratory birds in Korea. Virus Res. 150, 119– 128.
Bouckaert R, Heled J, Kühnert D, Vaughan T, Wu CH, Xie D, Suchard MA, Rambaut A, and Drummond AJ. 2014. BEAST 2: a software platform for Bayesian evolutionary analysis. PLoS Comput. Biol. 10, e1003537.
Chanock RH, Cockburn WC, Davenport FM, Dowdle WR, de St Groth SF, Fukumi H, Kilbourne ED, Schild GC, Schulman JL, Sohier R, et al. 1972. A revised system of influenza virus nomenclature:
A report of the WHO study group on classification. Virology 47,
854–856.
Cottam EM, Thébaud G, Wadsworth J, Gloster J, Mansley L, Paton DJ, King DP, and Haydon DT. 2008. Integrating genetic and epidemiological data to determine transmission pathways of foot-and-mouth disease virus. Proc. R Soc. B 275, 887–895.
de Jong JC, Claas ECJ, Osterhaus ADME, Webster RG, and Lim WL.
1997. A pandemic warning? Nature 389, 554.
Didelot X, Fraser C, Gardy J, and Colijn C. 2017. Genomic infectious disease epidemiology in partially sampled and ongoing outbreaks. Mol. Biol. Evol. 34, 997–1007.
Didelot X, Gardy J, and Colijn C. 2014. Bayesian inference of infectious disease transmission from whole-genome sequence data. Mol. Biol. Evol. 31, 1869–1879.
Drummond AJ, Suchard MA, Xie D, and Rambaut A. 2012. Bayesian phylogenetics with BEAUti and the BEAST 1.7. Mol. Biol. Evol.
29, 1969–1973.
Edgar RC. 2004. MUSCLE - a multiple sequence alignment method with reduced time and space complexity. BMC Bioinformatics 5, 113.
Fouchier RAM, Munster V, Wallensten A, Bestebroer TM, Herfst S, Smith D, Rimmelzwaan GF, Olsen B, and Osterhaus ADME.
2005. Characterization of a novel influenza A virus hemagglutinin subtype (H16) obtained from black-headed gulls. J. Virol. 79, 2814–2822.
Hall M, Woolhouse M, and Rambaut A. 2015. Epidemic recon- struction in a phylogenetics framework: transmission trees as partitions of the node set. PLoS Comput. Biol. 11, e1004613.
Hill SC, Lee YJ, Song BM, Kang HM, Lee EK, Hanna A, Gilbert M, Brown IH, and Pybus OG. 2015. Wild waterfowl migration and domestic duck density shape the epidemiology of highly pathogenic H5N8 influenza in the Republic of Korea. Infect.
Genet. Evol. 34, 267–277.
Hinshaw VS, Webster RG, and Rodriguez RJ. 1979. Influenza A viruses: combinations of hemagglutinin and neuraminidase subtypes isolated from animals and other sources. Arch. Virol.
62, 281–290.
Janies D, Hill AW, Guralnick R, Habib F, Waltari E, and Wheeler WC.
2007. Genomic analysis and geographic visualization of the spread of avian influenza (H5N1). Syst. Biol. 56, 321–329.
Jeong J, Kang HM, Lee EK, Song BM, Kwon YK, Kim HR, Choi KS, Kim JY, Lee HJ, Moon OK, et al. 2014. Highly pathogenic avian influenza virus (H5N8) in domestic poultry and its relationship with migratory birds in South Korea during 2014. Vet. Microbiol.
173, 249–257.
Kang HM, Jeong OM, Kim MC, Kwon JS, Paek MR, Choi JG, Lee EK, Kim YJ, Kwon JH, and Lee YJ. 2010. Surveillance of avian influenza virus in wild bird fecal samples from South Korea, 2003-2008. J. Wildl. Dis. 46, 878–888.
Kim HK, Jeong DG, and Yoon SW. 2017a. Recent outbreaks of highly pathogenic avian influenza viruses in South Korea. Clin. Exp.
Vaccine Res. 6, 95–103.
Kim HR, Lee YJ, Park CK, Oem JK, Lee OS, Kang HM, Choi JG, and
Bae YC. 2012. Highly pathogenic avian influenza (H5N1) outbreaks in wild birds and poultry, South Korea. Emerg. Infect.
Dis. 18, 480–483.
Kim YI, Park SJ, Kwon HI, Kim EH, Si YJ, Jeong JH, Lee IW, Nguyen HD, Kwon JJ, Choi WS, et al. 2017b. Genetic and phylogenetic characterizations of a novel genotype of highly pathogenic avian influenza (HPAI) H5N8 viruses in 2016/2017 in South Korea.
Infect. Genet. Evol. 53, 56–67.
Ku KB, Park EH, Yum J, Kim JA, Oh SK, and Seo SH. 2014. Highly pathogenic avian influenza A(H5N8) virus from waterfowl, South Korea, 2014. Emerg. Infect. Dis. 20, 1587–1588.
Kwon HI, Song MS, Pascua PNQ, Baek YH, Lee JH, Hong SP, Rho JB, Kim JK, Poo H, Kim CJ, et al. 2011. Genetic characterization and pathogenicity assessment of highly pathogenic H5N1 avian influenza viruses isolated from migratory wild birds in 2011, South Korea. Virus Res. 160, 305–315.
Lee DH, Lee HJ, Lee YN, Park JK, Lim TH, Kim MS, Youn HN, Lee JB, Park SY, Choi IS, et al. 2011. Evidence of intercontinental transfer of North American lineage avian influenza virus into Korea. Infect. Genet. Evol. 11, 232–236.
Li KS, Guan Y, Wang J, Smith GJD, Xu KM, Duan L, Rahardjo AP, Puthavathana P, Buranathai C, Nguyen TD, et al. 2004. Genesis of a highly pathogenic and potentially pandemic H5N1 influenza virus in eastern Asia. Nature 430, 209–213.
Liu J, Xiao H, Lei F, Zhu Q, Qin K, Zhang XW, Zhang XL, Zhao D, Wang G, Feng Y, et al. 2005. Highly pathogenic H5N1 influenza virus infection in migratory birds. Science 309, 1206–1206.
Mahardika GN, Jonas M, Murwijati T, Fitria N, Suartha IN, Suartini IGAA, and Wibawan IWT. 2016. Molecular analysis of hemagglutinin-1 fragment of avian influenza H5N1 viruses isolated from chicken farms in Indonesia from 2008 to 2010. Vet.
Microbiol. 186, 52–58.
Morelli MJ, Thébaud G, Chadœuf J, King DP, Haydon DT, and Soubeyrand S. 2012. A Bayesian inference framework to reconstruct transmission trees using epidemiological and genetic data. PLoS Comput. Biol. 8, e1002768.
Nagy A, Vostinakova V, Pindova Z, Hornickova J, Cernikova L, Sedlak K, Mojzis M, Dirbakova Z, and Machova J. 2009.
Molecular and phylogenetic analysis of the H5N1 avian influenza virus caused the first highly pathogenic avian influenza outbreak in poultry in the Czech Republic in 2007. Vet. Microbiol. 133, 257–263.
Nair H, Brooks WA, Katz M, Roca A, Berkley JA, Madhi SA, Simmerman JM, Gordon A, Sato M, Howie S, et al. 2011.
Global burden of respiratory infections due to seasonal influenza in young children: a systematic review and meta-analysis.
Lancet 378, 1917–1930.
Nguyen T, Rivailler P, Davis CT, Thi Hoa D, Balish A, Hoang Dang N, Jones J, Thi Vui D, Simpson N, Thu Huong N, et al. 2012.
Evolution of highly pathogenic avian influenza (H5N1) virus populations in Vietnam between 2007 and 2010. Virology 432, 405–416.
Olsen B, Munster VJ, Wallensten A, Waldenström J, Osterhaus ADME, and Fouchier RAM. 2006. Global patterns of influenza a virus in wild birds. Science 312, 384–388.
Osmani MG, Ward MP, Giasuddin M, Islam MR, and Kalam A. 2014.
The spread of highly pathogenic avian influenza (subtype H5N1) clades in Bangladesh, 2010 and 2011. Prev. Vet. Med.
114, 21–27.
Pybus OG, Suchard MA, Lemey P, Bernardin FJ, Rambaut A, Crawford FW, Gray RR, Arinaminpathy N, Stramer SL, Busch MP, et al. 2012. Unifying the spatial epidemiology and molecular evolution of emerging epidemics. Proc. Natl. Acad.
Sci. USA 109, 15066–15071.
Reperant LA, Kuiken T, and Osterhaus ADME. 2012. Influenza viruses: from birds to humans. Hum. Vaccin Immunother. 8, 7– 16.
Sakoda Y, Ito H, Uchida Y, Okamatsu M, Yamamoto N, Soda K, Nomura N, Kuribayashi S, Shichinohe S, Sunden Y, et al. 2012.
Reintroduction of H5N1 highly pathogenic avian influenza virus by migratory water birds, causing poultry outbreaks in the 2010-2011 winter season in Japan. J. Gen. Virol. 93, 541–550.
Shannon P, Markiel A, Ozier O, Baliga NS, Wang JT, Ramage D, Amin N, Schwikowski B, and Ideker T. 2003. Cytoscape: a software environment for integrated models of biomolecular interaction networks. Genome Res. 13, 2498–2504.
Shin JH, Woo C, Wang SJ, Jeong J, An IJ, Hwang JK, Jo SD, Yu SD,
Choi K, Chung HM, et al. 2015. Prevalence of avian influenza virus in wild birds before and after the HPAI H5N8 outbreak in 2014 in South Korea. J. Microbiol. 53, 475–480.
Shu Y and McCauley J. 2017. GISAID: Global initiative on sharing all influenza data - from vision to reality. Euro Surveill. 22, 1–3.
Sonnberg S, Webby RJ, and Webster RG. 2013. Natural history of highly pathogenic avian influenza H5N1. Virus Res. 178, 63–77.
Theary R, San S, Davun H, Allal L, and Lu H. 2012. New outbreaks of H5N1 highly pathogenic avian influenza in domestic poultry and wild birds in Cambodia in 2011. Avian Dis. 56, 861–864.
Tian H, Zhou S, Dong L, Van Boeckel TP, Cui Y, Newman SH, Takekawa JY, Prosser DJ, Xiao X, Wu Y, et al. 2015. Avian influenza H5N1 viral and bird migration networks in Asia. Proc.
Natl. Acad. Sci. USA 112, 172–177.
Uchida Y, Suzuki Y, Shirakura M, Kawaguchi A, Nobusawa E, Tanikawa T, Hikono H, Takemae N, Mase M, Kanehira K, et al.
2012. Genetics and infectivity of H5N1 highly pathogenic avian influenza viruses isolated from chickens and wild birds in Japan during 2010–11. Virus Res. 170, 109–117.
World Health Organization. 1971. A revised system of nomenclature for influenza viruses. Bull. World Health Organ. 45, 119–124.
Ypma RJF, van Ballegooijen WM, and Wallinga J. 2013. Relating phylogenetic trees to transmission trees of infectious disease outbreaks. Genetics 195, 1055–1062.