Sensors & Transducers
© 2014 by IFSA Publishing, S. L.
http://www.sensorsportal.com
Computer-Aided Detection with a Portable
Electrocardiographic Recorder and Acceleration Sensors for Monitoring Obstructive Sleep Apnea
1 Ji-Won Baek, 2 Yoon-Nyun Kim, 3 Dong Eun Kim, and 1 Jong-Ha Lee
1 Department of Biomedical Engineering, School of Medicine, Keimyung University, Daegu, South Korea
2 Department of Cardiology, School of Medicine,
Keimyung University, Dongsan Medical Center, Daegu, South Korea
3 Department of Otolaryngology, School of Medicine,
Keimyung University, Dongsan Medical Center, Daegu, South Korea
1 Tel.: (82)-53-580-3836, fax: (82)-53-580-3846 E-mail: [email protected]
Received: 7 March 2013 /Accepted: 29 March 2014 /Published: 31 March 2014
Abstract: Obstructive sleep apnea syndrome is a sleep-related breathing disorder that is caused by obstruction of the upper airway. This condition may be related with many clinical sequelae such as cardiovascular disease, high blood pressure, stroke, diabetes, and clinical depression. To diagnosis obstructive sleep apnea, in-laboratory full polysomnography is considered as a standard test to determine the severity of respiratory disturbance. However, polysomnography is expensive and complicated to perform. In this research, we explore a computer-aided diagnosis system with portable ECG equipment and tri-accelerometer (x, y, and z-axes) that can automatically analyze biosignals and test for OSA. Traditional approaches to sleep apnea data analysis have been criticized; however, there are not enough suggestions to resolve the existing problems. As an effort to resolve this issue, we developed an approach to record ECG signals and abdominal movements induced by breathing by affixing ECG-enabled electrodes onto a triaxial accelerometer. With the two signals simultaneously measured, the apnea data obtained would be more accurate, relative to cases where a single signal is measured. This would be helpful in diagnosing OSA. Moreover, a useful feature point can be extracted from the two signals after applying a signal processing algorithm, and the extracted feature point can be applied in designing a computer-aided diagnosis algorithm using a machine learning technique. Copyright © 2014 IFSA Publishing, S. L.
Keywords: Computer-aided diagnosis, Obstructive sleep apnea, Acceleration sensor, Electrocardiography, Adaboost, Machine learning.
1. Introduction
Human beings spend one third of their lives sleeping. On average, newborn babies sleep for 16 hours a day, whereas the elderly get 5–6 hours
of sleep. Sleeping is a major part of human life, a basic and essential biological activity to relax and revitalize the tired body, internal organs, and mind [1].Obstructive sleep apnea (OSA) is a medical condition in which repetitive pauses or decreases
in airflow occurs during breathing while asleep.
Typically, people with OSA frequently wake up at night, and the disorder is accompanied by cyclical decreases in arterial oxygen saturation. OSA is a relatively common condition found in 4.5 % of adult men and 3.2 % of adult women. It used to be perceived in the past as a mere sleep habit that comes with snoring, but it is now a highly researched clinical disorder, with accumulating data that provide evidence that OSA is related with systemic diseases such as hypertension, cardiovascular diseases, and glucometabolic impairments, as well as various pediatric complications including growth-related impairments, maxillofacial deformity, behavioral and psychological disorders, and nocturnal enuresis.
OSA is even more relevant in the elderly in Korea, as it is increasingly prevalent among them, with the fast aging andever-growing life expectancy of the Korean population [2].
Approximately 50 % of OSA patients also have hypertension due to recurrent apnea-induced decreases in oxygen saturation, whereby the ensuing wakefulness increases blood pressure and pulse rate.
Repeatedly heightened blood pressure at night hours results in high blood pressure at day hours, thus leading tohypertension. In addition, OSA patients will have their sympathetic nervous system abnormally stimulated at the moment when apnea ends after a slowed heart rate, resulting in the breakdown of the automatic nervous system. If recurrent, these conditions will induce arrhythmia and an irregular heart rate. Furthermore, an episode of OSA could narrow or block coronary arteries, often accompanying ischemic heart diseases, in which myocardial cells are damaged by oxygen deficiency [3].
One of the reasons apnea has a significant effect on the cardiovascular system is that human sleep and non-sleep states are greatly influenced by the central and autonomic nervous system. The central nervous system controls homeopathy of all the internal organs. Meanwhile, the autonomic nervous system keeps the systemic functions at equilibrium and controls “fight or flight” responses and various visceral functions. The sympathetic and parasympathetic divisions of the autonomic nervous system control the heart; the sympathetic system facilitates, and the parasympathetic system inhibits.
That is, the parasympathetic system slows down heart rate starting from the sinoatrial node, weakens myocardial retraction, decelerates the conduction velocity of heart excitation, and reduces the blood flow in coronary arteries. Meanwhile, the sympathetic system increases heart rate, accelerates the conduction velocity of heart excitation, heightens blood pressure by strengthening retraction, and facilitates oxygen supply by increasing the blood flow in coronary arteries. The central cardiac nerve located in the medulla senses signals coming from every part of the body and controls the heart.
The process is called cardiac reflex, as the signals reach the cardiac nerve via the central nerve before
reaching the heart. The respiratory reflex of the cardiac reflex determines the heart rate depending on the state of inhalation and exhalation. Such breathing-related heart rate variations are a phenomenon called respiratory sinus arrhythmia (RSA). Central nerves related to the cardiovascular control of heart rate variability (HRV) are the cardiac, respiratory, and vasomotor centers, all of which receive reflex signals from baroreceptor, chemical receptors, and mechanical receptors mediated by the afferent nerve fiber. As such, RSA is an important research subject in cardiovascular diseases and it is also utilized as a test for sleep apnea diagnosis.
One of the regular methods of diagnosis is polysomnography (PSG). As a most reliable methodology to diagnose a range of sleep-related breathing disorders, PSG utilizes electroencephalography to measure various types of bioelectrical signals, electrocardiography (ECG) to gauge heart vitality, electroculography to observe eyeball movements, and electromyography to evaluate nervous and muscular activities.
The measurements are incorporated with those of other vital signs such as heart rate, blood pressure, and breathing pattern before medical specialists make an apnea diagnosis. Other methods include cephalometry, computed tomography, magnetic resonance imaging, and fiber-optic endoscopy.
Cephalometry, in particular, is a commonly used diagnostic method because sleep apnea is known to be closely related with various soft tissue structures, including the craniomaxillofacial hard tissue, velum, tongue, and hypopharynx [4].However, PSG has a few downsides. Patients find it uncomfortable to wear electrodes and bands on their body, and the test is costly. In addition, the entire measurement can only be performed in hospitals and institutes that are equipped with the necessary machines. Given these drawbacks, the present research is focused on how to modify and improve PSG. For instance, to lessen patient discomfort, the authors reduced the number of test instruments used or performed diagnoses through automatic analyses of all biosignals, with an ultimate aim of developing an automatic OSA diagnostic unit that can be used at home. Current studies utilize bronchial breathing, snoring, oxygen saturation, and blood pressure, but these are relatively less effective in diagnosing OSA [5].
Recently, HRV has been proposed as a new parameter for OSA diagnosis. Used for the first time for his research on periodic oscillations of heart rate as a main attribute of OSA, HRV has been studied in connection with OSA screening. Advanced measurement technology makes it possible to obtain ECG signals and HRV relatively precisely and easily, rendering them popular data to collect for OSA screening [6].Other useful technologies have been proposed to make OSA-related measurements even easier to perform and free of cost and space constraints. For instance, various breathing
examination shave been developed based on abdominal movements using ultrasound sensors, and another one was developed based on abdominal pressure changes using pressure sensors or fiber pressure sensors, and polyvinylidene fluoride measurements of impedance, which can be incorporated into a belt to approximate airflow and respiratory effort. These, however, have limitations in terms of accuracy, cost, and durability issues [7].
There has been a recent development that overcomes the disadvantages of standard PSG and enables users to conduct breathing tests at home using tri-axial acceleration sensors. This technology makes use of an accelerometer that directly examines breathing during sleep, is not affected by any changes in the surrounding environment, and can be used over long periods with its strong durability. It is also capable of transmitting and storing breathing curve data of inhalation and exhalation, allowing users to easily access and understands sleep posture information.
In this research, we explore a computer-aided diagnosis system with portable ECG equipment and tri-accelerometer (x, y, and z-axes) that can automatically analyze biosignals and test for OSA.
Traditional approaches to sleep apnea data analysis have been criticized; however, there are not enough suggestions to resolve the existing problems. As an effort to resolve this issue, we developed an approach to record ECG signals and abdominal movements induced by breathing by affixing ECG-enabled electrodes onto a triaxial accelerometer. With the two signals simultaneously measured, the apnea data obtained would be more accurate, relative to cases where a single signal is measured. This would be helpful in diagnosing OSA. Moreover, a useful feature point can be extracted from the two signals after applying a signal processing algorithm, and the extracted feature point can be applied in designing a computer-aided diagnosis algorithm using a machine learning technique.
2. Materials and Methods
In this section, the materials and methods for computer-aided detection of obstructive sleep apnea are discussed.
2.1. Collection of Biosignals
We attached an accelerometer to the thoracic compartment of the patients to measure muscular movements in terms of voltage changes on the z axis, rendering the use of electrodes or elastic bandages unnecessary. As illustrated in Fig. 1, we attached ECG-enabled electrodes to the accelerometer so that we could measure thoracic movements and ECG signals simultaneously. We adopted a dipole model for the ECG measurement and read the source for the measurement of potential difference between the right and left hands. Data from the accelerometer and
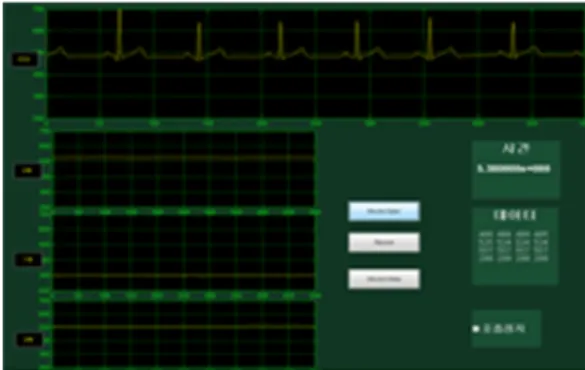
the ECG were collected and stored. We used the serial communication to open the serial port and configure the data bit to 8. Using Lab designed GUI, we transferred the collected data to a graph as shown in Fig. 2, which represents the ECG value sand the x, y, and z-axes of the accelerometer. The data were stored in text files.
Fig. 1. The accelerometer with three electrocardiographic electrodes attached.
Fig. 2. An electrocardiogram with the x, y, and z-axes represented in graphical user interface graphs.
2.2. ECG Data Analysis
To extract HRV data, we first conducted ECG signal processing. For the analysis of ECG signal features, we utilized a method that extracts the QRS complex, a point where the ECG signal wave rapidly changes and forms the largest amplitude in the ECG waveform. To attenuate the noise of the acquired data, we had the signals pass through a low-pass filter at a sampling frequency of 90 Hz, followed by a high-pass filter at 2 Hz and then a band-pass filter.
After filtering, the signal was differentiated to amplify the characteristics (rapid changing with largest amplitude) of the QRS complex and then was squared point by point to render the value positive.
Then, the width of the window was set at 80 ms to obtain waveform feature information by moving- window integration before identifying the R-wave peak relative to the threshold (Pan-Tompkins algorithm).The distance between the identified R has to be calculated to obtain HRV. Where the ith R point is designated as R(i) and thei-1th R point as R(i-1), the estimated distance between the two, I(i), can be obtained.
When repeated, the time interval (R-R interval) between beats is calculated as below.
1) + R(i - 2) + R(i
= 1) + I(i R(i), - 1) + R(i
=
I(i) , (1)
The value obtained after these steps are not applicable to the regular frequency analysis, as the signals are not equidistant. It is therefore necessary to extract equidistant HRV from the sequential heartbeat interval series to analyze the frequency patterns. In the present study, we obtained a series of R-R intervals down sampled to 4-Hz equidistance and applied the tachogram extracted from HRV.
2.3. HRV Analysis
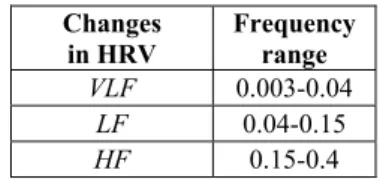
Traditional HRV analysis is usually divided into two broad categories, namely time domain measures and frequency domain measures. The time domain analysis is performed using the times series derived from the R-R interval sequence, for which there are multiple applicable methods such as the average of all R-R intervals; the standard deviation of all the intervals; the distribution or mean of the differences between adjacent intervals; the changes in signal outcome when the times series data with R-R intervals are processed through a frequency-specific filter [8].The frequency domain analysis is generally performed by measuring the power spectral density of the times series data composed of R-R intervals and dividing it into very low frequencies (VLFs), low frequencies (LFs), and high frequencies (HFs), depending on the frequency band. Table 1 represents the heart rate variability (HRV) categorization by frequency components.
Table 1. Heart rate variability (HRV) categorization by frequency components.
Changes in HRV
Frequency range VLF 0.003-0.04
LF 0.04-0.15
HF 0.15-0.4
HF components are known to be affected by the RSA of the parasympathetic nervous system, whereas varying evidence is being reported to propose that LF components are affected by just the sympathetic nervous system or jointly with the parasympathetic system. LF/HF is used as the standard, as there are differing proposals. An increase in LF/HF represents heightened sympathetic system activity, with a decrease representing decrease in activity. VLF components have been explained by several physiological approaches but are largely excluded from studies of the sympathetic nervous system
because there is little consensus at present. The HRV signal analysis in the frequency domain is typically performed by obtaining the spectral estimation of the R-R interval series based on Fourier transform, but the outcome of Fourier transform does not provide time information, only giving information on which and how much of the frequency components exist in the entire series of signals. Using the short-time Fourier transform (STFT), an alternative to resolve the issues of Fourier transform, we obtained the characteristics of frequency components based on the times series data with R-R intervals. We also used a spectrogram obtained by squaring STFT to obtain the power spectrum. As initially introduced by Gabor, the STFT extracts several frames of signals to be analyzed with a time window, and the time window is Fourier transformed. The process was repeated toward the whole series of signals with the window moving along the time axis, and a Fourier transform analysis was performed on each time-dependent frame as defined in eq.(2) below.
[x t t t ]e dt
f t
STFT(`, ) ∞ ()ω`( `) −2πft
∞
− −
= , (2)
The spectrogram estimated from the STFT was obtained as follows.
)2
, ( )
,
(t f STFT t f m
Spectrogra = , (3)
For the STFT analysis, the present study set the size of the FFT at 64 and adopted the sampling frequency of 4-Hz from HRV signals. A size 64 Hamming window was used.
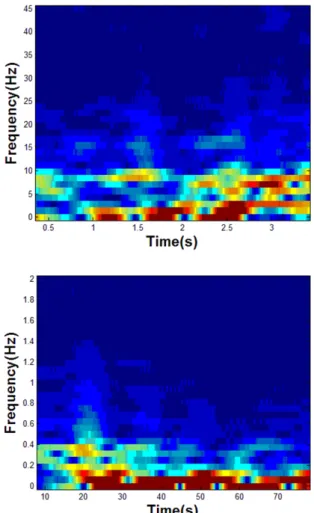
The range that was overlapped with the previous window was set at 63, and then Fourier transformation was performed for each of the samples. A spectrogram was obtained from the data after STFT, and LF/HF, an index demonstrating the equilibrium of the autonomic nervous system, was represented by the time frame. Fig 3 represents the oscillation of LF/HF in breathing state (left) and apnea state (right) by time frame.
2.2.3. Accelerometric Data Analysis
To eliminate noise signals from the x, y, and z- axes of the accelerometer, a 1-Hz low-pass filter was applied, followed by a 0.1-Hz high-pass filter before obtaining the average value for each axis.
Figure 4 shows the axis x frequency oscillation at apnea and hypopnea.
3. Experimental Results
In this research, we collected a total of 20 data sets to examine how the features extracted from the portable ECG recorder and accelerometer were capable of detecting breathing and apnea states.
Fig. 3. Oscillation of LF/HF in breathing state and apnea state by time frame.
Fig. 4. Axis x frequency oscillation at apnea and hypopnea.
The data comprised 10 sets consisting of normal breathing intervals and another 10 sets that had apnea states during normal breathing. Each data set had a length of 180 seconds. The latter sets of data included 5 sets with a 5-second apnea period, and the other 5 sets had a 10-second apnea period. The 5-second apnea data had a preceding relaxed breathing period of 87 seconds before the apnea state, which was followed by a recurrent normal breathing that lasted for 87 seconds, whereas the 10-second apnea data showed a series of 85-second normal breathing, 10-second apnea, followed by 85-second normal breathing. Prior to detecting the 10 data sets with apnea states from among the 20 data sets, six features were calculated as follows:
Set 1. f1: Maximum value of LF/HF (max [LF/HF]) Set 2. f2: Minimum value of LF/HF (min [LF/HF]) Set 3. f3: Average value of LF/HF (avg[LF/HF]) Set 4. f4: Average accelerometric value of axial x (avg[accel.x])
Set 5. f5: Average accelerometric value of axial y (avg[accel.y])
Set 6. f6: Average accelerometric value of axial z (avg[accel.z])
The area under the curve (AUC) of each feature was estimated to assess the usefulness of the features.
Receiver operating characteristic (ROC) curves represent the sensitivity and specificity of a given test method. The more the curve moves away from the 45°line nearing the upper-left side and the closer to 1 the AUC value representing the below-curve area is, the higher the reliability of the test method.
When the AUC measures between 0.6 and 0.7, the reliability of the test is rated average; when higher than 0.8, high; and when lower than 0.5, lower than at random. We used the statistical program MedCalc to obtain the ROC curves and AUC area per feature as presented in Fig. 5. f2 demonstrates the largest AUC area at 0.880; and f4, the smallest AUC area at 0.505.
The six feature points that were extracted were analyzed using the Weka program and were used for the learning boosting algorithm Adaboost.
A 10-fold cross-validation method was used to assess the learning mode. When the 20 data sets were categorized/grouped using the learning model, eight of 10 non-apnea data sets and nine of 10 apnea data sets were found to be accurately sorted. A confusion matrix is a specific table layout that allows visualization of the actual and system-processed predicted classification’s by which estimations of sensitivity, specificity, and accuracy are possible.
A confusion matrix consists of four different possible outcomes, namely TP, FP, FN, and TN, where TP is defined as correctly classifying a patient as with disease; FP, as incorrectly classifying a healthy personas with disease; TN, as correctly classifying a healthy person as healthy; and FN, as incorrectly classifying a person as healthy.
Fig. 5. Receiver operating characteristic curve for f1, f2, f3, f4, f5, f6.
The accuracy can be calculated based on the correctly classified values from among all system- processed classification values, as in:
(TP + TN)/(TP + FN + FP + TN) × 100.
Sensitivity can be estimated as the ratio of the correctly classified patients to all the actual patients, and specificity can be estimated as the ratio of the correctly classified healthy persons to all the actual healthy persons. The respective calculations can be defined as follows:
TP/(TP + FN) × 100 and TN/(TN + FP) × 100.
The unit of the scale was in percentage, and in this study, TP = 9, FN = 1, FP = 2, TN = 8. Based on these measurements, the sensitivity, specificity, and accuracy values are calculated as follows:
Sensitivity = TP/(TP + FN) × 100 = 9/(9 + 1) × 100 = 90 %
Specificity = TN/(TN + FP) × 100 = 8/(8 + 2) × 100 = 80 %
Accuracy = (TP + TN)/(TP + FN + FP + TN) × 100 = (9 + 8)/(9 + 1 + 2 + 8) × 100 = 85 %
The algorithm, tested with thoracic movements and ECG signals, successfully diagnosed sleep apnea with 90 % sensitivity, 80 % specificity, and 85 % accuracy. The ROC curve of the six feature points,
which was created based on their learning algorithms, suggests that the present test method has a higher- than-average reliability, with an AUC value of 0.84.
Fig. 6 shows the receiver operating characteristic (ROC) curve drawn based on all six feature points combined.
Fig. 6. Receiver operating characteristic (ROC) curve drawn based on all six feature points combined.
4. Conclusions and Discussions
The present study investigated various methodologies of data analysis and changes in accelerometric values to examine the biological episode of sleep apnea. Sleep apnea has been
increasingly suggested as a risk factor of cardiovascular conditions, with recent studies reporting its link with high-profile diseases such as hypertension and diabetes. There is, however, a lack of awareness of the potential severity of this sleep-related disorder, and not many studies have explored the relationship between sleep apnea and cardiovascular diseases. Frequent sleep interruptions caused by apnea during the night hours induce drowsiness during the day, lowering cognitive functions and impeding mental activities and learning process. Furthermore, lack of oxygen causes an apnea patient to abruptly wake up from deep sleep, gasping for air to recover normal breathing at each episode of apnea. The patient will typically feel very tired as a result from labored breathing. Despite the physical difficulties experienced by patients and the severity of the disorder, a reliable test method to diagnose sleep apnea has not yet been established. Thus, we endeavored to resolve this issue through this study.
We reviewed the LF/HF ratios in the HRV analysis to identify episodes of apnea and found out that the value reached the point of an apnea state, stimulating the sympathetic nervous system.
However, some increases in the LF/HF ratios were observed at certain non-apnea states, probably because of stress, as the LF/HF ratios significantly impact HRV and its analysis, decreasing HF and increasing LF/HF. Apnea laboratory tests are typically restraining for the subjects because of the unfamiliar laboratory environment and test-related requirements. For this reason, HRV analysis alone is not sufficient to provide accurate data for the assessment of apnea state. An accelerometer was also not capable of detecting any changes breathing in the cases with apnea episode durations that were too short. People in sleep tend to frequently change their postures, and for a hypopnea state, as opposed to an apnea state, data extraction is not guaranteed by using an accelerometer alone. There is no standardized threshold to determine at what LF/HF ratio the sympathetic nervous system is stimulated, and the ratio measurements is again greatly affected by sleep posture. Further research is needed to help resolve these existing issues. In particular, a new tool has to be developed that can automatically transmit apnea data when an episode occurs.
We also looked at how to apply Fourier coefficients. We were able to obtain highly accurate estimations and considered the method as a possible replacement of the existing ones for HRV analysis.
However, it should be noted that ECG data still need to be transferred; therefore, further work is required to explore how to resolve data distortion caused by motion artifact. In addition, for R-peak extraction algorithms developed by researchers themselves, accuracy needs to be checked in comparison with other equivalent systems that are already being used.
Moreover, future studies are needed on real-time measurement and analysis to further enrich our present data, which we obtained through an analysis of a set of measured signals.
Acknowledgements
This work was supported by the R&D Program of the Ministry of Trade, Industry and Energy of Korea (Program of Advanced Technology Development for Future Industry, 10044353, and supported by the MOTIE (Ministry of Trade, Industry and Energy), Korea, under the Inter-Economic Regional Cooperation program (R0002625) supervised by the KIAT (Korea Institute for Advancement of Technology) and this work (Grants No. C0135220) was supported by Business for Cooperative R&D between Industry, Academy, and Research Institute funded Korea Small and Medium Business Administration in 2013.
References
[1]. I. Kim, A study on woman’s sleep disorder and depression, PhD Dissertation, Ewha Womans University.
[2]. Y. Lee, M. Chang, H. Lee, H. Kwak, Attention deficits and characteristics of polysomnograms in patients with obstructive sleep apnea, Health, Vol. 16, Issue 3, pp. 557-575.
[3]. S. W. Park, Impact of sleep apnea on the cardiovascular system, Current Practice in Cardiology, Vol. 5, Issue 9, September 2011.
[4]. Y. Nimkarn, P.G. Miles, P.D. Waite, Maxillomandibular advancement surgery in obstructive sleep apnea syndrome patients:
long-term surgical stability, Journal of Oral and Maxillofacial Surgery, Vol. 53, pp. 1414-1418.
[5]. R. Ferber, R. Millman, M. Coppola, J. Fleetham, et al., Portable recording in the assessment of obstructive sleep apnea, Sleep, Vol. 17, Issue 4, 1994, pp. 378-392.
[6]. C. Maier, M. Bauch, H. Dickhaus, Recognition and quantification of sleep apnea by analysis of heart rate variability parameters, Computers in Cardiology, Vol. 27, 2000, pp. 741-744.
[7]. J.Y. Lee, D.J. Kim, K.H. Kim, Studies on development of sleeping and respiration patterns monitoring system using a 3 axis- acceleration sensor, Journal of CICS, Vol. 10, 2010, pp. 284-285.
[8]. Task Force of the European Society of Cardiology the North American Society of Pacing Electrophysiology, Heart rate variability: standards of measurement, physiological interpretation and clinical use, European Heart Journal, Vol. 17, 1996, pp. 351-381.
[9]. N. Hjortskov, D. Rissen, A.K. Blangsted, N. Fallentin, U. Lundberg, K. Sogaard, The effect of mental stress on heart rate variability and blood pressure during computer work, European Journal of Applied Physiology, Vol. 92, Issue 1-2, 2004, pp. 84-89.
___________________
2014 Copyright ©, International Frequency Sensor Association (IFSA). All rights reserved.
(http://www.sensorsportal.com)