송이 생육환경 특성을 고려한 소나무비오톱지도 작성 연구
1- 강원도 양양군을 사례로 -
한봉호2․박석철3*․곽정인3․김보현4․이경재2
Biotope Mapping of Pinus densiflora Based on Growth Environment of Tricholoma matsutake1 - A Case Study of Yangyang-gun, Kang Won-do -
Bong-Ho Han2, Seok-Cheol Park3*, Jeong-In Kwak3, Bo-Hyun Kim4, Kyong-Jae Lee2
요 약
본 연구는 효과적인 송이산 관리를 위한 기초자료 확보를 위하여 강원도 양양군을 사례로 송이 생육환경특성을 고려한 소나무비오톱지도 작성을 목적으로 수행하였다. 연구방법은 송이와 관련한 국내․외 관련연구 고찰을 통해 송이 생육환경 특성을 도출하고, 송이 생산지의 식물군집구조와 토양환경을 파악하여 소나무비오톱 지도화 기준을 도출하였 다. 지도화 기준은 송이가 발생할 수 있는 중요 요인을 지형 조건과 토양 조건, 식생 조건으로 구분하여 도출하였다.
전체 비오톱유형은 송이생산 가능지, 송이생산 잠재지로 크게 구분하였으며, 송이생산 가능지는 송이생산이 가능한 지형구조 및 토양구조 내 분포하는 소나무 비오톱으로 관목층에 기타 관목성상의 수종이 우점하는 흉고직경 30㎝
미만의 단층구조의 소나무 비오톱과 아교목층에 소나무가 우점하는 다층구조의 소나무비오톱이 해당되었다. 송이생산 잠재지는 송이생산이 가능한 지형구조 내에 분포하고 있으나 흉고직경 30㎝ 이상의 노령화된 소나무가 우점하는 단층구조의 소나무비오톱, 아교목층에 참나무류가 우점하는 소나무 비오톱, 관목층에 참나무류가 우점하는 단층구조의 소나무 비오톱 등 식생구조가 부적절한 지역으로 향후 식생관리를 통해 송이 발생 유도가 가능한 지역이었다. 연구결과 소나무비오톱은 송이생산 가능지 6개 유형, 송이생산 잠재지 9개 유형, 송이생산 불가능지 등 총 16개 유형으로 구분되 었다. 송이생산 가능지는 전체 소나무림 중 총 9.8㎢, 15.48%이었고, 송이생산 잠재지는 20.52㎢, 32.42%이었으며, 송이생산 불가능지는 32.97㎢, 52.10%이었다.
주요어: 지형구조, 토양환경, 식물군집구조, 소나무림, 관리지역
1 접수 2010년 10월 25일, 수정(1차: 2011년 3월 11일, 2차: 2011년 4월 22일), 게재확정 2011년 4월 23일 Received 25 October 2010; Revised(1st: 11 March 2011, 2nd: 22 April 2011); Accepted 23 April 2011 2 서울시립대학교 도시과학대학원 Graduate School of Urban Science, Univ. of Seoul(130-743), Korea 3 서울시립대학교 대학원 Graduate School, Univ. of Seoul(130-743), Korea
4 국립공원관리공단 Korea National Park Service, Seoul(121-717), Korea([email protected])
* 교신저자 Corresponding author([email protected])
ABSTRACT
The purpose of this paper was to ensure the basis for effective management of Tricholoma matsutake mountain province, to perform biotope mapping of Pinus densiflora based on growth environment of Tricholoma matsutake, target a cluster of Yangyang-gun, Kang Won-do. Study Methods were to review on growth and environmental characteristics of Tricholoma matsutake through internal and external documents and to identify vegetational structure and soil characteristics. This paper studied growth structure and soil environment of Pinus densiflora forest where a farm of production area for Tricholoma matsutake of in order to set the standard of Pinus densiflora biotope. Mapping standards were derived by separating of landform conditions, soil conditions, vegetation conditions. Biotope types were divided into possible production area for
Tricholoma matsutake and potential production area for Tricholoma matsutake, possible production area for Tricholoma matsutake were Pinus densiflora biotope in landform and soil structure that enables Tricholoma matsutake production and Single-layered Pinus densiflora biotope of less than 30㎝(DBH)-Tree species that other shrub is dominant in shrub layer, Multi-layered Pinus densiflora biotope that Pinus densiflora forest was predominant in understrory layer. Potential production area for Tricholoma matsutake were single-layered Pinus densiflora biotope of more than 30㎝(DBH) in landform that enables Tricholoma matsutake production, Pinus densiflora biotope with Quercus predominant in the understrory layer, single-layered Pinus densiflora biotope with Quercus predominant in shrub layer, inappropriate vegetation structure area that the induction of production of Tricholoma matsutake was possible through future vegetation management. According to the research results, Pinus densiflora forest were divided into 16 types; 6 types of possible Tricholoma matsutake production areas, 9 potential Tricholoma matsutake production areas and 16 types of areas where Tricholoma matsutake production was impossible. Possible production areas account for 15.48%, or 9.8㎢ out of the total Pinus densiflora forest while potential production areas take up 32.42%, or 20.52㎢, and areas where Tricholoma matsutake production was impossible was 52.10%, or 32.97㎢.
KEY WORDS: LANDFORM STRUCTURE, SOIL ENVIRONMENT, STRUCTURE OF PLANT COMMUNITY, Pinus densiflora FORESTS, MANAGEMENT AREA
서 론
우리나라에서 송이(Tricholoma matsutake)는 매년 300~500톤 규모가 일본으로 수출되어 약 3~5천만 달러의 수익을 올리는 중요한 임산자원이다. 그러나 1960년부터 기록된 산림청의 송이생산과 수출 통계를 보면 송이생산은 1985년에 최고치 1,313톤에 이른 후 극심한 풍년과 흉년을 반복하면서 장기적으로 볼 때 매년 평균 7%씩 감소하는 추세에 있다(Koo et al., 2001). 우리나라 대표적 송이 생산 지인 양양군의 경우에도 2000년 14톤의 생산량을 기록한 후 매년 1.6~6.5톤 규모로 생산량이 감소하고 있다 (Yangyang-gun, 2006). 송이 생산이 감소한 원인은 지구온 난화에 의한 기후변화 영향과 생태적 천이, 솔잎혹파리 및 재선충 등의 병충해, 산불 등에 의한 소나무림의 분포면적 감소, 소나무의 노령화가 원인으로 주목되고 있다.
송이는 소나무가 울창한 산림에서만 자실체를 수확할 수 있으며(Lee et al., 2008), 송이와 소나무의 관계는 단순한 공생이나 기생이기 보다는 소나무의 뿌리 생장에 따라 변화 하는 다이내믹한 외생균근 공생관계로 밝혀졌다(Koo et al., 2000). 소나무와 공생관계를 맺은 송이는 연중 균사생장을 계속하며 지중온도가 19℃ 이하로 떨어지는 9월과 10월에 버섯 원기가 형성되면서 발생하는 것으로 연구되었다(小 川, 1991). 송이 관련 연구에서는 송이 자체에 대한 연구뿐 만 아니라 송이발생지인 소나무림의 환경규명과 소나무림 의 환경변화를 예측하여 송이발생 소나무림의 관리방안을
제시하는 연구도 진행되었다(Lee et al., 1983; Lee et al., 1986).
비오톱 어원은 그리이스 어원의 생활, 생물종(Bios)이라 는 의미와 장소, 공간(topos)이라는 의미의 합성어로서 생물 군집의 서식처(Biotope of a biocenosis) 개념에서 출발하였 다. 공간적 경계를 가지는 특정 생물군집의 서식처이며, 이 는 고유한 특성을 나타내고 이것으로 다른 환경과 구분될 수 있다(Sukopp & Weiler, 1988; Leser, 1991; Schaefer, 1992). 이를 바탕으로 송이와 소나무의 관계를 비오톱 관점 에서 해석하면 송이를 Bios(생활, 생명)로 소나무 생육지역 을 Topos(장소)로 해석할 수 있다. 즉 송이 비오톱은 송이 생육지라고 할 수 있으며 송이가 주로 발생하는 지역은 소 나무림이므로 송이 비오톱은 크게 소나무 비오톱에 포함된 다고 할 수 있다. 본 연구는 생태적인 관점에서 소나무 식생 구조의 변화에 따라 유형화된 소나무 생육지역의 비오톱 지도화를 통해 송이가 생육하는 지역을 도출하였다.
본 연구는 효과적인 송이산 관리에 필요한 기초 자료확보 를 위하여 송이가 생산되는 지역을 대상으로 송이 생육환경 특성을 고려한 송이비오톱 지도 작성을 목적으로 수행하였 다. 현재 국내에서는 비오톱지도를 활용하여 관리계획을 수 립한 연구(Park, 2005; Lee et al., 2006a; Lee et al., 2006b;
Han et al., 2008)가 도시공원과 자연공원, 도시외곽산림 등을 대상으로 진행되었는데, 이를 응용하여 본 연구는 양 양군 소나무림의 비오톱유형화를 실시하여 송이 비오톱지 도를 구축하였다.
Legend Study Area Plot Area Yangyang-gun Main Rivers
Jang-ri 1~12
Wonilgeon-ri 2-1~3 Wongilgeon-ri 1-1~15 Ganghyeon-Myun
Seo-Myun
Sonyang-Myun YangYang-Eup
Hyunnam-Myun Hyeonbuk-Myun
Hu-river
Namdae-river
< KEY MAP >
Yangyang-gun
1
0 2.5 5km
N
County Office of Yangyang-gun
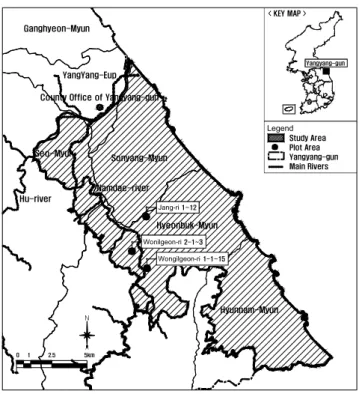
Figure 1. The location map of study area and producing districts in Jang-ri and Wonilgeon-ri of Yangyang- gun, Kang Won-do
재료 및 방법
1. 연구대상지
양양군은 태백산맥이 남북방향으로 뻗어있고, 동부 해안 에는 100m 내외의 저평한 구릉지와 소규모의 평야가 분포 하고 있다. 남대천은 양양군의 중앙부를 북동류하여 동해로 유입되며, 후천은 양양읍 임천리에서 남대천과 합류하고 있 다. 양양군의 연평균기온은 11.8℃ 내외이며, 연평균강수량 은 1,416.8㎜ 정도이다. 양양군은 송이 생산 최적의 자연조 건을 지니고 있으며, 다른 지역의 송이에 비해 수분 함량이 적고 향이 풍부하다. 양양군 송이 수확량은 2006년 3.7톤, 2007년 11.3톤, 2008년 2.0톤, 2009년에 480kg로 크게 감 소하는 추세에 있다.
연구대상지는 양양군 관내 사유지에 분포하는 소나무림 중 송이생산량이 많은 남대천 유역권을 중심으로 손양면, 현북면 현남면 일대의 약 173.4㎢로 설정하였다.
2. 조사분석방법 1) 관련연구 고찰
송이 생육환경 특성을 고려한 소나무비오톱 지도화 기준
은 일본과 국내에서 송이 생육환경에 대한 연구자료를 지 형, 토양, 식생으로 구분하여 정리하였다. 송이의 생육과 밀 접한 기후 및 기상은 중요한 인자이지만, 시간 및 지역에 따른 차이는 동일 유역권내에서는 같은 조건으로 보고 본 연구에서는 제외하였다.
2) 송이 생산지 식물군집구조
조사구는 송이 발생지의 식생구조를 파악하기 위해 양양 군에서 송이를 직접 채취하는 산주의 안내를 받아 송이 생 산량 유형별로 설정하였다. 조사구 면적은 한 개 군락이 생 태적으로 유지되는 최소 면적이 100~500㎡(Ellenberg, 1956; Westhoff and Maarel, 1973)이므로 10m×10m~
20m×20m 크기의 방형구를 기본 단위로 송이가 다량 생산 되는 곳 7개소(장리 1, 원일전리 1-1, 원일전리 1-2, 원일전 리 1-4, 원일전리 1-5, 원일전리 2-1, 원일전리 2-2), 소량 생산되는 곳 14개소(장리 3, 장리 4, 장리 5, 장리 6, 장리 7, 장리 9, 장리 10, 원일전리 1-3, 원일전리 1-7, 원일전리 1-11, 원일전리 1-12, 원일전리 1-13, 원일전리 1-15, 원일 전리 2-3), 생산되지 않는 곳 9개소(장리 2, 장리 8, 장리 11, 장리 12, 원일전리 1-6, 원일전리 1-8, 원일전리 1-9, 원일전리 1-10, 원일전리 1-14)를 설정하였다. 식물군집구 조 조사는 각 조사구내에 출현하는 수종을 대상으로 교목․
아교목층은 흉고직경(DBH) 2㎝ 이상, 관목층은 2㎝ 미만 으로 구분하여 각 수목의 수종명, 수고, 지하고, 수관폭 등 규격을 조사하였으며, 분포 위치를 도면화하였다. 식생 밀 도는 각 조사구에서 층위별로 출현하는 수목 개체수를 분석 하여 100㎡ 당 분포하는 수목의 개체수를 산정하였다. 수령 은 조사구별로 2~3주의 표본목을 선정하고 생장추를 이용 하여 가슴높이에서 표본목의 목편을 채취하였으며, 실내에 서 목편에 나타난 나이테 개수를 파악하였다.
3) 송이 생산지 토양환경
토양단면구조는 송이생산지와 비생산지를 구분하여 낙 엽층을 걷어내고 수목의 세근이 발달하는 층까지 수직으로 굴취한 뒤 낙엽층과 유기물층의 깊이를 측정하였다. 토양이 화학적 특성은 토양구조를 측정한 지점에서 소량의 토양시 료를 채취하여 송이 생산지와 비생산지를 구분하고 실내에 서 음건하여 송이균환의 발생 및 생육과 관련있는 토양산도 (pH), 유기물함량, 토성 등의 항목을 분석하였다.
4) 소나무비오톱 지도화
소나무비오톱 지도 작성은 실내분석과 현장조사로 나누 어 진행하였다. 실내분석은 1/5,000 수치지형도와 GIS 프로 그램인 Arc-view 3.3 프로그램을 이용하여 지형구조(경사, 향, 세부지형)를 분석하고 도면화 하였다. 현장조사에서는
Types Summary Landform
▪ mostly appears in steep slope such as mountaintop, hillside, ridgeline
▪ average slope 32˚(30~40˚)
▪ aspect : South >West >East >North Soil environment ▪ low acid soil of pH 4.2~5.6, sandy soil
▪ barren and dry soil, thickness of A0 layer: 2~4㎝
Vegetational structure
▪ 15~20 years: 20~30 weeks/100㎡, 30~40 years: 12~15 weeks/100㎡, more than 50 years:
5~8 weeks/100㎡
▪ Pinus densiflora, or Pinus densiflora forest with other species of less than 10%
▪ 50~80% coverage rate of overstory trees (60~70%: good condition)
▪ low density (less than 30%) of low vegetation(shrub, herbage)
▪ major plants around forest: Rhododendron schlippenbachii, Rhododendron, Fraxinus rhynchophylla, Juniperus rigida, Melampyyrum roseum
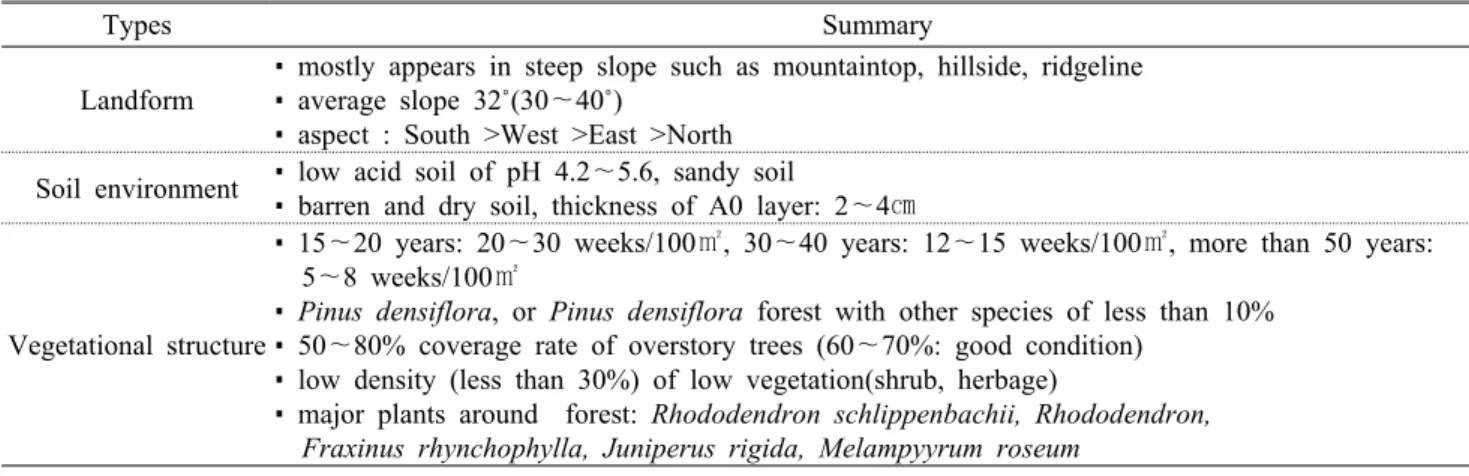
Table 1. Basic research on the growth of Tricholoma matsutake 연구대상지 전체에 대하여 교목층 식생상관과 흉고직경 분
포 현황에 따라 소나무비오톱유형을 구분하였으며, 아교목 층과 관목층에서는 소나무의 출현 유무와 참나무류 우점도 에 따라 구분하였다. 소나무비오톱 지도 기초 조사도면은 1/5,000 수치지형도를 1/5,000으로 출력하여 사용하였다.
이때 구분된 소나무비오톱 유형별로 임의의 한 지점을 선택 하여 토양의 낙엽층 깊이와 유기물층 깊이를 측정하였다.
송이 생육환경 특성을 고려한 소나무비오톱지도는 송이생 산이 가능한 지형구조 및 토양구조와 소나무비오톱을 Arc-view 3.3 프로그램을 이용하여 중첩분석(Kim et al., 2008)을 실시하여 완성하였다. 중첩분석은 여러 개의 자료 레이어를 복층으로 중첩하여 동일한 위치에 존재하는 그리 드 셀 값에 수학적 연산처리 하는 과정으로 본 연구에서는 특별한 수식을 사용하기보다는 모든 조건을 만족하는 지역 도출을 목표로 하였다.
결과 및 고찰
1. 송이 생육환경 특성 1) 관련연구 고찰 종합
송이 생육환경과 관련한 지형은 일본에서 남>서>동>북 순으로 송이생산에 유리한 향이라고 하였으며, 경사도 30˚
내외의 급경사지가 송이생산에 유리한 지형이라고 하였다 (岩及, 1966). 국내 연구를 살펴보면 Lee(1983)는 한국의 송이발생 송림의 현황에 관한 조사연구에서 송이 발생지는 산정 또는 능선부나 가파른 경사지라고 하였다. 산정 또는 능선부는 송이의 생육에 있어 다른 식생이 적고 유기물층이 두껍지 않으며, 토양수분이 강우에 영향을 직접 받는 곳이 다(Park et al., 1999). Hur와 Joo(2002)는 울진 소광리 금강 소나무림을 대상으로 송이발생지를 분석한 결과 산정, 8부
능선 부근, 산등성이나 산복의 상부 등의 지형에서 주로 송 이가 생산된다고 하였으며, 남~남서사면이 송이생산에 유 리한 향이라고 하였다.
송이 생육환경과 관련한 토양환경은 일본에서 岩及 (1966)가 모암이 화강암인 pH 4.2~pH 5.5의 약산성 토양이 송이생산에 적합하다고 하였다. 국내 연구에서 Lee(1983) 는 송이분포지의 약 80%가 토성이 사양토인 것을 밝혔으 며, 낙엽층과 유기물층을 포함한 A0층 두께가 2~4㎝로 대 부분 4㎝ 이하라고 하였다. Hur 와 Joo(2002)는 울진 소광 리 금강소나무림의 송이발생지와 능이발생지의 토양환경 을 비교한 결과 송이생산에 적합한 토양환경은 토양산도 pH 5.22~pH 5.60이며 능이발생지보다 유기물 함량이 적은 척박하고 건조한 지역이라고 하였다.
송이 생육환경과 관련한 식생은 일본에서 송이버섯이 임 령 15~30년에 형성되어 40~60년에 최성기를 맞고 60~80년 에는 소실된다고 하였으며, 관리를 통한 송이 증식의 최적 송림은 임령 30년 미만이며 밀도는 3,000주/ha라고 하였다 (小川, 1981). 岩及(1966)는 송이 생산에 적합한 소나무림 의 임령에 따른 적정 밀도를 제시하였는데 15~20년은 20~30주/100㎡, 30~40년은 12~15주/100㎡, 50년 이상은 5~8주/100㎡로 제시하였다. 국내에서는 소나무 순림 혹은 타수종이 10% 이하인 소나무림이 송이 생산에 적합하다고 하였으며 상층목 피복도가 50~80%로 유지되고 하층식생 은 30% 이하로 밀도가 낮아야 한다고 하였다(Lee et al., 1983). Koo(1993; 2000; 2004)는 송이가 발생하는 숲에서 주로 관찰되는 식물이 비교적 건조한 지역에서 생육하는 철쭉류, 진달래, 노간주나무, 꽃며느리밥풀 등임을 밝혔으 며 진달래, 철쭉꽃, 쇠물푸레는 송이가 생육하는 시기에 증 산작용이 낮아져 송이생산에 도움을 주는 식생이라고 하였 다. Hur와 Joo(2002)는 50년생의 소나무 중령림을 중심으 로 송이가 발생한다고 하였다.
Types Plot number Aspect Slope(°) Landform
Average DBHof Canopy
(㎝)
Average density Canopyof (Indi./100㎡)
Average DBHof Understory
(㎝)
Average density Understoryof (Indi./100㎡)
(year)Age Area (㎡)
Massive production
Jang-ri-1 S70W 13 mountaintop 30.0 6.0 8.0 24.0 23~88 100
Wonilgeon-ri 1-1 S10E 25 mountaintop 28.0 12.3 6.0 5.5 32~88 400
Wonilgeon-ri 1-2 S20E 27 hillside 20.0 7.5 5.0 5.3 32~49 400
Wonilgeon-ri 1-4 S05E 33 hillside 28.0 6.3 7.0 6.5 40~90 400 Wonilgeon-ri 1-5 S05E 37 hillside 28.0 9.3 7.0 7.0 36~75 400 Wonilgeon-ri 2-1 S15E 22 mountaintop 20.0 7.3 7.0 4.5 85~104 400 Wonilgeon-ri 2-2 N70W 20 mountaintop 25.0 7.0 7.0 7.0 31~67 400
Small production
Jang-ri-3 S80W 32 hillside 30.0 7.5 10.0 2.5 74~93 200
Jang-ri-4 N55W 33 hillside 30.0 4.3 10.0 2.0 83~91 400
Jang-ri-5 S10W 33 hillside 30.0 4.0 15.0 1.0 52~91 400
Jang-ri-6 S35W 17 hillside 30.0 8.8 10.0 0.3 - 400
Jang-ri-7 S15W 17 hillside 30.0 5.3 10.0 0.8 54~73 400
Jang-ri-9 S55W 20 hillside 30.0 7.0 10.0 5.0 44~93 400
Jang-ri-10 S40W 12 hillside 30.0 5.8 10.0 1.5 51~65 200
Wonilgeon-ri 1-3 S05E 32 hillside 28.0 8.8 10.0 3.3 31~48 400 Wonilgeon-ri 1-7 N60W 12 mountaintop 35.0 8.5 10.0 8.3 33 400
Wonilgeon-ri
1-11 S05E 32 hillside 28.0 6.8 10.0 5.8 40~77 400
Wonilgeon-ri
1-12 S70W 17 hillside 30.0 6.8 10.0 2.3 97 400
Wonilgeon-ri
1-13 S55W 27 hillside 28.0 3.5 10.0 8.5 39~68 400
Wonilgeon-ri
1-15 S20W 27 hillside 25.0 8.8 10.0 4.5 33~39 400
Wonilgeon-ri 2-3 N50W 22 hillside 25.0 6.0 7.0 17.3 64~74 400
Non production
Jang-ri-2 S55W 14 hillside 30.0 1.3 8.0 30.3 26~75 400
Jang-ri-8 N65W 5 hillside 30.0 6.5 8.0 1.0 59 200
Jang-ri-11 N60W 15 hillside 30.0 7.5 10.0 6.0 42 400
Jang-ri-12 N85W 15 hillside 30.0 4.5 10.0 6.5 41~48 200
Wonilgeon-ri 1-6 N30W 22 hillside 30.0 4.5 7.0 4.5 76 400
Wonilgeon-ri 1-8 N55W 23 hillside 30.0 6.0 7.0 5.3 80 400
Wonilgeon-ri 1-9 N55W 35 hillside 30.0 2.0 10.0 9.8 86 400
Wonilgeon-ri
1-10 N65W 33 hillside 30.0 5.0 10.0 6.3 83 400
Wonilgeon-ri
1-14 S10E 27 hillside 25.0 6.3 10.0 4.3 40~67 400
Table 2. Locational conditions and vegetation structure status of Tricholoma matsutake producing districts in Jang-ri and Wonilgeon-ri, Yangyang-gun
2) 식물군집구조
식물군집구조 조사결과 송이 다량 생산지는 주로 남향과 남서향의 경사 30° 내외인 급경사면이나 능선부에 분포하 였으며, 교목 및 아교목층에서 모두 소나무가 우점하였다.
층위별 밀도는 교목층 평균 7.3주/100㎡, 아교목층 평균 7.0 주/100㎡로서 아교목에 소나무가 우점하는 다층구조였다.
교목층 흉고직경은 평균 28㎝의 대경목이었으며 수령은 49~104년생으로 노령화되었으나 아교목층에 비교적 젊은 소나무가 생육하였다. 송이 소량 생산지는 주로 남향, 남서 향의 경사 30° 내외의 급경사면 혹은 능선부에 분포하였으
며 교목층과 아교목층에서 소나무가 우점하였다. 층위별 밀 도는 교목층 8.8주/100㎡, 아교목층 3.3주/100㎡로 송이 다 량 생산지에 비해 아교목층이 빈약하였다. 교목층 흉고직경 은 평균 30㎝의 대경목이었으며 수령은 39~97년생으로 노 령화된 상태이었다. 송이 비생산지 분포지역은 주로 북서향 의 급경사지로 일조량이 부족하고 습기가 많은 지역이었다.
층위별 우점종은 교목층에서 소나무가 우점하였으나 아교 목층에서는 대부분 신갈나무, 굴참나무 등 참나무류가 우점 하였다. 층위별 밀도는 교목층 평균 6.0주/100㎡, 아교목층 6.3주/100㎡로 다층구조였으며 수령은 교목층 소나무가
Types Plot number
Sectional Structure of the Soil Physico-Chemical Properties of Soils Litter layer
(㎝)
Organic Matter layer
(㎝)
Total(㎝) pH(1:5) O.M.(%) Soil Textures
Massive production
Jang-ri-1 2.0 1.5 3.5 5.33 2.59 sandy loam
Wonilgeon-ri 1-1 3.0 2.5 5.5 4.88 9.39 sandy loam
Wonilgeon-ri 1-2 2.0 4.0 6.0 5.26 5.31 sandy loam
Wonilgeon-ri 1-4 2.0 2.5 4.5 5.15 4.49 sandy loam
Wonilgeon-ri 1-5 2.0 2.5 4.5 5.16 7.15 sandy loam
Wonilgeon-ri 2-1 1.5 2.0 3.5 5.25 2.52 sandy loam
Wonilgeon-ri 2-2 1.0 2.0 3.0 - - -
Small production
Jang-ri-3 1.0 1.5 2.5 5.12 5.31 loam
Jang-ri-4 0.5 3.5 4.0 4.71 6.26 sandy loam
Jang-ri-5 3.0 5.0 8.0 5.05 6.53 sandy loam
Jang-ri-6 3.0 3.0 6.0 5.10 6.67 sandy loam
Jang-ri-7 1.0 4.0 5.0 4.97 6.06 sandy loam
Jang-ri-9 - 3.0 3.0 4.99 2.45 sandy loam
Jang-ri-10 1.5 2.0 3.5 5.13 3.74 sandy loam
Wonilgeon-ri 1-3 1.0 3.0 4.0 5.09 4.08 sandy loam
Wonilgeon-ri 1-7 2.0 3.5 5.5 5.29 5.24 sandy loam
Wonilgeon-ri 1-11 1.5 2.0 3.5 4.93 6.67 sandy loam
Wonilgeon-ri 1-12 2.5 3.5 6.0 5.28 3.47 sandy loam
Wonilgeon-ri 1-13 4.0 2.5 6.5 5.20 3.74 sandy loam
Wonilgeon-ri 1-15 2.0 4.5 6.5 4.94 4.83 sandy loam
Wonilgeon-ri 2-3 2.5 3.0 5.5 - - -
Non production
Jang-ri-2 4.0 5.0 9.0 5.36 4.15 sandy loam
Jang-ri-8 0.5 3.0 3.5 4.89 3.61 sandy loam
Jang-ri-11 2.0 6.0 8.0 4.85 6.06 sandy loam
Jang-ri-12 3.0 5.0 8.0 5.22 3.61 sandy loam
Wonilgeon-ri 1-6 3.0 5.0 8.0 5.05 7.83 loam
Wonilgeon-ri 1-8 1.0 5.5 6.5 5.17 6.26 sandy loam
Wonilgeon-ri 1-9 2.0 6.0 8.0 5.12 4.76 loam
Wonilgeon-ri 1-10 3.0 3.0 6.0 5.07 3.47 sandy loam
Wonilgeon-ri 1-14 2.0 10.0 12.0 5.24 3.54 sandy loam
Table 3. Sectional structure of the soil and Physico-Chemical properties of soils Tricholoma matsutake producing districts in Jang-ri and Wonilgeon-ri, Yangyang-gun
42~86년생으로 노령화된 상태이었다.
송이 생산지와 비생산지의 특성을 비교 종합하면 송이 생산지는 남향, 남서향의 급경사지 혹은 능선으로 광조건이 양호한 지역에 분포하고 있었으며 교목층에 노령의 소나무 가 우점하고 있었으나 아교목층에 비교적 젊은 소나무가 층위를 형성하여 송이 생산에 유리하였다. 반면 비생산지의 경우 북향, 북서향의 사면에 주로 분포하고 있으며, 교목층 에 노령의 소나무가 우점하면서 아교목층에 참나무류 및 낙엽활엽수의 밀도가 높아 송이생산에 불리한 환경이었다.
3) 토양환경
송이 생산지별 토양 단면구조 및 토양 이화학적 특성을
분석한 결과 송이 다량 생산지에서는 낙엽층 1.0~3.0㎝, 유 기물층 1.5~4.0㎝로 A0층의 총 깊이는 3.0~6.0㎝이었다.
이는 기존 연구결과인 4㎝ 미만보다 다소 깊은 수치였다.
토양산도는 기존 연구결과와 유사한 pH 4.88~5.33으로 약 산성의 토양이었으며, 유기물함량은 2.52~9.39%로 특별한 경향은 나타나지 않았으나 장리-1, 원일전리1-2, 4, 2-1은 미경작 산지토양(6.40%)보다 낮았다. 토성은 모두 비교적 통기성이 양호한 사질양토이었다. 송이 소량 생산지에서는 낙엽층 0~4.0㎝, 유기물층 5.0㎝로 총 A0층의 두께는 2.5~8
㎝로 송이 다량생산지보다 다소 깊은 경향을 나타냈다. 토 양산도는 pH 4.71~pH 5.29로 약산성 토양이었으며 유기물 함량은 2.45~6.67%로 일반적인 미경작 산지토양과 유사하
Environmental conditions
Landform
Aspect
▪ Southward
▪ South30°Eastward
▪ South30°Westward
Light conditions
Light conditions Air permeability
Slope ▪ 30° mid-single digit
range A horizon depth
Detailed landform
classification ▪ Ridgeline Light conditions A horizon depth Soil depth A horizon depth ▪ 4cm~10cm
(Research: 2~4cm)
Oxygen supply Air permeability
Ecology of plant
Vegetation
Structure
Canopy layer
▪ Pinus densiflora
▪ Pinus densiflora-deciduous broadleaf trees (Pinus densiflora account for more than 90%)
Host-plants Viability Plant species composition
Understory layer ▪ Pinus densiflora dominance status
Shrub layer ▪ Shrub layer dominance status of Rhododendron species
Density
Canopy layer ▪ 6.0~8.8 trees/100㎡
Understory layer Shrub layer Plant coverage
rate
▪ Single-layer structure - Less than 15%
▪ Multi layer structure - Appearing species:
whether Pinus densiflora of understrory layer Figure 2. Standard of biotope mapping of Pinus densiflora based on growth environment of Tricholoma
matsutake by reserch and walk through survey 거나 낮았고, 토성은 장리-3을 제외하고 모두 사질양토이었 다. 송이가 생산되지 않는 지역은 낙엽층 0.5~4.0㎝, 유기물 층 3.0~10㎝, 총 A0층 두께가 3.5~12㎝로 송이 다량생산지 및 소량생산지보다 다소 깊었으며 특히 유기물층의 두께가 깊은 편이었다. 토양산도는 pH 4.85~pH 5.36으로 약산성 토양이었고, 유기물함량은 3.54~7.83%로 특별한 경향은 보 이지 않았다.
4) 소나무비오톱 지도 작성 기준
관련 선행 연구와 현장조사 결과를 종합하여 송이 생육특 성을 고려한 소나무비오톱 지도 작성 기준을 도출하였다.
소나무비오톱 지도는 기후 및 기상 인자를 제외한 환경조건 에서 송이 생육과 밀접한 광조건과 통기성을 지형조건과 토양조건을 통해 지도화 기준을 도출하였으며, 식물생태 조 건은 송이과 관련한 기주식물과 활력성, 식물 종구성을 송 이가 생육하고 있는 소나무림 지역의 식생구조와 밀도를 통해 기준을 도출하였다. 향의 지도화 기준은 기존 연구결 과 및 현장 검토결과 송이 생산에 중요한 영향요인 중 하나 인 일조건이 양호하여 송이생산에 유리한 남향, 남동향(남 30동), 남서(남30서)향을 송이생산 가능 향의 기준으로 설
정하였다. 경사의 지도화 기준은 일조건이 양호하고 지형구 조상 토양에 낙엽층 및 유기물층의 축적이 어려운 경사도 25~40°의 급경사지 및 절험지를 송이생산 가능 지형의 기 준으로 설정하였다. 앞서 제시한 두 기준은 세부지형구조상 사면지역에 해당하는 것으로 세부지형분류에서 능선지역 은 향에 관계없이 일조건이 양호하며 지형구조상 토양의 낙엽층 및 유기물층 축적이 비교적 적은 지역이므로 송이생 산에 유리한 세부지형 기준으로 설정하였다. 토심의 지도화 기준은 송이 발생지의 토양환경과 관련된 기존 연구에서 제시한 송이 발생의 최적 토양조건인 A0층 깊이 4㎝ 미만 과 송이 생산지 현장 검토에서 실제 송이가 발생한 지역의 토심을 기준으로 10㎝미만인 지역으로 유형화하였다. 양양 군 소나무림 식물생태 조건 중 식생구조에 대한 지도화 기 준은 교목층, 아교목층, 관목층의 세부 식생구조에 따라 유 형화하였다. 교목층은 소나무의 우점도에 따라 소나무가 100% 우점하는 소나무 순림과 소나무 우점도 90%이상의 소나무림을 송이 생산이 가능한 교목층 식생구조로 유형화 하였으며, 아교목층은 소나무의 우점현황, 관목층은 관목성 상의 철쭉류의 우점현황에 따라 구분하였다. 식생 밀도는 층위별 밀도에서 교목층 6.0~8.8주/100㎡를 기준으로 설정
Types Area(㎡) Ratio(%)
Flat 19.8 11.4
North 19.8 11.4
Northeast 22.9 13.2
East 21.0 12.1
Southeast 19.9 11.5
South 15.9 9.2
Southwest 15.7 9.1
west 18.3 10.5
Northwest 20.0 11.5
Total 173.4 100.0
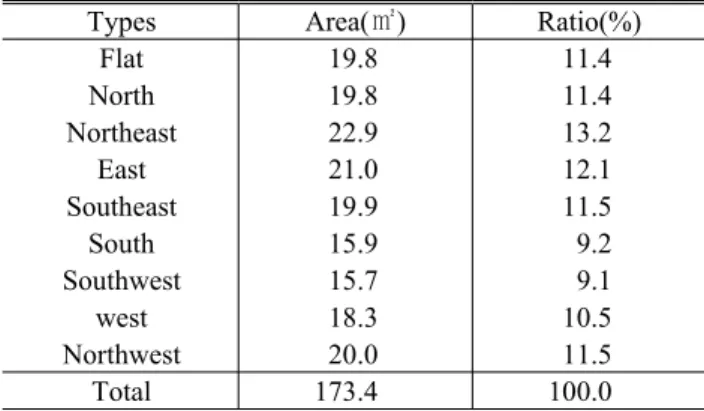
Table 4. The types and area of aspects in Yangyang- gun
Types Area(㎡) Ratio(%)
0∼5˚ 37.5 21.6
5∼10˚ 17.2 9.9
10∼15˚ 23.8 13.7
15∼20˚ 29.5 17.0
20∼25˚ 28.1 16.2
25∼30˚ 19.6 11.3
30∼35˚ 10.8 6.2
35∼40˚ 4.9 2.8
40∼45˚ 1.6 0.9
45∼50˚ 0.3 0.2
Above 50˚ 0.1 0.1
Total 173.4 100.0
Table 5. The types and area of slopes in Yangyang-gun
Types Area(㎡) Ratio(%)
Valley 62.5 36.0
Slope 56.6 32.7
Ridgeline 54.3 31.3
Total 173.4 100.0
Table 6. The types and area of Detailed landforms in Yangyang-gun
Types Area(㎡) Ratio(%)
Aspects and slopes of possible production area for Tricholoma matsutake 10.1 5.8 Ridgeline of possible production area for Tricholoma matsutake 39.2 22.6
Other areas 124.1 71.6
Total 173.4 100.0
Table 7. The type and area of landform of possible production area for Tricholoma matsutake 하였고, 아교목층에 소나무 출현여부에 따라 소나무와 기타
참나무류로 구분하고 식피율 15%를 기준으로 다층구조와 단층구조로 구분하였다.
2. 송이 생육환경 특성을 고려한 소나무비오톱 지도 작성
1) 지형 조건
지형 조건에서는 향이 남, 남동향, 남서향인 지역, 경사 25~40°인 지역, 세부지형이 능선인 지역을 송이 생산이 가 능한 지형구조로 설정하고 기타지역은 지형구조상 송이생 산이 불가능한 지역으로 구분하였다.
연구대상지 전체 향을 분석한 결과 송이생산에 유리한 남향, 남동향, 남서향은 51.5㎢, 29.8%로 분포하였다. 송이 생산에 유리한 향이 주로 분포하는 지역은 남대천 유역권 일대를 포함한 현북면과 손양면이었으며, 현남면 일대에는 국유림과 경계를 중심으로 송이 생산에 유리한 향이 분포하 였다. 경사 5° 미만의 평탄지는 21.6%이었으며, 5~15°의 완경사지는 23.6%로 분포하였다. 15~25°의 다소 경사가 급 한 지역은 23.2%였으며, 송이 생산이 가능한 급경사지인 25~40° 지역은 35.3㎢, 20.3%이었다. 그 외에 40° 이상의 절험지는 1.2%로 분포하였다. 송이생산에 유리한 급경사지 가 주로 분포하는 지역은 남대천 유역권을 포함한 서면, 현 북면과 국유림 경계와 인접한 현남면 북서측 산림 등 내륙 에 위치한 산림이 대부분이었으며 동해와 인접할수록 비교
적 완만한 구릉지 형태의 산림이 분포하였다. 세부지형 분 석 결과 계곡은 62.5㎢, 36.0%, 사면은 56.6㎢, 32.7%이었 다. 송이생산에 유리한 세부지형인 능선은 54.3㎢, 31.3%로 세부지형별 면적 및 비율에 큰 차이는 없었다. 능선과 능선 사이는 대부분 계곡이 분포하고 있으며, 남대천과 동해와 인접한 대규모 경작지 등은 사면으로 구분되었다. Table 4~6은 연구대상지의 향, 경사, 세부지형의 분석결과를 나타 낸 것이다.
Table 7은 앞서 분석한 향, 경사, 세부지형 중 송이생산이 가능한 지역을 종합하여 유형별 면적 및 비율을 제시한 것 이다. 송이생산이 가능한 향과 경사지는 대부분 사면으로 세부지형상 능선과는 별도로 분석되었다. 송이 생산이 가능 한 남향, 남서향, 남동향인 지역 내에 경사도 25~40°의 급경 사지가 분포하는 지역은 10.1㎢, 5.8%였으며 송이 생산 가 능 능선은 송이 생산이 가능한 향과 경사에 포함된 일부 지역과 산불지역을 제외한 39.2㎢, 22.6%이었다. 기타 송이
Figure 3. The location map of landform of possible production areas for Tricholoma matsutake in Yangyang-gun
Types Area(㎡) Ratio(%)
Soil depth less than 4㎝ 19.2 11.0
Soil depth 4∼10㎝ 40.8 23.6
Soil depth more than 10㎝ 3.3 1.9
Other area 110.1 63.5
Total 173.4 100.0
Table 8. The types and areas of soil depth of Pinus densiflora forests in Yangyang-gun
생산이 불가능한 지형은 124.1㎢, 71.6%이었다. Figure 3은 양양군 송이생산 가능 지형 분석도로 송이의 생육과 관련 한 향과 경사, 능선의 조건을 모두 만족하는 지역을 도출하 였다.
2) 토양 조건
토양 조건에서 송이생산 가능지는 송이 발생지의 토양환 경과 관련된 기존 연구에서 제시한 송이 발생의 최적 토양 조건인 A0층 깊이 4㎝ 미만과 송이 생산지 현장 검토에서
Types Area(㎡) Ratio(%) Landform of possible production areas for Tricholoma matsutake and soil depth less than 4cm 9.2 5.3 Landform of possible production areas for Tricholoma matsutake and soil depth 4~10cm 19.3 11.1 Landform of possible production areas for Tricholoma matsutake and soil depth more than 10cm 1.3 0.7
Other area 143.6 82.8
Total 173.4 100.0
Table 9. The types and areas of soil depth the inside of a landform of possible production areas for Tricholoma matsutake in Yangyang-gun
Figure 4. The location map of soil depth the inside of a landform of possible production areas for Tricholoma matsutake in Yangyang-gun
Types Area(㎡) Ratio(%) Multi-layered Pinus densiflora forest with Pinus densiflora being predominant in understrory
layer (less than 30㎝ of diameter of breast height(DBH)) 0.80 1.26
Single-layered Pinus densiflora
(less than 30㎝ of DBH) 15.89 25.10
Multi-layered Pinus densiflora forest with Pinus densiflora predominant in understrory layer
(more than 30㎝ of DBH) 0.10 0.17
Multi-layered Pinus densiflora forest with Pinus densiflora predominant in understrory layer
(less than 30㎝ of DBH) 0.01 0.02
Single-layered Pinus densiflora forest
(less than 30㎝ of DBH) 1.81 2.86
Multi-layered Pinus densiflora forest with Pinus densiflora predominant in understrory layer
(more than 30㎝ of DBH) 0.00 0.00
Multi-layered Pinus densiflora forest with Quercus predominant in understrory layer
(less than 30㎝ of DBH) 10.98 17.35
Single-layered Pinus densiflora forest with Quercus predominant in shrub layer
(less than 30㎝ of DBH) 25.56 40.39
Multi-layered Pinus densiflora forest with Quercus predominant in understrory layer
(more than 30㎝ of DBH) 0.72 1.14
Single-layered Pinus densiflora forest with Quercus predominant in shrub layer
(more than 30㎝ of DBH) 2.30 3.64
Single-layered Pinus densiflora forest
(more than 30㎝ of DBH) 1.82 2.88
Multi-layered Pinus densiflora forest with Quercus predominant in understrory layer
(less than 30㎝ of DBH) 1.49 2.36
Single-layered Pinus densiflora forest with Quercus predominant in shrub layer
(less than 30㎝ of DBH) 1.67 2.65
Multi-layered Pinus densiflora forest with Quercus predominant in understrory layer
(more than 30㎝ of DBH) 0.01 0.01
Single-layered Pinus densiflora Forest
(more than 30㎝ of DBH) 0.12 0.18
Total 63.29 100.00
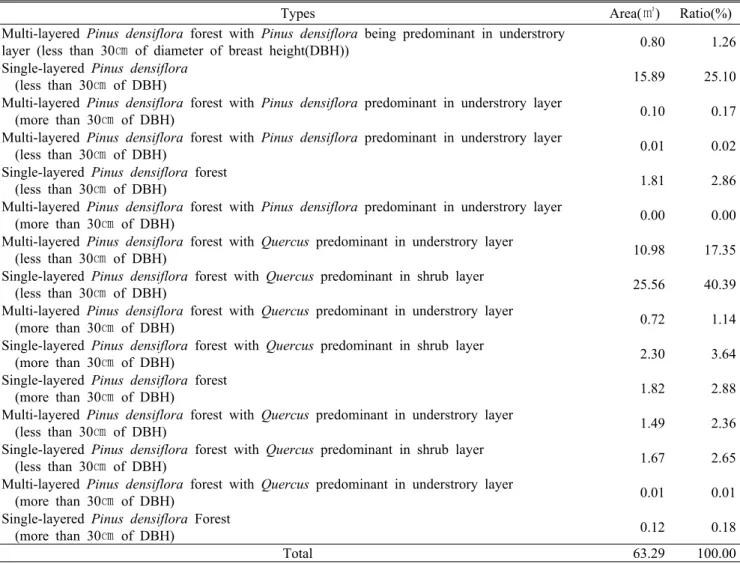
Table 10. The types and areas of biotope of Pinus densiflora in Yangyang-gun 실제 송이가 발생한 지역의 토심을 기준으로 10㎝ 미만인
지역으로 유형화하였다. 송이 생산 불가능지는 기존 연구결 과와 송이 생산지 현장 검토결과를 고려하여 A0층 깊이가 10㎝ 이상인 지역으로 설정하였다. 현장조사 결과 송이 발 생의 최적 조건인 토심 4㎝ 미만인 지역은 19.2㎢, 11.0%였 으며 송이 발생이 가능한 토심인 10㎝ 미만인 지역은 40.8
㎢, 23.6%이었다. 토심 10㎝ 이상으로 송이 발생이 불가능 한 지역은 3.3㎢, 1.9%로 소규모로 분포하였다. 토심이 4㎝
미만인 지역은 주로 표고가 높고 경사가 급한 내륙산림에 주로 분포하였고, 토심 4~10㎝인 지역은 내륙 산림 일부와 동해와 인접한 표고가 낮고 경사가 비교적 완만한 산림지역 에 주로 분포하였다. 토심 10㎝ 이상인 지역은 남대천 하구 와 인접한 해안가 산림지역 일부가 해당되었다.
지형 조건과 토심을 종합한 결과 송이 발생 적정 토심인 4㎝ 미만인 지역은 9.2㎢, 5.3%이었고, 송이 발생 가능 토 심인 4~10㎝인 지역은 19.3㎢, 11.1%로 지형조건과 토심
을 종합하여 송이 발생이 가능한 지역은 총 22.5㎢, 16.4%
이었다. 그 외에 지형은 송이 발생이 가능하나 토심이 부적 합한 지역으로 1.3㎢, 0.7%였으며, 기타지역이 143.6㎢이 었다.
3) 식생 조건
양양군 소나무림 식생구조에 대한 지도화 기준 및 기준 적용은 교목층, 아교목층, 관목층의 세부 식생구조에 따라 유형화하였다. 교목층은 소나무의 우점도에 따라 소나무가 100% 우점하는 소나무 순림과 소나무 우점도 90% 이상의 소나무림을 송이 생산이 가능한 교목층 식생구조로 유형화 하였으며 나머지 낙엽활엽수 및 혼효림은 기타산림으로 구 분하였다. 흉고직경은 교목층 소나무의 노령화를 반영하기 위해 흉고직경 30㎝를 기준으로 유형화하였다. 아교목층은 우점종에 따라 소나무와 기타 참나무류로 구분하였으며, 식 피율 15%를 기준으로 다층구조와 단층구조를 유형화하였
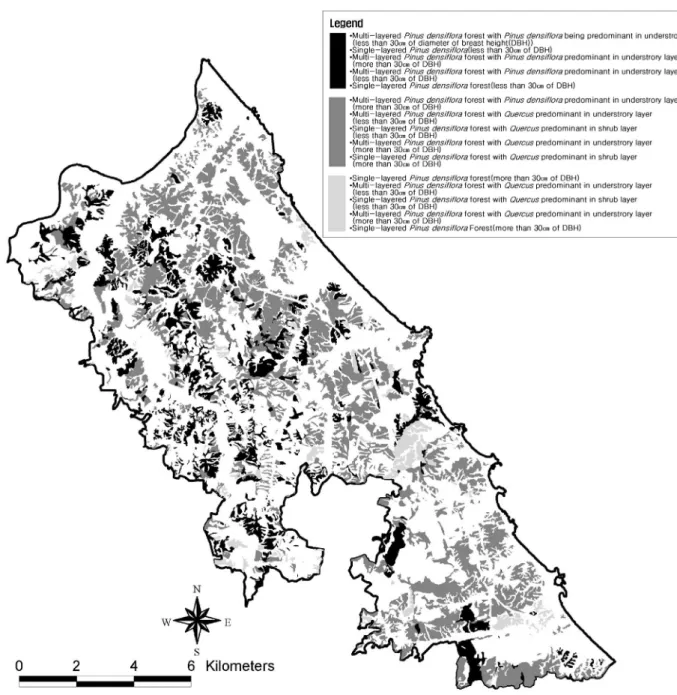
Figure 5. The location map of biotope of Pinus densiflora in Yangyang-gun
다. 관목층은 우점종을 교목성상 수종인 참나무류와 기타 관목성상의 수종으로 구분하였다.
비오톱 지도 작성 대상지 173.4㎢ 중 63.3㎢가 소나무 순림 혹은 소나무가 90% 이상 우점하는 소나무림이었으며 유형분류 기준에 의해 총 15개 유형으로 구분되었다. 주요 유형을 살펴보면 흉고직경 30㎝ 미만의 단층구조의 소나무 순림이 전체 소나무림의 25.10%로 남대천 유역권을 중심으 로 한 내륙 산림에 주로 분포하였다. 흉고직경 30㎝ 미만의 아교목층에 참나무류가 우점하는 다층구조의 소나무 순림
은 17.35%로 남대천변 일부와 현남면의 내륙 산림 및 해안 에 인접한 낮은 산림에 분포하였다. 관목층에 참나무류가 우점하는 흉고직경 30㎝ 미만의 단층구조 소나무 순림은 40.39%로 손양면과 현남면의 내륙 산림 일부와 해안과 인 접한 표고가 낮은 산림에 가장 넓은 면적으로 분포하였다.
4) 송이의 생육특성을 고려한 소나무비오톱 지도화 지형 조건과 토양 조건을 모두 만족한 지역 내에 소나무 순림 혹은 소나무 90% 이상의 혼효림만을 소나무비오톱으
Types Standard Detail Contents
Possible production area for Tricholoma matsutake
landform and soil structure
▪landform that enables Tricholoma matsutake production and Pinus densiflora biotope distributed in soil structure
vegetational structure
▪Single-layered Pinus densiflora biotope of more than 30㎝(DBH)-Tree species of other shrub is dominant in shrub layer
▪Multi-layered Pinus densiflora biotope with Pinus densiflora forest predominant in understrory layer
Potential production area for Tricholoma matsutake
landform and soil structure
▪Landform that enables Tricholoma matsutake production and Pinus densiflora biotope distributed in soil structure
vegetational structure
▪Single-layered Pinus densiflora biotope of more than 30㎝(DBH)
▪Multi-layered Pinus densiflora biotope with Quercus predominant in the understrory layer
▪Single-layered Pinus densiflora biotope with Quercus predominant in shrub layer
Area where Tricholoma matsutake production is impossible
▪Landform where Tricholoma matsutake production is impossible and Pinus densiflora forest distributed in soil structure
Table 11. Standard for dividing possible production and potential production areas for Tricholoma matsutake in Pinus densiflora orest in Yangyang-gun
Type Area
(㎢)
Sub Ratio (%)
Ratio (%)
Possible production area for Tricholoma matsutake
▪Multi-layered Pinus densiflora forest with Pinus densiflora being
predominant in understrory layer(less than 30㎝ of DBH) 0.46 4.67 0.72
▪Single-layered Pinus densiflora forest(less than 30㎝ of DBH) 8.36 85.36 13.21
▪Multi-layered Pinus densiflora forest with Pinus densiflora
predominant in understrory layer(more than 30㎝ of DBH) 0.07 0.72 0.11
▪Multi-layered Pinus densiflora forest with Pinus densiflora
predominant in understrory layer(less than 30㎝ of DBH) 0.00 0.02 0.00
▪Single-layered Pinus densiflora forest(less than 30㎝ of DBH) 0.90 9.22 1.43
▪Multi-layered Pinus densiflora forest with Pinus densiflora
predominant in understrory layer(more than 30㎝ of DBH) 0.00 0.01 0.00
Sub total 9.80 100.00 15.48
Potential production area for Tricholoma matsutake
▪Multi-layered Pinus densiflora forest with Quercus predominant
in understrory layer(less than 30㎝ of DBH) 4.97 24.21 7.85
▪Single-layered Pinus densiflora forest with Quercus predominant
in shrub layer(less than 30㎝ of DBH) 11.80 57.50 18.64
▪Multi-layered Pinus densiflora forest with Quercus predominant
in understrory layer(more than 30㎝ of DBH) 0.39 1.90 0.62
▪Single-layered Pinus densiflora forest with Quercus predominant
in shrub layer(more than 30㎝ of DBH) 1.15 5.58 1.81
▪Single-layered Pinus densiflora(more than 30㎝ of DBH) 0.79 3.85 1.25
▪Multi-layered Pinus densiflora forest with Quercus predominant
in understrory layer(less than 30㎝ of DBH) 0.55 2.68 0.87
▪Single-layered Pinus densiflora forest with Quercus predominant
in shrub layer(less than 30㎝ of DBH) 0.82 3.99 1.30
▪Multi-layered Pinus densiflora forest with Quercus predominant
in understrory layer(more than 30㎝ of DBH) 0.00 0.00 0.00
▪Single-layered Pinus densiflora forest(more than 30㎝ of DBH) 0.06 0.28 0.09
Sub total 20.52 100.00 32.42
Impossible area for Tricholoma matsutake production 32.97 - 52.10
Total 63.29 - 100.00
Table 12. Gross area and ratio for each type of Pinus densiflora biotope where Tricholoma matsutake production is possible in Yangyang-gun
Figure 6. The location map of Pinus densiflora biotope Where Tricholoma matsutake production is possible in Yangyang-gun
로 분류하였으며, 이중 아교목층에 소나무가 우점하는 단층 혹은 다층구조를 송이 생산 가능지로, 그 외 지역을 잠재지 로 구분하였다.
지형 조건, 토양 조건, 식생 조건을 종합하여 최종적인 소나무비오톱지도 작성을 위한 유형을 송이생산 가능지, 송 이생산 잠재지, 송이생산 불가능지로 구분하여 제시하였다.
송이생산 가능지는 송이생산이 가능한 지형구조 및 토양구 조 내 분포하는 소나무 비오톱으로 관목층에 기타 관목성상 의 수종이 우점하는 흉고직경 30㎝ 미만의 단층구조의 소 나무 비오톱과 아교목층에 소나무가 우점하는 다층구조의 소나무비오톱이 해당되었다. 송이생산 잠재지는 송이생산 이 가능한 지형구조 내에 분포하고 있으나 흉고직경 30㎝
이상의 노령화된 소나무가 우점하는 단층구조의 소나무비
오톱, 아교목층에 참나무류가 우점하는 소나무 비오톱, 관 목층에 참나무류가 우점하는 단층구조의 소나무 비오톱 등 식생구조가 부적절한 지역으로 향후 식생관리를 통해 송이 발생 유도가 가능한 지역이었다.
Table 12는 송이 생산이 가능한 지형, 토양환경, 소나무 비오톱을 종합한 송이 생육환경 특성을 고려한 소나무비오 톱 유형별 면적 및 비율을 제시한 것이다. 소나무비오톱은 송이생산 가능지 6개 유형, 송이생산 잠재지 9개 유형, 송이 생산 불가능지 등 총 16개 유형으로 구분되었다. 송이생산 가능지는 전체 소나무림 중 총 9.8㎢, 15.48%이었고, 송이 생산 잠재지는 20.52㎢, 32.42%이었으며 송이생산 불가능 지는 32.97㎢, 52.10%이었다. 세부 유형을 살펴보면 송이 생산 가능지 비오톱에서는 흉고직경 30㎝ 미만의 단층구조