1. INTRODUCTION
While until the 1990s, coffee consumption per capita in the Republic of Korea has been around 1.2 kg per year, since 2000, it has skyrocketed to 3.84 kg per year in 2014, with the average annual rate of 9%. This means that a Korean person drinks on average 384 cups of coffee per year (generally, a cup of Americano requires about 10 g of beans), and it is also estimated that, when the coffee consumption target group is limited to adult population aged 20 years or older, one Korean drinks about 592 cups per year (estimated by ACNielsen).
Therefore, for Koreans, coffee is a popular beverage intrinsi- cally involved in everyday life (Korea McNulty Business Report, 2016).
Domestic coffee consumption has grown from about 1 million bags in 1990 to about 1.9 million bags in 2014, growing at the rate of 2% per annum over the past 25 years. Further- more, domestic coffee consumption is expected to maintain a stable 1.2~1.3% share of world coffee consumption, with exceeding 2 million bags in 2015 (International Coffee Organi- zation (ICO), 2016).
The reason why companies continue to enter the coffee market is because they are likely to have a strong growth potential for premium coffee and consumers who drank rela- tively cheap coffee are gradually shifting to high-quality coffee.
In fact, according to ICO, the coffee-mix market in Korea decreased by 17.7% from 1,239 billion won in 2012 to 1,200 billion won in 2015. On the other hand, the coffee bean Information available at the Culinary Society of Korea (http://www.culinary.re.kr/)
Culinary Science & Hospitality Research
Journal & Article Management System: https://cshr.jams.or.kr/
21-28
http://dx.doi.org/10.20878/cshr.2018.24.2.001
The Factors influencing Customer Satisfaction with and Revisiting Coffee Shops in Korea:
The Moderating Roles of Psychological Value
Seong-Soo Cha & Bo-Kyung Seo
Dept. of Food Science and Service, College of Bio-Convergence, Eulji University
KEYWORDS ABSTRACT
Coffee shop, Selection attribute, Satisfaction, Revisit, Hedonic value, Utilitarian value.
This study aims to find what attributes of consumer satisfaction are more important when con- sumers choose coffee shops. Factors when customers choose coffee shops that are considered to be more crucial, such as taste, price, brand, and atmosphere, were tested and also relations between satisfaction and revisit were studied. As a result, factors as ‘taste’, ‘price’, ‘brand’, and
‘atmosphere’ were found to significantly affect satisfaction; in addition, the path that satisfaction leads to revisit was found to be significant. However, consumers' coffee shop selection attributes differed depending on their psychological consumption value. The path-coefficients from taste and price to satisfaction were more significant in the function-oriented group, meanwhile the path- coefficient from brand to satisfaction was significant in the emotion-oriented group (+) and the function-oriented group (-). The results of this study suggest attributes of selecting coffee shops and provide meaningful implications of consumer value when they choose the attributes.
Corresponding author: Bo-Kyung Seo, Dept. of Food Science and Service, College of Bio-Convergence, Eulji University, 553 Sangseong-daero, Sujeong-gu, Seongnamsi, Gyeonggi-do 13135, South Korea. Tel. +82-10-9968-2669, Fax. +82-31-740-7389, E-mail: [email protected]
market increased by 23.3% over the same period. Domestic coffee imports also increased from 126,360 tons to 151,080 tons during the same period. It is expected to reach 160,000 tons in 2016. The number of Korean specialty coffee shops, which was only 2,300 in 2007, is expected to exceed 50,000 in 2016 (Korea Economic Daily, September 6, 2016).
As such, the market for coffee shops expanded from simple beverage to reflect the social phenomenon that has become a cultural code of young people in Korea. Nevertheless, there was no study on coffee shop attributes through the psycholo- gical consumption value. Therefore, this study will be a mile- stone in the direction of development and marketing and operational plan of coffee brands or companies preparing for opening a coffee shop in the near future.
The purpose of this study is to investigate the charac- teristics of store selection according to the consumption value of coffee shops based on previous studies. Therefore, the following research objectives were set. First, the relationship between satisfaction factors and store selection attributes of domestic coffee shop was examined. Second, the relationship between satisfaction and revisit of coffee shops in the market was verified. Third, the moderating effect of the psychological consumption value was studied considering the store selec- tion attributes of coffee shop satisfaction.
2. LITERATURE REVIEW
2.1. Coffee Shop Store Selection Attributes
Attributes generally refer to types and intangible features of a product or service, and a product or service is a bundle of attributes (Kotler, P., Bowen, J. T., Makens, J. C., & Baloglu, S., 2006). Among attributes of a product, a trademark or a store, a property that is closely related to a consumer's pre- ference behavior, purchase decision, and revisit is referred to as a deterministic property or an optional property (Lewis, 1983). Attributes are the essence of an entity, a property that always belongs to an object, which is always an attribute.
Therefore, the selection attribute is a factor influencing the choice, meaning that the result of different selection of the comparison group is extracted as a factor (Zikmund, 1997).
Therefore, the coffee shop preference attribute generally refers to the attributes that are considered to be important when choosing a coffee shop. Research on selective attributes related to eating out has been extensively conducted (Balakri- shnan, Lee, Shuaib, & Marmaya, 2009; Morgan, 1993) and the
characteristics of previous research on the choice attributes of restaurant users have been studied in terms of food quality, variety of menu, service of employee, price, atmosphere, loca- tion, and convenience (Swinyard & Struman, 1986; Lewis, 1981; Schroeder, 1985; June & Smith, 1987; Morgan, 1993). In this domain, Morgan (1993) and Swinyard and Struman (1986) found that the taste and quality of coffee were one of the most important attributes of choice for coffee shop users.
The taste and atmosphere of a coffee shop influence trust and the atmosphere has a significant effect on satisfaction (Kim, 2015). The taste and quality of coffee are important property variables and it is widely known that they have a significant effect on customers’ satisfaction and revisit. This study confirms that, in choosing coffee shops, most consu- mers value taste and quality, which are the primary attributes of coffee products, rather than price or other service quality attributes.
If consumers are satisfied with a particular brand, they have a preference for the brand and thus they make purchasing decisions about the most preferred brand, resulting in sub- stantial purchasing (Brown & Stayman, 1992; Low & Lamb, 2000). Therefore, based on the results of previous studies, the following hypotheses were formulated:
H1: Coffee taste and quality would have a significant effect on satisfaction of coffee shop users.
H2: Coffee price would have a significant effect on satis- faction of coffee shop users.
H3: Coffee brand would have a significant effect on satis- faction of coffee shop users.
H4: Coffee shop atmosphere would have a significant effect on satisfaction of coffee shop users.
2.2. Satisfaction and Revisit
Westbrook and Black (1985) found that shopping satisfac- tion depends on whether the shopper experiences a pleasant
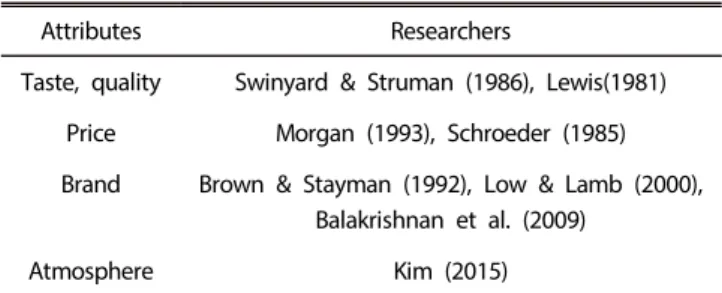
Table 1. Summary of previous researches
Attributes Researchers
Taste, quality Swinyard & Struman (1986), Lewis(1981) Price Morgan (1993), Schroeder (1985) Brand Brown & Stayman (1992), Low & Lamb (2000),
Balakrishnan et al. (2009)
Atmosphere Kim (2015)
shopping experience and can be directly measured by the strength of shopping motivation. Customer satisfaction is re- lated to customer experience (Lilijander & Strandvik, 1995) as emotional states that emerge from interaction-based response (Crosby, Evans, & Cowles, 1990). As the physical factors of coffee shops became more important, customer satisfaction increased (Kim, Kim, & Lee, 2015).
Revisiting is driven by customers' satisfaction with their products and services and provides long-term favorable rela- tionships with customers when they provide good value to customers (Kandampully & Duddy, 1999; Cha & Park, 2014).
In a highly competitive marketplace, a firm is assured of its ability to maintain customers' repeat visits and repurchases, which can reduce perceived risk and increase perceived value by improving the quality of service and customer relationship (Kandampully & Butler, 2001). Furthermore, Lee (2016) found that the service quality of the coffee shop influences brand image and revisit intention. Therefore, the following hypo- thesis was formulated:
H5: Satisfaction of coffee shop users would have a sig- nificant effect on revisit intention.
2.3. Psychological Consumption Value
Functional value is defined as the usefulness of a product from the perceived quality and expected performance of the product (Sweeney & Soutar, 2001). For example, consumer gains satisfaction with a functional value when the quality and performance of the product or service exceeds the expected results. Functional value is a value based on important ma- terial attributes, such as performance, reliability, durability, and price, trust, ease of payment, ease of refund and is a value pursued by rational businessperson (Sheth, J. N., New- man, B. I., & Gross, B. L., 1991; Cha & Park, 2017).
Emotional value is defined as usefulness of a product in terms of its consumers’ emotional states or feelings (Sweeney
& Soutar, 2001). The emotional benefits consumers’ expe- rience through their consumption experience play an impor- tant role in making purchasing decisions, because they occur unconsciously. Therefore, if the consumer has a positive feeling towards a product or service, the satisfaction for the emotional value increases. Emotional values can induce con- sumers' selective behavior by non-cognitive and unconscious motives. Therefore, the following two hypotheses can be formulated:
<H2>
<H3>
<H1>
<H6>, <H7> Psychological consumption value
<H5>
<H4>
Brand Taste
Price
Atmosphere
Satisfaction Revisit
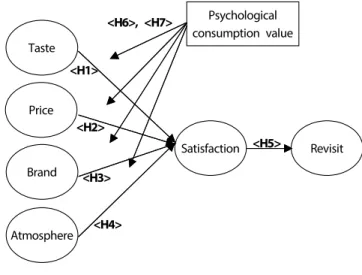
Fig. 1. Research model.
H6: The functional value of consumers would be greater than the emotional value in the effect of taste and price on satisfaction with coffee shop.
H7: The emotional value of consumers would be greater than the functional value in the effect of brand and atmosphere on satisfaction in coffee shop.
3. METHODOLOGY
The questionnaire items from previous studies were revised to fit the research purpose of the present study. From Feb- ruary 1 to February 25, 2017, the questionnaires were ad- ministered using both on-line and off-line survey methods (including SNS and e-mail). A total of 412 questionnaires were collected and, after excluding unreliable or incomplete 63 responses, a total of 349 questionnaires were used for further empirical analysis.
This study was conducted with the following analysis method. First, to verify the convergence validity and discri- minant validity among the measured variables, exploratory factor analysis was performed using Amos 20.0. Then, the non-compliant factors were removed and the confirmatory factor analysis was performed again using Amos 20.0. Next, the covariance structure model analysis was used as a statis- tical method for the hypothesis testing of the study.
Of the total 349 respondents, 175 (50.1%) were males and 174 (49.9%) were females. Most respondents were in their 20s (59.3%) and 40s (29.2%); professionally, most of them were students (55.9%), and workers (24.6%). Many of them reported visiting a coffee shop 2~5 times (48.1%) and 1 time (41.3%) per week. 64.2% reported spending less than USD 50 per
month and the most favorable coffee shop brand was Starbuck Korea.
4. RESULTS
4.1. Evaluate Metrics
First, reliability analysis and validity analysis were con- ducted on the items of constitutional concept measured in multiple items (Churchill, 1979). Exploratory factor analysis was conducted to evaluate reliability and validity, and Cron- bach's alpha was examined. Principal Component Analysis was used for factor extraction. Factors were extracted based on Eigenvalue 1. VARIMAX was applied to the factor rotation method. Table 2, Table 3. shows the results of the analysis.
As shown in Table 2, Table 3, Cronbach's alpha coefficients are all over 0.9, which confirms reliability (Nunnally, 1967).
Exploratory factor analysis showed that discriminant validity and convergence validity was confirmed and the validity factor was analyzed by Amos 20.0.
As shown in Table 4, the chi-square value of the measure-
Table 2. Exploratory factor analysis
Variables
Taste Price Brand Atmosphere
Taste 01 .858 .098 .236 .239
Taste 02 .859 .069 .261 .266
Taste 03 .903 .087 .194 .252
Taste 04 .861 .072 .164 .229
Price 01 .013 .894 .041 -.063
Price 02 .055 .904 .141 .037
Price 03 .084 .875 .160 .115
Price 04 .121 .902 .010 .022
Brand 01 .212 .091 .837 .206
Brand 02 .249 .151 .865 .270
Brand 03 .280 .129 .854 .228
Atmos 01 .321 -.015 .309 .750
Atmos 02 .282 .022 .188 .804
Atmos 03 .154 .058 .133 .883
Atmos 04 .238 .030 .191 .855
Variance (%):
Total 83.5% 23.4 21.8 17.3 20.9
Cronbach’s alpha 0.95 0.92 0.92 0.91
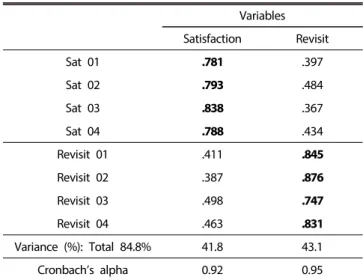
Table 3. Exploratory factor analysis
Variables Satisfaction Revisit
Sat 01 .781 .397
Sat 02 .793 .484
Sat 03 .838 .367
Sat 04 .788 .434
Revisit 01 .411 .845
Revisit 02 .387 .876
Revisit 03 .498 .747
Revisit 04 .463 .831
Variance (%): Total 84.8% 41.8 43.1
Cronbach’s alpha 0.92 0.95
Table 4. Confirmatory factor analysis result Variables Measure Standardized
regression coefficient CR AVE
Taste
Taste 01 0.901
0.951 0.830
Taste 02 0.925
Taste 03 0.954
Taste 04 0.863
Price
Price 01 0.842
0.923 0.750
Price 02 0.895
Price 03 0.864
Price 04 0.862
Brand
Brand 01 0.784
0.922 0.798
Brand 01 0.964
Brand 01 0.922
Atmos- phere
Atmos 01 0.831
0.908 0.711
Atmos 01 0.828
Atmos 01 0.841
Atmos 01 0.873
Satis- faction
Sat 01 0.831
0.931 0.771
Sat 02 0.932
Sat 03 0.870
Sat 04 0.875
Revisit
Rev 01 0.924
0.955 0.842
Rev 02 0.940
Rev 03 0.864
Rev 04 0.939
Chi-square=266.662 (p=0.001, df=84), NFI=0.945, CFI=0.961, RMSEA=0.074
ment model is significant (p=0.00), but it is sensitive to the model complexity and sample size. Therefore, it was judged to be appropriate to evaluate the model fit in consideration of the NFI (normedfit index) and the CFI (comparative fit index) (Bearden, Sharma, & Teel, 1982; Bagozzi & Yi, 1988).
Overall model fit was rated satisfactory by NFI=0.945, CFI=
0.961, and RMSEA=0.074. The composite reliability (CR) and average variance extracted (AVE) satisfied the criteria pro- posed by Bagozzi and Yi (1988) (above 0.6 for CR, above 0.5 for AVE) and the loadings were statistically significant (p<0.01).
The convergent validity was confirmed.
Table 4 shows the results of confirmatory factor analysis.
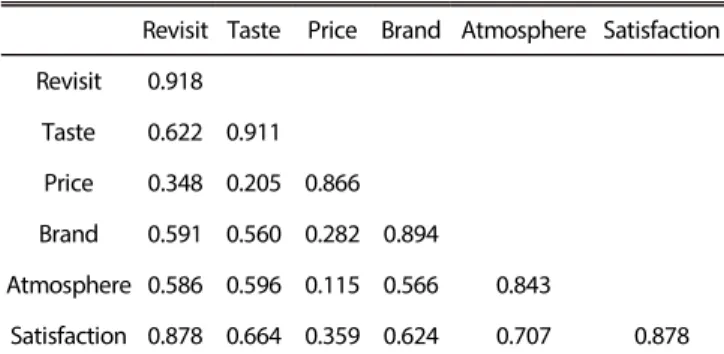
The square root of average variance extracted (AVE) was used to verify discriminant validity among each factor with single dimensionality. As a result, as shown in Table 5, the value of the square root of AVE is greater than 0.5, which is larger than the correlation value outside the diagonal line in the related row and column. Therefore, it can be said that the validity of the discrimination between the different constitutional concepts has been verified, in which corresponding differences in the measurement results are to be shown.
4.2. Research Hypothesis Verification
The research hypotheses were tested using Amos 20.0. For the study model, the fitness index was satisfactory with chi- square=266.662 (df=84, p=0.001), NFI=0.945, CFI=0.961 and RMSEA=0.074. Table 6 shows the results of hypotheses testing for the main effects from Hypothesis 1 to Hypothesis 5. As a result of the hypothesis test on the main effect, the taste, price, brand and environment showed a significant influence on the satisfaction, and the path coefficient from the satisfac- tion to revisit was also significant. The results of the above verification are shown in Fig. 2.
Table 5. Discriminant validity through correlation analysis
Revisit Taste Price Brand Atmosphere Satisfaction Revisit 0.918
Taste 0.622 0.911 Price 0.348 0.205 0.866 Brand 0.591 0.560 0.282 0.894
Atmosphere 0.586 0.596 0.115 0.566 0.843
Satisfaction 0.878 0.664 0.359 0.624 0.707 0.878 The values presented at the diagonal are the square root of AVE.
Table 6. Results of research hypothesis Hypo-
thesis Paths Path
coefficient t value Results H1 Taste Satisfaction 0.286 5.80*** Support H2 Price Satisfaction 0.208 5.33*** Support H3 Brand Satisfaction 0.187 3.83*** Support H4 Atmosphere Satisfaction 0.399 7.45*** Support H5 Satisfaction Revisit 0.880 20.18*** Support
* p<0.05, ** p<0.005, *** p<0.001.
Price
Brand
Atmosphere
Satisfaction Revisit
Taste
0.286(t=5.80)
0.399(t=7.45) 0.187(t=3.83)
0.880 (t=20.18) 0.208(t=5.33)
Fig. 2. Results of research hypothesis.
4.3. Verifying the Moderating Effect of Consumer Psychological Consumption Value
In order to examine the effect of consumer consumption value on the coffee shop, first, the total sample (n=349) was divided into the emotional value group and the functional value group and the path coefficients were compared. Based on the average value, the groups were divided into the high emotional group, the low emotional (functional) group, the high functional group, and the low functional (emotional) group. Consumer consumption value of coffee shop was classified into emotional value and functional value. Cron- bach's alpha value of each item was 0.892 for emotional con- sumption value and 0.913 for functional consumption value.
Therefore, consumers who value functional value are more influenced by the taste and price of coffee shops, meanwhile consumers who value emotional value are more influenced by the brand and atmosphere of coffee shops. This implies that emotional and functional groups are more sensitive to the effect of store selection factors on consumer satisfaction. The results show that coffee taste, price, and brand all have statis-
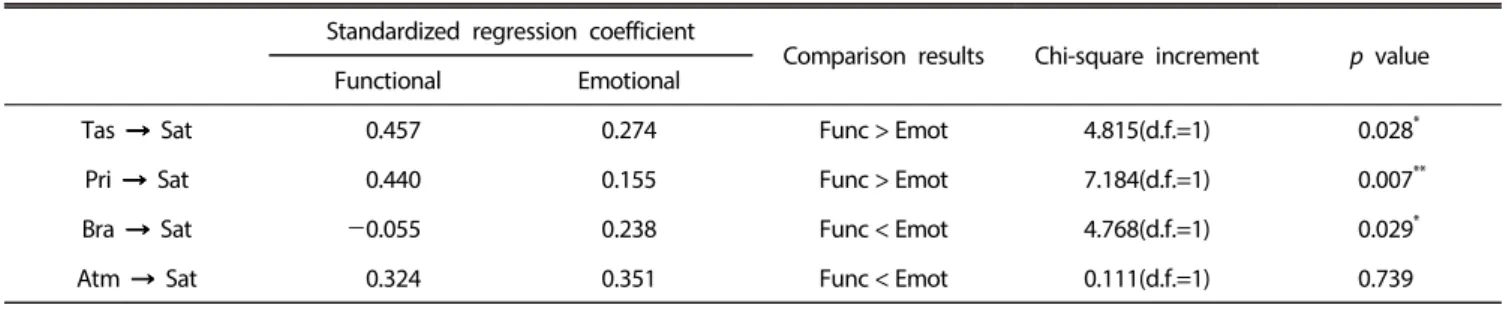
Table 7. Comparison of functional consumption value group and emotional consumption value group Standardized regression coefficient
Comparison results Chi-square increment p value
Functional Emotional
Tas Sat 0.457 0.274 Func > Emot 4.815(d.f.=1) 0.028*
Pri Sat 0.440 0.155 Func > Emot 7.184(d.f.=1) 0.007**
Bra Sat -0.055 0.238 Func < Emot 4.768(d.f.=1) 0.029*
Atm Sat 0.324 0.351 Func < Emot 0.111(d.f.=1) 0.739
* p<0.05, ** p<0.005, *** p<0.001.
tically significant effects on satisfaction (see Table 7).
5. CONCLUSION
The purpose of this study was to find out which of the store selection attributes of consumers who use coffee shop are more important factors in terms of consumer satisfaction.
Based on literature overview and examination of the causality where satisfaction leads to repeat visits, four selection factors were considered to be most suitable for the store selection attributes of coffee shops.
Our results suggest that coffee taste, price, brand, and atmosphere have significant effects on satisfaction (p<0.001).
In addition, the path coefficient connecting satisfaction with revisit was statistically significant as well. However, these relationships differed according to consumers' psychological consumption value. In the effect of coffee taste on satisfac- tion, both the emotional consumption value group and the functional consumption value group had a positive influence, but the function-oriented consumer group had a statistically greater influence (p=0.028). The effect of price on satisfaction was also shown to have a positive effect on both the emotional consumption value group and the functional consumption value group. However, the consumer groups with functional value had a statistically greater impact than the other group (p=0.007). The effect of the brand on satisfaction was found to be significantly affected by the functional consumption value group (-) and the emotional consumption value group (+) (p=0.029). The emotional consumption value group and the functional consumption value group all had an influence on the satisfaction of the atmosphere of the coffee shop, but this influence did not reach statistical significance. This result suggests that the factors influencing satisfaction are affected by psychological consumption value while visiting coffee specialty stores. Therefore, functional value-oriented consumers
are more influenced by the taste and price of coffee shops, while emotional value-oriented consumers are more influenced by coffee shop’s brand.
6. IMPLICATIONS AND LIMITATION
Taken together, the results of the present study provide the following implications for businesses operating coffee shops.
First, store selection attributes that consumers consider impor- tant when choosing coffee shops are taste, price, brand, and atmosphere. Second, congruently with our expectations, the utilitarian value-oriented consumer group was found to be more influenced by the taste and price of coffee shops, while hedonic value-oriented consumer group was found to be more influenced by the brand and atmosphere.
These findings can be used as a strategic marketing point for a specific consumer who has a certain consumption pattern when a company runs a coffee business performs targeted marketing using an internal data base. For example, consu- mers who have been identified as having a utilitarian value- based consumption of Americano or basic beverage as a result of their customer data base would focus their promo- tions on flavor and price. On the other hand, it will be necessary to continue marketing to strengthen the brand image of coffee shops for those consumers who are more likely to buy more sensitive items.
This study has several limitations that should be addressed in future research. First, in this study, only taste (quality), price, brand, and atmosphere were judged to be the most impor- tant attributes of coffee shop selection in the model construc- tion. In addition to this, more complex and integrated study would be needed by adding more attributes such as accessi- bility, service, store design, menu diversity, etc. Second, in this study, psychological value was classified into the functional value-oriented consumer group and the emotional value-
oriented consumer group. However, in further research, it would necessary to also study other value dimensions based on the research of consumer values.
REFERENCES
Bagozzi, R. P., & Yi, Y. (1988). On the evaluation of structural equation models. Journal of the Academy of Marketing Science, 16(1), 74-94.
Balakrishnan, B. K., Lee, S., Shuaib, A. S. M., & Marmaya, N.
H. (2009). The impact of brand personality on brand pre- ference and loyalty: Empirical evidence from Malaysia.
Business Education & Accreditation, 1(1), 109-119.
Bearden, W. O., Sharma, S., & Teel, J. E. (1982). Sample size effects on chi square and other statistics used in evalua- ting causal models. Journal of Marketing Research, 425-430.
Brown, S. P., & Stayman, D. M. (1992). Antecedents and conse- quences of attitude toward the ad: A meta-analysis. Jour- nal of Consumer Research, 19(1), 34-51.
Cha, S. S., & Park, C. (2014). The factors of complex shopping mall influencing customer satisfaction in Korea. Journal of Distribution Research, 19(4), 91-116.
Cha, S. S., & Park, C. (2017). Consumption value effects on shopping mall attributes: Moderating role of on/off-line channel type. Journal of Distribution Science, 15, 5-12.
Churchill Jr, G. A. (1979). A paradigm for developing better measures of marketing constructs. Journal of Marketing Research, 64-73.
Crosby, L. A., Evans, K. R., & Cowles, D. (1990). Relationship quality in services selling: An interpersonal influence per- spective. The Journal of Marketing, 68-81.
International Coffee Organization (2016).
June, L. P., & Smith, S. L. (1987). Service attributes and situa- tional effects on customer preferences for restaurant dining.
Journal of Travel Research, 26(2), 20-27.
Kandampully, J., & Butler, L. (2001). Service guarantees: A strategic mechanism to minimise customers’ perceived risk in service organisations. Managing Service Quality: An International Journal, 11(2), 112-121.
Kandampully, J., & Duddy, R. (1999). Competitive advantage through anticipation, innovation and relationships. Ma- nagement Decision, 37(1), 51-56.
Kim, H. J., Kim, H. J., & Lee, S. M. (2015). The relationships between physical environment, consumer satisfaction and consumption behavior: Focused on college students. The Korean Culinary Sciences & Foodservice Research, 21(4),
325-338.
Kim, Y. K. (2015). The effects attributes of dessert cafe selec- tion on relationship quality and behavioral intentions. The Korean Journal of Culinary Research, 21(6), 38-48.
Korea Economic Daily (September 6, 2016).
Korea McNulty Business Report (2016).
Kotler, P., Bowen, J. T., Makens, J. C., & Baloglu, S. (2006).
Marketing for hospitality and tourism (Vol. 893). Upper Saddle River, NJ: Prentice hall.
Lee, S. H. (2016). The impact of low price coffee shop service quality, brand image on revisit intention. Culinary Science
& Hospitality Research, 22(3), 44-54.
Lewis, R. C. (1981). Restaurant advertising-appeals and consumers intentions. Journal of Advertising Research, 21(5), 69-74.
Lewis, R. C. (1983). Advertising and consumers' intentions.
Journal of Advertising Research, 21(5), 69-74.
Liljander, V., & Strandvik, T. (1995). The nature of customer relationships in services. Advances in Services Marketing and Management, 4(141), 67.
Low, G. S., & Lamb Jr, C. W. (2000). The measurement and dimensionality of brand associations. Journal of Product &
Brand Management, 9(6), 350-370.
Morgan, M. S. (1993). Benefit dimensions of midscale restau- rant chains. The Cornell Hotel and Restaurant Administra- tion Quarterly, 34(2), 40-45.
Nunnally, J. C. (1967). Psychometric theory. McGraw-Hill.
Schroeder, J. J. (1985). Restaurant critics respond: We're doing our job. Cornell Hotel and Restaurant Administration Quar- terly, 25(4), 56-63.
Sheth, J. N., Newman, B. I., & Gross, B. L. (1991). Why we buy what we buy: A theory of consumption values. Journal of Business Research, 22(2), 159-170.
Sweeney, J. C., & Soutar, G. N. (2001). Consumer perceived value: The development of a multiple item scale. Journal of Retailing, 77(2), 203-220.
Swinyard, W. R., & Struman, K. D. (1986). Market segmentation:
Finding the heart of your restaurant's market. Cornell Hotel and Restaurant Administration Quarterly, 27(1), 88-96.
Westbrook, R. A., & Black, W. C. (1985). A motivation-based shopper typology. Journal of Retailing, 61, 78-103.
Zikmund, W. G. (1997). Business research methods. Orlando : Dryden Press.
Received:
Revised:
Accepted:
24 March, 2017 04 July, 2017 04 September, 2017