A CFD Analysis on the Gas-Liquid Ejector 가스-액체 이젝터에 대한 CFD 해석
H. M. Jeong, T. Utomo, Z. H. Jin and H. S. Chung 정효민․토니 우토모․김진화․정한식
Key Words:Ejector(이젝터), Hydrodynamics Characteristics(유동특성), CFD Analysis(CFD 분석), Gas-Liquid (가스-액체)
요 약:가스-액체 이젝터에 관한 수치해석은 3차원 CFD 모델로 수행하였다. 본 논문에서는 이젝터의 유동특성 과 질량전달특성에 대한 작동조건과 이젝터의 기하학적 모형의 영향에 관한 연구를 수행하고자 한다. CFD 결과 실험 데이터에 의하여 검증되었으며, 유동 분석과 이젝터 성능의 예측 또한 실행되었다. 작동상태의 변화는 0.2
~ 1.2 범위에서 가스-액체 유량비를 변화시킴으로서 주어진다. 혼합관의 LM/DM이 4 ~ 10의 범위에서 변화를 주었다. CFD 연구는 길이와 직경비가 5.5일 때 체적 유량전달계수는 가스 유량이 증가함에 따라 증가한다는 것
을 나타낸다. 동시에 LM/DM가 4일 때 체적유량전달계수는 기체-액체 유량비가 0.6에서 최대치에 도달한다. 또한,
체적 유량전달계수는 혼합 튜브길이가 증가함에 따라 감소한다.
접수일 : 2007년 6월 29일, 채택확정: 2007년 11월 13일 정효민(책임저자) : 경상대 기계항공공학부, 해양산업연구소 E-mail :
[email protected] Tel : 055-640-3184
Tony Utomo, Z. H. Jin: 경상대학교 대학원 정밀기계공학과 정한식 : 경상대학교 기계항공공학부, 해양산업연구소
Nomenclature
d
D :
diffuser diameter (m)d
M :
maximum stable bubble diameter (m) dM :
mixing tube diameter (m)d
N :
nozzle diameter (m)k
L
a : volumetric mass transfer coefficient (l/s) QG :
volumetric gas flow rate (m3
/h)Q
L :
volumetric liquid flow rate (m3
/h) Tv : turbulent intensity1. Introduction
In the field of chemical and biochemical reaction engineering there has been increasing interest in jet loop reactors during the last decade, because of their high efficiency in gas dispersion resulting in high mass transfer rates.
Hydrogenation and chlorination are examples of such application in chemical process industry that utilize jet loop reactor. Many other examples concerning the utilization of jet loop reactor can
also be found e.g. in papers of Daucher
1)
, Cramers et al.2)
, Kim and Choi3)
, and Jeong et al.4)
.The principle in this reactor type is the utilization of the kinetic energy of high velocity liquid jet to entrain the gas phase and to create a fine dispersion of the two phases. Therefore, mixing and process equipment is the heart of any manufacturing processes that utilize this type of reactor. Due to their favourable mass transfer and mixing characteristics, ejectors are being increasingly used as gas-liquid contactor in such of these processes. A standard ejector, shown schematically in Fig. 1 consists of a nozzle, suction chamber, mixing tube, diffuser and draft tube. Primary or motive fluid, typically liquid, is pumped into the system at high velocity through a nozzle. According to Bernoulli's principle, a low-pressure region is created in the suction chamber. The secondary or entrained fluid, typically gas phase, gets sucked into this chamber. The gas and liquid phases get mixed and a gas-liquid dispersion is created in the mixing tube. A diffuser at the exit of the mixing tube helps in pressure recovery. When the secondary fluid gets sucked into the suction chamber, the gas and liquid flows are initially coaxial consisting of an annular secondary fluid
flow around a core or the primary fluid jet. This jet flow persists for a certain distance in the mixing tube. According to Witte
5)
, a so-called mixing shock occurs at a particular location in the mixing tube.In the region of this mixing shock, the two phase flow changes from jet flow into a homogeneous bubble flow and this flow-pattern transition is accompanied by a sudden pressure build-up. A part of the kinetic energy of the flow is dissipated in the shock creating the gas-liquid dispersion.
Behind this mixing zone, both phases flow homogeneously through the remaining part of ejector. When the gas-liquid flow stream leaves the ejector, a secondary dispersion of bubbles is obtained in the bulk fluid of the reactor vessel.
The dispersion finally disengages into two separate fluid phases in the vessel tank.
According to Cunningham and Dopkin
6)
, the location of the mixing shock zone is of key importance for the ejector performance.The optimum dispersion efficiency is achieved when the liquid jet breaks up just at the end of the mixing tube. If the jet disintegration occurs earlier, the flow of the homogeneous gas-liquid mixture through the remaining part of the mixing tube results in excessive friction losses. On the other hand, if the mixing tube is too short, the jet does not break up and accordingly the momentum transport between the phases does not occur. As a result, the ejector efficiency in such a case strongly decreases.
Fig. 1 Scheme of ejector
Obviously, the occurrence of the jet break-up and the position of the mixing shock zone in the
mixing tube depend generally on the gas and liquid flow rates and on the ejector geometrical parameters such as the length of mixing tube.
The effects of different operating conditions and ejectors geometry parameters on the performance of ejectors have been experimentally investigated by several researchers
7~12)
. According to the experiments of Dirix and van de Wiele8)
, the mixing tube length has no influence on the volumetric mass transfer coefficient. On the other side, Cramers et al. found the opposite fact that the volumetric mass transfer coefficient was influenced by the mixing tube length. However, they demonstrated that the mass transfer of both the ejector and vessel are influenced by the flow regime in the ejector. There is thus a need to develop a better understanding of hydrodynamics of the ejector systems.Recently, with the rapid development of numerical solution method, some researchers attempted to apply Computational Fluid Dynamics (CFD) in modeling the flow within ejectors. The merits of using CFD approach is the capability on producing details the flow field and fluid properties based on numerical solutions of the flow domain. Data that is difficult to obtain in an experimental set up can be easily analysed using CFD. Therefore, CFD modeling approach is utilized in this study to understand the fluid dynamics of ejector. In particular, the ejector geometry (mixing tube length) and the operating conditions are investigated for their influence on hydrodynamics and mass transfer characteristics of ejector.
There are numbers of paper that investigated ejector numerically using CFD
13~15)
. However, most of them modeled the ejector in two-dimensional modeling. In two-dimensional modeling, the CFD analysis could not account the effect of three-dimensional flow phenomena in suction chamber and in a part of mixing tube where the mixing phenomena occur.Ejector W a t e r
Inlet
Air Suction Vent
Vessel Tank
Make up water
Pump
Fig. 2 Schematic diagram of mixing loop reactor
In this study, a CFD package (STAR CD) was used to analyse a small water ejector which was equipped in an experimental mixing loop reactor.
The ejector is modeled in three-dimensional geometry in order to get better agreement between simulation results and the real condition.
The effects of operating conditions and geometries on its hydrodynamics and mass transfer characteristics were investigated and validated with actual values obtained from experiment.
2. Experimental Description
A schematic diagram of mixing loop reactor system with ejector used is shown in Fig. 2 The mixing loop reactor consists of ejector, vessel tank, make-up water tank and centrifugal pump.
The inlet pressure was measured at point 1, before the primary fluid entering the ejector.
Suction pressure was measured at the entrance of secondary fluid (2), and outlet pressure data was taken at the outflow of vessel tank.
The ejector configuration used in the present study had a mixing tube diameter (D) of 22 mm and diffuser outlet diameter of 40 mm and a draft tube length (L) of 100 mm. The nozzle diameter used was 8.5 mm.
3. Computational Fluid Dynamics Modeling
In this research, 5 different model of ejector was build to investigate the influence of mixing tube length on the mass transfer characteristics.
The ejector configuration used in the present study had a mixing tube diameter (D) of 22 mm and diffuser outlet diameter of 40 mm (i.e.
diffuser angle of 3.5) and a draft tube length (L) of 100 mm. The mixing tube lengths were varied as 88, 120, 150, 176 and 220 mm. The nozzle diameter used was 8.5 mm. The ejector geometry was modeled in a commercial CAD software package and mesh was generated in Pro-Star Auto Mesh as describe in Fig. 3 with about 400,000 cells.
Fig. 3 The ejector model with trim cell mesh generation (inset: real ejector)
As the working fluids used in this research were water as motive fluid and air as secondary fluid, the assumption of incompressible flow was seems to be appropriate. Hence, the standard k-ε with high Reynolds number was selected to govern the turbulence characteristics. The near wall treatment was left as the standard wall function, which gave reasonably accurate results for the wall bounded with very high Reynolds number flow. The thermo physical properties of the working fluids were obtained at 293 K and 300 K respectively for water and air. The turbulence intensity was set to be 3.5% in motive fluid. The velocity applied at the inlet boundary was based on the experimental measured
volumetric flow rate which was 4 m
3
/h of water.The velocity of air was based on the Q
G
/QL
ratio in the range of 0.2 to 1.2.Based on their experimental results, Dirix and van de Wiele
8)
recommend empirical correlations for mass transfer coefficient on the liquid side for a down flow ejector as66 . 0 66
. 0 3 ( ) 10 4 .
5 ⎟⎟ ⎠
⎜⎜ ⎞
⎝
∈ ⎛
×
= −
D G N
L d
a d
k ε
(1)
4. Results and Discussions
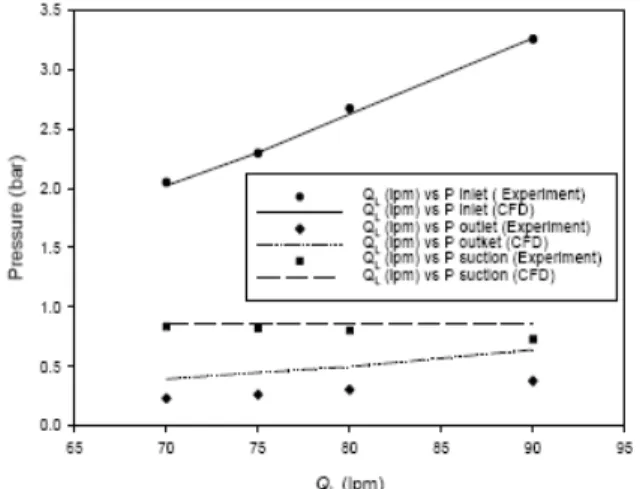
Fig. 4 shows the effect of liquid flow rates on the inlet pressure, outlet pressure and suction pressure of the ejector. The circle dot mark represents the experiment data, while the solid line is obtained from CFD simulation. It can be seen that there is a good agreement between experiment and CFD data. Thus, the hydrodynamic parameter of CFD data is validated with respect to experiment data.
Fig. 4 The influence of liquid flow rate on inlet pressure, outlet pressure and suction pressure of ejector
Fig. 5 shows the influence of Reynolds number at nozzle on the mass transfer number in the ejector. This graph is used to validate the CFD data in the manner of mass transfer characteristic. The experimental data is obtained from Dirix and Van de Wiele
8)
. The resultsobtained from CFD have a good agreement with that of experiment. All of those validation data, hydrodynamic and mass transfer, indicate that the codes of simulation that have been used in this CFD studies are valid.
Fig. 5 Influence of Reynolds number on mass transfer in the ejector
Fig. 6 shows the predicted pressure distribution at the centerline of the ejector with 0.12 m of mixing tube length and 3.5° for various Q
G
/QL
, with the axial locations from the tip of nozzle to the outlet of draft tube. On the top of Fig. 6, mixing tube, diffuser and draft tube of ejector are also drawn. This graph indicates that the gas-liquid flow rate ratio influencing the jet break-up and the position of the mixing shock zone in the mixing tube. The mixing zone location shifts from the mixing tube entrance at lower QG
/QL
towards the ejector outlet at higher QG
/QL
.Fig. 7 shows the predictive distribution of energy dissipation rate for various Q
G
/QL
at the axial locations from the tip of nozzle towards the end of mixing tube. It can be seen that the maximum energy dissipation rate is achieved at QG
/QL
=0.2. The average of dissipation rate along the mixing tube decreases by the increase of QG
/QL
. The interesting phenomenon is that the location where the maximum energy dissipation rate occurs is shifted towards to the exit of mixing tube with respect to gas-liquid flow rates ratio.According to Witte
5)
, this phenomenon is related with the location of mixing shock where the jet break-up occurs. The jet breaks up when a part of kinetic energy of the flow is dissipated in the shock creating the gas-liquid dispersion.By increasing the gas flow rates, the coaxial annular gas flow around a core of the primary fluid jet is lengthen in the mixing tube causing the shifted location of mixing shock area. This phenomenon is clearly illustrated in Fig. 8.
Axial distanace along ejector (m)
0. 0 0.1 0.2 0.3
4.0e+4 6.0e+4 8.0e+4 1.0e+5 1.2e+5 1.4e+5 1.6e+5
QG/QL 0.2 QG/QL 0.4 QG/QL 0.6 QG/QL 0.8 QG/QL 1.0 QG/QL 1.2
Fig. 6 Pressure distribution along the ejector for various Q
G
/QL
Fig. 7 Distribution of energy dissipation rate inside mixing tube for various Q
G
/QL
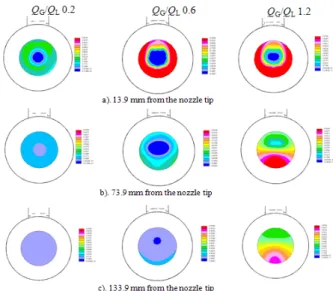
Fig. 8 shows the contour of air fraction as a secondary fluid in the water at various axial locations for Q
G
/QL
equal to 0.2, 0.6 and 1.2respectively. The axial locations are at 13.9, 73.9 and 133.9 mm downstream of the nozzle tip.
Fig. 8 Mixing phenomena in cross sectional view inside the mixing tube
At the entrance of mixing tube, the dispersion of gas phase into liquid phase is almost complete at Q
G
/QL
= 0.2, while at QG
/QL
= 0.6 and QG
/QL
= 1.2 the gas phase build the coaxial annular gas flow around the core of primary fluid jet.However, the dispersion of a small part of gas takes place at the top side of the mixing tube.
When the cross sectional area of observation is shifted downstream at 73.9 mm from the nozzle tip, or in the middle of the mixing tube, the two phases are completely mixed and become homogeneous flow at Q
G
/QL
= 0.2. Meanwhile at QG
/QL
= 0.6 the mixing phenomenon is almost complete, at QG
/QL
= 1.2 the gas stream at the bottom of the illustration figure of mixing tube decrease to smaller part and the mixing is still growing up on process. Finally, at the exit of mixing tube, the flow become completely homogeneous for QG
/QL
= 0.2 as mentioned previously and also for QG
/QL
= 0.6. In contrast with the results from those gas-liquid flow rates ratios, at QG
/QL
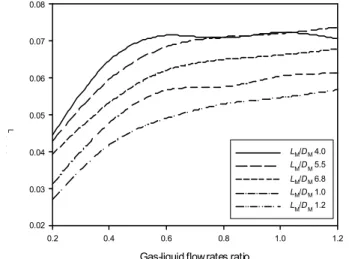
= 1.2, the flow pattern describes that the mixing is still in progress and homogeneous flow is not yet obtained.Fig. 9 clearly illustrates that the ejector with
longer mixing tube ratio creates lower volumetric mass transfer coefficients compared to the ejector with a shorter mixing tube. It is seen that by the increase of L
M
/DM
ratio, the volumetric mass transfer coefficient decreases in any gas-liquid flow rates ratio value. However, it can be seen that for the ejector with LM
/DM
ratio of 4, at the gas-liquid flow rates ratio from 0.2 to 0.6 the volumetric mass transfer coefficient value is higher than that of any other LM
/DM
ratio. By increasing the QG
/QL
ratio more than 0.6, the kL
a value then decreases. This phenomenon could be occur since at the ejector with shorter mixing tube length, the increased in gas flow rate cause the jet flow occur longer in the mixing tube length and the mixing shock is shift towards the exit of ejector. In this case, the mixing shock occurs at the diffuser, causing ineffective mixing phenomena of both phases.Gas-liquid flow rates ratio
0.2 0.4 0.6 0.8 1.0 1.2
k
L(1/ )
0.02 0.03 0.04 0.05 0.06 0.07 0.08
LM/DM 4.0 LM/DM 5.5 LM/DM 6.8 LM/DM 1.0 LM/DM 1.2
Fig. 9 Influence of mixing tube length on the volumetric mass transfer coefficient
5. Conclusions
From this study, it can be concluded that the gas-liquid flow rates ratio has a significant effect on the hydrodynamics and mass transfer characteristics of ejector. In this research, the volumetric mass transfer coefficient increases with respect to the gas flow rates on the ejector with the minimum length of mixing tube of 120 mm (L
M
/DM
5.5). At the ejector with mixing tubelength of 88 mm (L
M
/DM
4), the volumetric mass transfer coefficient reach maximum at gas-liquid flow rates ratio of 0.6. Further increase of gas-liquid flow rates ratio resulted in the volumetric mass transfer coefficient reduction.From the present investigation, it also can be concluded that the mixing tube length influences the volumetric mass transfer coefficient of ejector.
The volumetric mass transfer coefficient decreases proportional to the increase of mixing tube length.
In overall, from this investigation, it may be concluded that CFD method is an efficient tool to predict the hydrodynamics and mass transfer characteristics of ejector. CFD analysis can give a good complement to the experimental approach.
Acknowledment
This research was financially supported by the Ministry of Commerce Industri and Energy (MOCIE), Korea Industrial Technology Foundation (KOTEF) through the Human Resource Training Project for Regional Innovation and the 2nd-phase of BK21 project of Korea.
References
1. H.H. Daucher, 1982, "Oxygen transfer and circulation rate in activated sludge channels aerated by jets", Ger. Chem. Engng, Vol. 5, pp. 255~261.
2. P.H.M.R. Cramers, A.A.C.M. Beeneckers and L.L. van Direndonck, 1992, "Hydrodynamics and Mass Transfer Characteristics of Loop-Venturi Reactor with a Downflow liquid Jet Ejector", Chem. Engng Sci. Vol. 47, pp.
3557~3564.
3. H.D. Kim and B.G. Choi, 2002, "An experimental study of sonic/supersonic ejector flow", Trans. of KSME, Vol. 26. No. 5, pp.
640~647.
4. H.M. Jeong, H.S. Chung, K.Y. Bae, S.H. Kim and Y.S. Shin, 2005, "Water cooling characteristics in an enclosed vacuum tank by
water driven ejector", Journal of Mechanical Science and Technology, Vol. 19, No. 1, pp.
164~172.
5. J.H. Witte, 1996, "Mixing shocks in two phase flow", J. Fluid Mech., Vol. 36, pp. 639~655.
6. R.G. Cunningham and R.J. Dopkin, 1974, "Jet Breakup and Mixing Throat Lengths for the Liquid Jet Gas Pump", Trans. ASME - J.
Fluids Engng Vol. 96, pp. 216~226.
7. M.N. Biswas and A.K. Mitra, 1981,
"Momentum transfer in horizontal multi-jet liquid-gas ejector", Canadian Journal of Chemical Engineering, Vol. 59, pp. 634~637.
8. C.A.M.C. Dirix and K. van der Wiele, 1990,
"Mass Transfer in Jet Loop Reactor", Chem.
Engng Sci., Vol. 45, pp. 2333~2340.
9. P. Havelka, V. Linek, J. Sinkule, J. Zahradnik and M. Fialova, 1997, "Effect of the ejector configuration on the gas suction rate and gas hold-up in ejector loop reactors", Chem.
Engng Sci., Vol. 52, pp. 1701~171.
10. P.H.M.R. Cramers, L.L. van Direndonck and A.A.C.M. Beeneckers, 1992, "Influence of the gas density on the gas entrainment rate and gas hold-up in loop-venture reactors", Chem.
Engng Sci. Vol. 47, pp. 2251~2256.
11. P.H.M.R. Cramers, A.A.C.M. Beeneckers and L.L. van Direndonck, 1992, "Hydrodynamics and Mass Transfer Characteristics of Loop-Venturi Reactor with a Downflow liquid Jet Ejector", Chem. Engng Sci. Vol. 47, pp.
3557~3564.
12. P.H.M.R. Cramers and A.A.C.M. Beeneckers, 2001, "Influence of the ejector configuration, scale and the gas density on the mass transfer characteristics of gas-liquid ejectors", Chem. Engng Sci. Vol. 82, pp. 131~141.
13. S.B. Riffat and S.A. Omer, 2001, "CFD modeling and experimental investigation of an ejector refrigeration system using methanol as the working fluid", International Journal of Energy Reservation, Vol. 25, pp. 115~128.
14. E. Rusly, A. Lu, W.W.S. Charters, A. Ooi and K. Pianthong, 2005, "CFD analysis of ejector
in a combined ejector cooling system", International Journal of Refrigeration, Vol. 28, pp. 1092~1101.
15. T. Sriveerakul, S. Aphornratana and K.
Chunnanond, 2006, "Performance prediction of steam ejector using computational fluid dynamics: Part 1. Validation of the CFD results", International Journal of Thermal Sciences, The SCI. 2553, Article in press.