JESK
http://jesk.or.kr eISSN:2093-8462Standards Sizing for Clothing based on Anthropometry Data
Young-Suk Lee
Department of Clothing Science, Chonnam National University, Gwangju, 500-757
Corresponding Author Young-Suk Lee
Department of Clothing Science, Chonnam National University, Gwangju, 500-757
Mobile : +82-10-2894-1597 Email : jaabo1994@naver.com
Received : August 06, 2014 Revised : September 19, 2014 Accepted : October 13, 2014
Objective:The purpose of this study was to examine the various sizing systems and specified anthropometric data as well as the fit issues used today.
Background: A standard sizing system for clothes is a system that is developed based on body shape and size classifications method. To develop an efficient sizing system, we have to classify the database from the majority of the samples.
Method: The method of this paper deals with the secular trend of height spanning from 1997 to 2010 along with the morphological feature patterns for Koreans. It also investigates the comparison of the growth pattern between male and female and the body shape classification according to the drop values based on the anthropometric data samples of KATS taken from the 2010 surveys in order to develop and define the new guidelines for the size designation systems of clothes.
Results: The results are classified with body size and shape categories according to the drop values by age and sex in order to develop the new guidelines for the size designation systems based on these body dimensions from the analyzed anthropometric database.
Conclusion: These new guidelines for the size designation system will eliminate the confusion that currently exists among countries and individual apparel designers.
Application: The adopted standards could be used to compare the sizing systems worldwide.
Keywords: Standard, Anthropometry, Drop values, Clothing, Morphology, Sizing system, Growth
Copyright@2014 by Ergonomics Society of Korea. All right reserved.
○cc This is an open-access article distributed under the terms of the Creative Commons Attribution Non-Commercial License (http://
creativecommons.org/licenses/by-nc/3.0/), which permits unrestricted non-commercial use, distribution, and reproduction in any medium, provided the original work is properly cited.
1. Introduction
There are great variations in the anthropometric measurements and body proportions of the world populations. Increasing international economic independence, however, makes it necessary to go beyond national frontiers and to establish international anthropometric standards for consumer goods and the design of workplace (Jurgens, 1990).
As a means to further improved quality and production efficiency, standardization plays with the improved systems in business and its simplification. However, with simplicity and harmonization, standardization now means better human relations between and inside manufacturing and commercial units. In fact, everyone benefits
from it on all levels, from the producing units to the accounting sections and then the marketing ones, the national and international carriers, the delivery man and finally the consumer (McMahon, 1973).
Thus, in Korea, the first national anthropometry survey was conducted in 1979 by a Korean Government division, the Korean Agency for Technology and Standard (KATS report, 1979). At the time, data were collected on 17,000 sample individuals residing in various parts of the country, aged between six and fifty. A total number of 117 measurement dimensions were taken using calipers and tape measures. Thanks to these data, the KATS established 46 items defining the Korean standard concerning clothing, furniture, desks and chairs. Forty-one of them (KSK 0035 to KSK 0096) were associated with the size designations of men's wear, women's wear, brassieres, socks, etc. Following this survey, the Korean government has been presenting a national anthropometric survey every 5 or 6 years. The surveys of 1986, 1992, 1997, 2003 and 2010 were performed according to the following sequence: the surveys were performed with the traditional measurement method (2D) using an anthropometer, somatometer, caliper and tape measure. The 3-D body scan data collection (Body Line Scanner, Hamamatsu Co.) method (3D) was also adopted for the 2003 and 2010 surveys. All body dimensions were measured with the method defined by the ISO (ISO 8559, 1989; ISO 7250, 1997).
The purpose of this study was to compare the various sizing systems and specified anthropometric data as well as the fit issues used today. The method of this paper deals with the secular trend of height spanning from 1997 to 2010 along with the morphological feature patterns for Koreans. It also investigates the comparison of the growth pattern between male and female and the body shape classification according to the drop values based on the anthropometric data samples of KATS taken from the 2000 and 2010 surveys in order to develop and define the new guidelines for the size designation systems of clothes.
2. Methods 2.1 Samples
The anthropometric data set of the Korea surveys measured during 1997-2010 (KATS, 1997-2010 data set) were analyzed in this paper in order to obtain the information on Koreans' physical features and the KS size standard table for clothes.
2.2 Measures
The 1D Dimension were measured using the anthropometer, calipers and tape measure and 3D shape measurement were measured using cyberware and Hamamatsu 3D body scanner. All measurement methods were performed according to the definitions of ISO 8559 and 7250.
2.3 Procedures
The anthropometric data included Height, 3 girth dimensions (bust/chest girth, waist girth and hip girth) were analyzed to obtain the size chart development, also the five breadth dimensions (inter-bust point breadth, chest breadth, waist breadth, hip breadth and acromion to acromion breadth), four depth dimensions (chest depth, waist depth, abdominal depth and hip depth), four height dimensions (waist height, crotch height, hip height and knee height) and cervicale to wrist length which were analyzed to indicate body shape and body proportion.
Data on size and annual growth changes of measurements of subjects aged from 6 to 20 years were used to clarify the tendency of maturation in body size.
Drop values between the three key dimensions and the distributions between key dimensions were analyzed to define the size categories for the size designation systems.
3D modeling data, body silhouette data of the mid-sagittal plane, front median line, form front and form side views measured by the sliding gauge, and data plotting from the height and breadth measurements, were used as elements for body shape and proportion comparison.
The 3D standard body shape of men and women in their twenties obtained from the 2010 KATS photos (KATS report, 2010) and the 1999 Lee data (LEE, 1999) are presented to define Korean's morphological standard features.
KS sizing of clothes and the sizing variations among country standards were compared to establish the new guidelines for the size designation systems.
3. Results
3.1 Size and shape
3.1.1 Size changes and growth rate in key dimensions
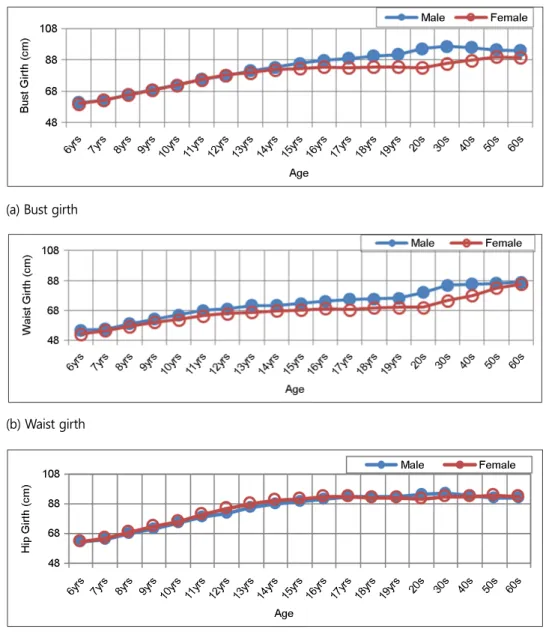
The size changes of height, bust girth, waist girth and hip girth measurements, which present the body development features and annual growth patterns of measurements in Koreans aged 6-20, are shown in Figure 1 and Figures 2 (a), (b), (c).
At age 6, the values of height, bust girth, waist girth and hip girth are 118.9cm, 60.2cm, 52.4cm and 62.4cm. The growth rates of these dimensions are respectively 74.3%, 72.0%, 74.9% and 67.6% of the adult size. Each year, height increases by 4-6cm between the ages of 6 and 12 years, and 2-4cm per year in other girth dimensions (bust and hip) for subjects aged from 12 to 15 years.
On average, maturity of growth in height is reached at the age of 17-18 years for males and 15-16 years for females. For girls at age 10, the values of height, bust girth, waist girth and hip girth are 140.7cm, 72.0cm, 62.0cm and 76.2cm, respectively (Figures 1, 2).
For boys at age 10, the values of height, chest girth, waist girth and hip girth are, 141.4cm, 72.0cm, 64.9cm and 75.2cm, respectively (Figures 1, 2). Each year, height increases by 4-6cm between the ages of 6 and 12 years in both sexes. Then, height
Figure 1. Size and Growth pattern of Height in Korean male and female groups from the 2010 data set
increases 2-3cm per year in the girls group and 4-5cm in the boys group aged from 12 to 15 years.
3.1.2 Growth comparison between sexes
The data on chest/bust, waist and hip girth of male and female from the 2010 samples were compared according to age in both sexes (see Figure 2).
As shown in Figure 2(a), the mean bust girth value of 18-years-old women is 83.6cm and the mean chest value of the 18 years- old men is 90.6cm with showing the differences of 7cm. Around the age of 14, the gaps between sexes start to appear in bust/chest girth.
(c) Hip girth
Figure 2. Growth pattern of girth dimensions in Korean male and female groups (a) Bust girth
(b) Waist girth
Waist girth of males from the 2010 data has been found to be 54.7cm at the age of 6, and was found in female with size 52.4cm.
Starting from the age of 8, differences between male and female already start to show in waist shape and size (Figure 2-b).
Hip girth of males and females from the 2010 data has been found to be 62.5cm and 62.4cm at the age of 6 respectively, and show almost the same size values over the whole age period with the same growing tendency (Figure 2-c).
3.2 Body proportion 3.2.1 Height dimensions
Figures 3(a) and (b) show the size changes of height dimension in knee height, waist height, hip height and iliac spine height based on the 2010 Korean male and female data set. The proportions of knee height, waist height, hip height and iliac spine height of female group in their twenties from the 2010 data are 0.26, 0.61, 0.38, 0.49 and 0.54 times to the height, respectively.
These values can be used to make pattern grading, work space and accessories design in order to predict the body length of each part (A. Gleiss et al., 2013).
Body proportion is critical for manufacture body fitting clothes. The proportion ratio index of body height dimension corresponding to height should be taken into consideration when designing good product construction systems. Five body dimensions, namely, total body height, waist height, hip height, crotch height and knee height, are considered to be very important parameters for well-fitted balanced design and functionality.
(a) Data of males (b) Data of females Figure 3. Height measurements of Koreans from the 2010 data
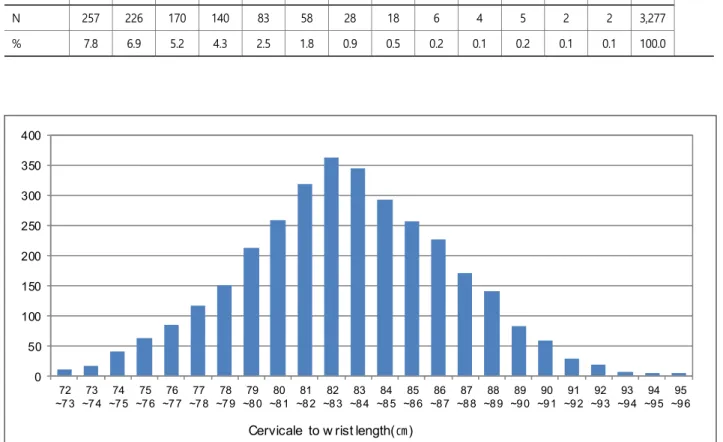
3.2.2 Cervicale to wrist length
The size of cervicale to wrist length is a key factor in designing the formal shirts for men.
Table 1 and Figure 4 suggest the distribution range of cervicale to wrist length size in men. Cervicale to wrist length values are concentrated in the range from 80 to 85cm, which approximately represent a 40% cover rate of men.
Table 1. Distribution range of the cervicale to wrist length size in men Cervicale to
wrist length
(cm) 70~71 71~72 72~73 73~74 74~75 75~76 76~77 77~78 78~79 79~80 80~81 81~82 82~83 83~84 84~85
N 2 3 10 17 41 63 85 117 151 213 259 319 362 344 292
% 0.1 0.1 0.3 0.5 1.3 1.9 2.6 3.6 4.6 6.5 7.9 9.7 11.0 10.5 8.9
Cervicale to wrist length
(cm) 85~86 86~87 87~88 88~89 89~90 90~91 91~92 92~93 93~94 94~95 95~96 96~97 ≥97 Total
N 257 226 170 140 83 58 28 18 6 4 5 2 2 3,277
% 7.8 6.9 5.2 4.3 2.5 1.8 0.9 0.5 0.2 0.1 0.2 0.1 0.1 100.0
Figure 4. Distribution of the cervicale to wrist length size in men 0
50 100 150 200 250 300 350 400
72
~73 73
~7 4 74
~75 75
~76 76
~7 7 77
~7 8 78
~79 79
~80 80
~8 1 81
~82 82
~83 83
~84 84
~8 5 85
~86 86
~87 87
~8 8 88
~8 9 89
~90 90
~91 91
~9 2 92
~93 93
~94 94
~95 95
~9 6
Cervicale to w rist length(㎝)
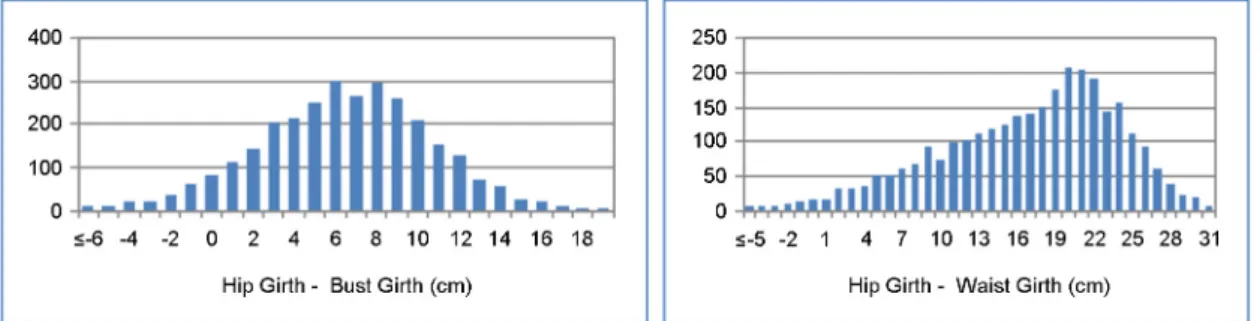
3.3 The distribution of drop values in Koreans 3.3.1 Drop value distribution in Koreans
Figure 5 suggests the drop value between bust girth and hip girth, hip and waist girth based on the data of female body dimension taken in 2010 (N=2,978). As shown in Figure 5(a), the drop values between bust and hip are concentrated in the range from 6 to 9cm, which approximately represent a 40% cover rate of females.
The drop values between hip and waist are concentrated in the range from 19 to 22cm, which approximately represent a 40%
cover rate of females (Figure 5-b). Data are divided into three zones corresponding to different body types of Korean women.
The three body shapes range in descriptive titles from N (regular), H (slim hips) and A (broad hips), as follows: Type N, whose drop value ranges from 6cm to 10cm, can be defined as the standard type for Korean women. Women who have a drop value between 10cm and 16cm belong to type A. This type indicates that a woman has a well-developed hip compared to that of Type H (drop value of -1cm ~ 6cm reflects a woman with a well-developed bust and slim hips).
Figures 6(a) and (b) suggest the drop value between chest girth and waist girth, chest girth and hip girth based on the 2010 data set of men from 19 to 60 years. The drop values are concentrated in the range from 10 to 18cm, which approximately represent a 50% cover rate of men.
(a) Drop values between hip and bust in women (b) Drop values between hip and waist in women Figure 5. Drop values between Key dimensions in Korean women
(a) Drop values between chest and waist in men (b) Drop values between chest and hip in men Figure 6. Distribution of drop values between Key dimensions in Korean men
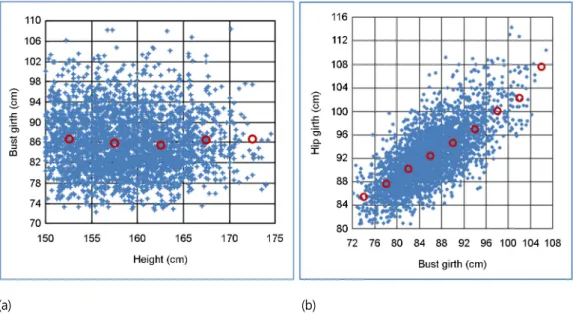
3.3.2 Size plotting between key dimensions
To develop the size range for women's and men's clothing, the size distribution between bust /chest and height and the distribution between bust and hip girth in women, between chest and waist girth in men are analyzed, as shown in Figures 7(a) and (b) and Figures 8(a) and (b).
The size range in the height of women are distributed from 150cm to 175cm, with an 85% cover rate. The size range of bust and hip girth in women are distributed from 76cm to 98cm and, 84-104cm, respectively, with an 85% cover rate. The size range of height, chest and waist in men are distributed from 84-108cm and 64-100cm, respectively, with an 85% cover rate.
(a) (b)
Figure 7. Distribution of the size between bust and height, bust and hip in groups of Korean women
(a) (b)
Figure 8. Distribution of the size between chest and height, chest and waist in groups of Korean men
3.4 3D body modeling in Koreans
Figure 9 shows an example of body shape modeling of Korean women in their twenties using body size data plotting and the form from front and side view using the sliding gauge. This sort of figure realizes a comparison of existing shapes with the desired virtual ones (i.e., a well-proportioned body figure in which height corresponds 8 times to the height of the head) considered as a harmonious body shape by a given or targeted population.
3.5 Size designation systems in Korean standards 3.5.1 Size designation in men's wear
The size range of the three key dimensions and intervals are determined as follows:
Body type Drop value (cm)
Short Regular Tall
Y type (Drop 20) 18 20 22
A type (Drop 16) 14 16 18
B type (Drop 10) 6 10 12
BB type (Drop 2~6) 2 4 6
Height type Height range (cm)
Short 163 (155~165)
Regular 173 (165~175)
Tall 180 (175~185)
Figure 9. 3D modeling from data plotting and the index from front and side view
Figure 9. 3D modeling from data plotting and the index from front and side view
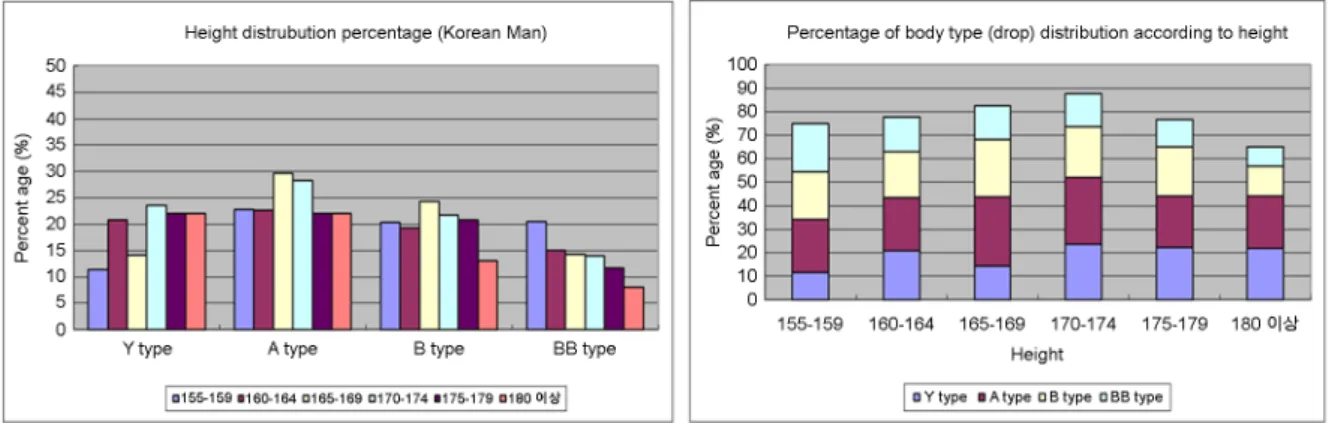
The height distribution and the cover rate according to body shape are shown in Figures 10-a, b.
For men's wear, chest dimension ranges from 73cm to 106 cm, hip dimension from 78cm to 112cm and waist girth from 68cm to 106cm. Chest and hip measurements are established at intervals of 3cm and waist dimension at intervals of 2cm. Height dimension, which ranges from 155cm to 185cm, is divided into three groups, referred to as "short", "regular" and "tall", with an interval of 10cm.
In the case of upper body garments of men in their twenties, the letter code size ranges corresponding to S, M, L and LL are as shown in Figure 11.
3.5.2 Size designation systems in women's wear
In KS K 0051 (2009), bust and hip measurements are established at intervals of 3cm and of 5cm for height dimensions ranging Height
(cm) 185
M-T L-T
175
S-R M-R L-R
165
S-P M-P
155
80 90 100 110
Chest (cm)
(a) Height distribution by body type (b) Percentage of body type according to height in men Figure 10. The cover rates according to body type and height type in Korean men
Figure 11. Size range of the letter code in men's wear
from 145cm to 175cm. Body type is classified into 3 groups, according to the drop value between bust girth and hip girth.
Type N, whose drop value is 6-9cm, can be defined as the standard (regular) Korean women body type.
Type N whose drop value is 6cm, falling under the size range 4-10cm, can be defined as the regular Korean women body type.
Women, whose drop value of 12cm ranges between 10cm and 16 cm, belong to type A as follows.
Letter codes S.M.L. XL representing the size ranges of bust girth and height, in each size code, are shown in Figure 12.
3.6 Standard body type of Koreans in twenties
3.6.1 Standard body type of Korean from the data 2010
According to the 2010 data, the average, height, chest, waist and hip girth of men were 173.3cm, 93.0cm, 77.4cm and 94.3cm, respectively (see Figure 13-a). As for the data of women, the average height, bust, waist and hip girth from the 2010 data were 160.4cm, 83.0cm, 69.3cm and 92.8cm, respectively (see Figure 13-b).
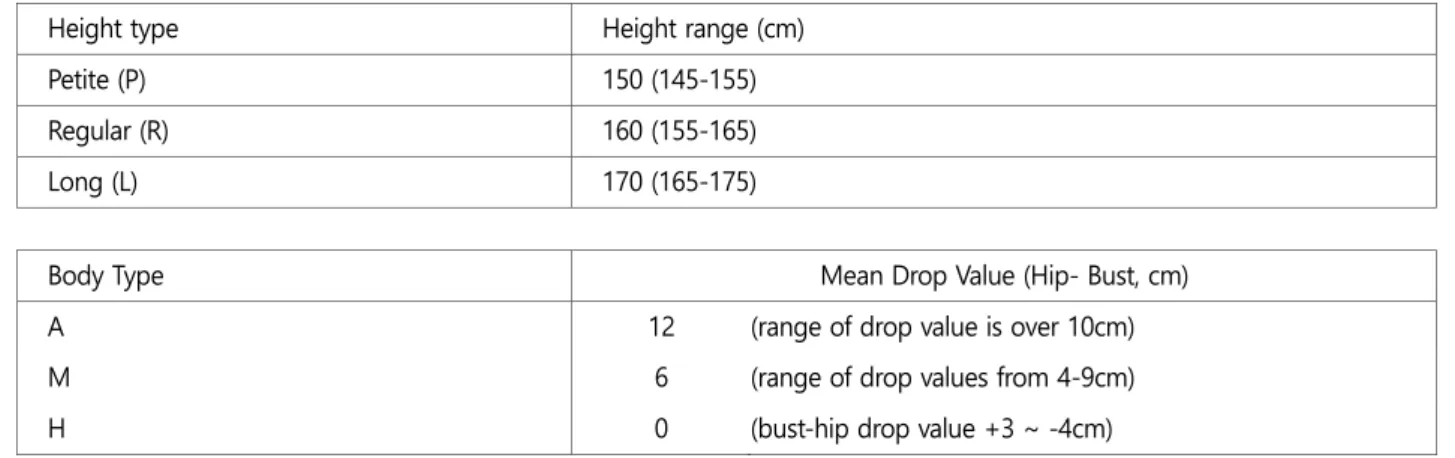
The average stature of male from the 2010 data has been found to be 173.3cm with a 95 percentile of 185.9cm for young men
Height type Height range (cm)
Petite (P) 150 (145-155)
Regular (R) 160 (155-165)
Long (L) 170 (165-175)
Body Type Mean Drop Value (Hip- Bust, cm)
A 12 (range of drop value is over 10cm)
M 6 (range of drop values from 4-9cm)
H 0 (bust-hip drop value +3 ~ -4cm)
Height (cm)
175
ST MT LT LLT
165
S M L LL
155
SP MP LP LLP
145
74 80 82 88 90 96 98 104
Bust (cm)
Figure 12. Size designation systems of letter code in women's' wear
in their twenties. In comparison with the 1997 data, which showed an average stature of 171.8cm, there has been a 2cm increase.
The means of height, chest/bust, waist and hip girth are 173cm, 93cm, 77.4cm and 94cm, respectively, in 19-year-old men, and respectively 160cm, 84cm, 69.3cm and 93cm in 19-year-old women. These sizes can be regarded as the standard young adult female and male body shape in Korea, as shown below in Figure 14 (Photos from "Size Korea 2010").
3.6.2 Standard of Koreans from the data 1997
As for the data of women subjects in their twenties, the average height, bust, waist and hip girth from 1997 data were 159.8cm, 82.0cm, 65.8cm and 89.2cm, respectively. In 1997, the results for men in their twenties regarding the means of height, chest, waist and hip are 171.6cm, 89.6cm, 76.4cm and 92.6cm, respectively as shown in Figures 15(a), (b). The average stature of male from the 2010 data has been found to be 173.3cm with a 95 percentile of 185.9cm for young men in their twenties. In comparison with the 1997 data, which showed an average stature of 171.6cm, there has been a 2cm increase.
These sizes can be regarded as the standard young adult body shape in Korea, as indicated in Figure 16 (Photos from Lee data 1997).
93 - 77 - 173
Height 173cm
Waist 77cm
Chest 93cm
84 - 93 - 160
Height 160cm
Hip 93cm
Bust 84cm
(a) Men's wear (b) Women's wear Figure 13. Regular size of KS
Women (Height 160, B-W-H: 84-70-93) Men (Height 173, C-W-H: 93-77-94) Figure 14. Standard body shape of Korean women and men from 2010 data
3.7 Compatibility of the sizing system
3.7.1 Different sizing labeling with same bust measurement
ISO standards include the ISO/TC 133 norm pertaining to clothing that is applied in most European countries. As member states, European countries respect the ISO standards when establishing their clothing size standards and size labeling system. However, despite ISO's efforts, countries could not neglect consumer's preference for national clothing sizing system with which they are familiar with, and thus, they still continue to use the former national sizing system. Therefore, clothing based on the same physical features follows different sizing systems. Even when following the same sizing system, in practice, the corresponding measurements are different and thus bring confusion to consumers who pursue imported products or products from abroad.
For instance, a 92cm bust girth clothing is labeled differently in different countries, as shown below:
92 - 79 - 170
Height, 172cm
Waist, 76cm
Chest, 90cm
82 - 90 - 160
Height, 160cm
Hip, 90cm
Bust, 82cm
Japan France
15 40
UK Italy
14 44
Women (Height 160, B-W-H: 82-66-90) Men (Height 172, C-W-H: 90-76-93) Figure 16. Standard body shape of Koreans from 1997 data
(a) Men's wear (b) Women's wear Figure 15. Regular size of KS
3.7.2 Sizing standards of garments according to countries
Garment sizes can be by large divided into three, the European, American and the Asian systems, each having its own characteristics.
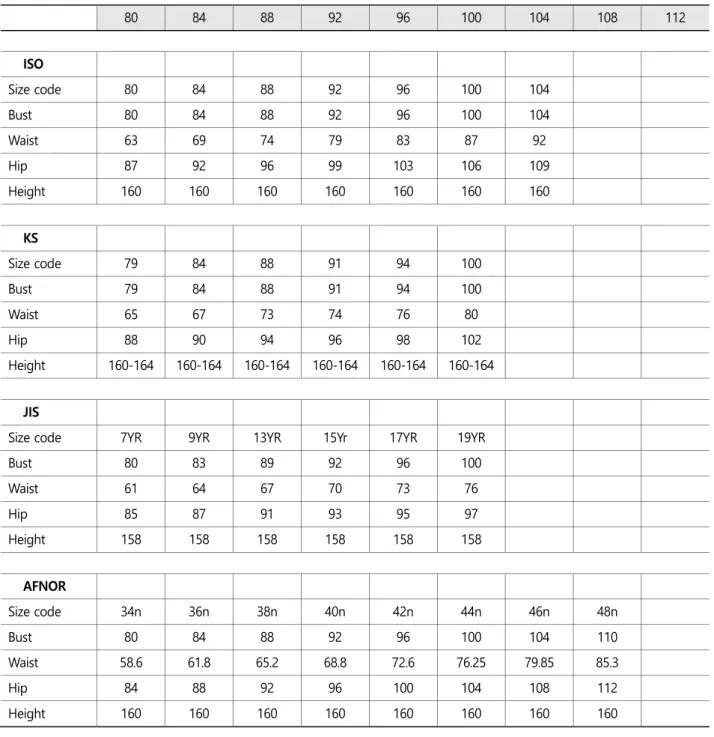
In Table 2, we have reviewed the Korean, Japanese, French, Italian, German and American sizing norms distinguishing female sizes.
We also look at their conformity to the ISO standards and the conformity between themselves (ISO 3637: JIS L 4005: AFNOR: DIN:
KS K 0059: ASTM D 5586: UNI).
Table 2. Size chart of each size code by standards ISO, KS, JIS, AFNOR, Italy, DIN and ASTM
80 84 88 92 96 100 104 108 112
ISO
Size code 80 84 88 92 96 100 104
Bust 80 84 88 92 96 100 104
Waist 63 69 74 79 83 87 92
Hip 87 92 96 99 103 106 109
Height 160 160 160 160 160 160 160
KS
Size code 79 84 88 91 94 100
Bust 79 84 88 91 94 100
Waist 65 67 73 74 76 80
Hip 88 90 94 96 98 102
Height 160-164 160-164 160-164 160-164 160-164 160-164
JIS
Size code 7YR 9YR 13YR 15Yr 17YR 19YR
Bust 80 83 89 92 96 100
Waist 61 64 67 70 73 76
Hip 85 87 91 93 95 97
Height 158 158 158 158 158 158
AFNOR
Size code 34n 36n 38n 40n 42n 44n 46n 48n
Bust 80 84 88 92 96 100 104 110
Waist 58.6 61.8 65.2 68.8 72.6 76.25 79.85 85.3
Hip 84 88 92 96 100 104 108 112
Height 160 160 160 160 160 160 160 160
4. Discussion
As the basis for the new sizing standards, anthropometric data collection, including three-dimensional information, together with the comparison of these data among countries are becoming necessary tools for the entire manufacturing community (Gupta, 2004).
In Korea, like many other countries, the mean height has been increasing in last several decades. In such countries anthropometric data will be outdated sooner or later. The information on the speed of the secular change in height in last several decades is useful to judge if the database is still representing the intended target population or to judge how long the latest database will serve as the reference data (Ashizawa K, 2002; Kouchi and Mochimaru 2005).
The comparison of the growth in both sexes are plotted in Figure 1 and Figure 2. In women, height increases from birth to maturity 3.2 times (for comparison it is 3.5 times for men) mainly due to rapid growth in leg length. The lines are very similar for both survey data. On average, maturity of growth in height is reached at the age of 17-18 years for males and 15-16 years for females.
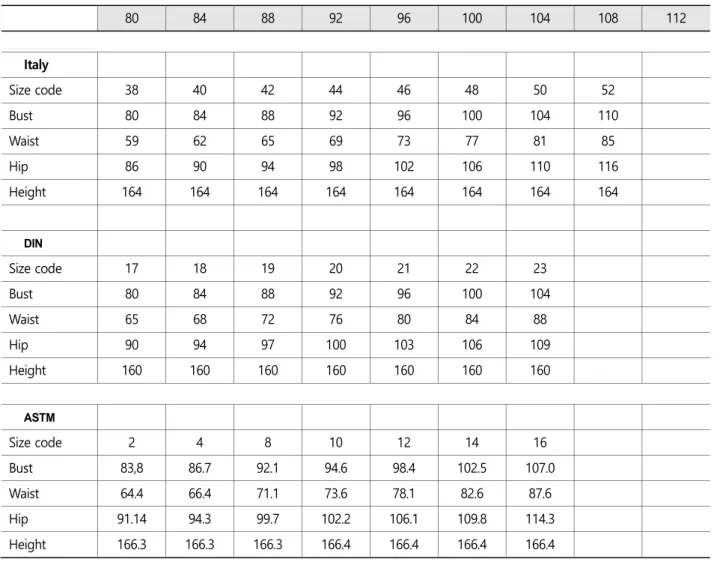
Table 2. Size chart of each size code by standards ISO, KS, JIS, AFNOR, Italy, DIN and ASTM (Continued)
80 84 88 92 96 100 104 108 112
Italy
Size code 38 40 42 44 46 48 50 52
Bust 80 84 88 92 96 100 104 110
Waist 59 62 65 69 73 77 81 85
Hip 86 90 94 98 102 106 110 116
Height 164 164 164 164 164 164 164 164
DIN
Size code 17 18 19 20 21 22 23
Bust 80 84 88 92 96 100 104
Waist 65 68 72 76 80 84 88
Hip 90 94 97 100 103 106 109
Height 160 160 160 160 160 160 160
ASTM
Size code 2 4 8 10 12 14 16
Bust 83,8 86.7 92.1 94.6 98.4 102.5 107.0
Waist 64.4 66.4 71.1 73.6 78.1 82.6 87.6
Hip 91.14 94.3 99.7 102.2 106.1 109.8 114.3
Height 166.3 166.3 166.3 166.4 166.4 166.4 166.4
The average stature of males from the 2010 data has been found to be 173.3cm with a 95 percentile of 185.9cm for young men in their twenties. In comparison with the 1997 data, which showed an average stature of 171.8 cm, there was a 2cm increase.
As can be seen in Figures 1 and 2, the means of height, bust, waist and hip girth are respectively, 173.2cm, 93.0cm, 78.4cm and 94.3cm in men aged 19 years, and respectively 160.2cm, 83.6cm, 69.3cm and 92.8cm in women aged 19 years. These sizes are as large as Europeans in height (EN 13402-3, 2009), and have a narrower hips compared to American data from the ASTM standard (ASTM D 5585, 2011; LEE 2006; LEE 1999).
A number of studies have been carried out on the growth stages of puberty (Duke 1980; Tanner 1978; Tanner 1962). These reports showed that the puberty stages for boys appear at the age 9.1 to 12.5 years, while girls reaches the stages as early as 10.0 years. The growth stages are highly correlated to height growth as shown in Figures 1, 2.
The body proportion data from the 2010 surveys are plotted in Figure 3. Total body height is clearly of primary importance for all growing children for clothes-fitting purposes, and this has been recognized in many national standards (KS K 9402 2009; KS K 9403 2009; ASTM D 6458 2012; LEE 2003). Figure 3 shows the results of height dimension body proportion rate against the height. The results show respectively, 0.93, 0.81, 0.38, 0.99 and 0.26 times the height in eye height, shoulder height, fingertip height, span and maximum shoulder breadth. These values can be used to make work space and accessories design in order to predict the body length of each part (Greiner, 1992).
Figures 5, 6, 7, 8 show the body type of Korean divided by drop value. The values of chest girth according to waist girth are plotted in Figure 8-b. The regular body type N in women has the 6-9 drop value for bust and hip girth. These drop value distributions are quite similar in Japanese body type showing from JIS (JIS L 4005, 2001; LEE, 2006). Body size distribution sector is critical for size designation of body fitting clothes. The distribution ratio index of body height dimension corresponding to the bust/chest should be taken into consideration when designing good product construction systems.
Figure 9 shows the comparison between existing shapes with the desired virtual ones (i.e. a 8 head-tall-well-proportioned body), and with body shapes from 235 women from 20 to 29 years selected as harmonious body shape. According to the 8 head-tall- well proportional body, the waist height position should be at 100cm high for a woman being 160cm high (see the horizontal line).
As shown in Figures 14 and 16, the means of height, chest/bust, waist and hip girth are 173cm, 93cm, 77.4cm and 94cm, respectively, in 19-year-old men, and respectively 160cm, 84cm, 69.3cm and 93cm in 19-year-old women. These sizes can be regarded as the standard young adult female and male body shape in Korea, as shown below in Figure 14 (Photos from "Size Korea 2010"). The range of the Key dimensions at each sizing are reviewed based on Asian and European standards. These comparisons for the size designation system will eliminate the confusion that currently exists among countries and individual apparel designers.
5. Conclusions
The clothing sizing system is a recurrent problem with requires further research and improvement regarding sizing system standards, body measuring system and size labeling system in association with clothing manufacturers, consumers and researchers.
The higher level information processing and control of studies on human body growth and developing the compatible sizing system of clothes will eliminate the confusion that currently exists among countries and individual apparel designers. In the present production processes, standardization, by reducing differences and disorder, by guaranteeing quality, by increasing production efficiency and the rapidity of improvements, plays an ever important role in promoting international trade. Further, it makes it easier to expand, and more comfortable to practice.
Acknowledgement
The author would like to thank KATS for the database of Koreans used in the present study.
The part of this research was produced during sabbatical year of Chonnam National University (2014).
This paper is presented at the conference of 3D Body Scanning Technology, Nov. 2013 in USA and ACED conference, May 2014 in JEJU.
References
Ashizawa, K., Leg length increase in Japanese in the latter half of the 20th century, Anthropol. Sci., Vol. 110, 279-292, 2002.
ASTM D 5585, Standard tables of body measurements for adult female misses figure type, ASTM Standard, 2011.
ASTM D 6458, Standard tables of body measurements for boys, ASTM Standard, 2012.
DIN, International size charts, Maier, 1998.
Duke, P.M., et al., Adolescents' self-assessment of sexual maturation. Pediatrics, 66, pp. 918-20, 1980.
EN 13402-3, Measurements and intervals, EN Standard, 2009.
Gleiss, A., et al., Austrian height and body proportion reference for children aged 4-to under19 years, Ann Hum Biol, 40(4), 324 -332, 2013.
Greiner Thomas M. and Gordon, C.C., Secular trends of 22 body dimensions in four racial/cultural groups of American males, American Journal of Human Biology, 4, pp. 235-246, 1992.
Gupta, D. and Gangadhar, P., A statistical model for developing body size charts for garments, International Journal of Clothing Science and Technology, Vol. 16, pp. 458-469, 2004.
Hans W Jurgens, et.al., International data on anthropometry, Geneva, 1990.
ISO 3637, Size designation of clothes-women's and girls' outwear garments, ISO Standard, 1997.
ISO 7250, Basic human body measurements for technological design, ISO, TC159, 1997.
ISO 8559, Garment construction and anthropometric surveys, ISO, TC133, 1989.
JIS L 4005, Sizing systems for women's garments, JIS Standard, 2001.
KATS, The Report of the anthropometry survey, KATS Report, Korea, 1979.
KATS, The Report of the anthropometry survey, KATS Report, Korea, 1997.
KATS, The Report of the anthropometry survey, KATS Report, Korea, 2010.
Kouchi, M. and Mochimaru, M., Quality assurance of anthropometric data, Japan, Report WEAR, 2005.
KS K 0059, Sizing systems for women's garments, KS Standard, 2009.
KS K 9402, Sizing systems for boys' garments, KS Standard, 2009.
KS K 9403, Sizing systems for girls' garments, KS Standard, 2009.
LEE, Y.S., A study on the anthropometric change of Korean women body shape, report of KATS, 2003.
LEE, Y.S., Comparing samples from different countries for key sizing dimensions, 20th International Co Data Conference, pp. 65- 68, 2006.
LEE, Y.S., Morphological study in Korean for the garments sizing system, Report of Korea National Institute of Technology and Quality, 1999.
LEE, Y.S., The Measure of Women, Human body demension data in design, Korea, Shinsunsa Publication, 1999.
McMahon, T., Size and shape in biology, Science, 179, 23, 1973.
NFG 03-002, Habillement measures feminines, AFNOR Standard, 1997.
Tanner, J.M., Physical growth from conception to maturity, Cambridge, Massachusetts, Harvard University Press, 1978.
Tanner, J.M., White house, R.H. and Healy, M.J.R., A new system for estimating the maturity of the hand and wrist, with standards derived from 2,600 healthy British children, Paris, International Children's Center, 1962.
Author listings
Young-Suk Lee: jaabo1994@naver.com Highest degree: Ph.D. Otsuma University, Japan
Position title: Professor, Department of Clothing Science, Chonnam National University Areas of interest: Anthropometry, Human morphology, Standards, Sizing