© 2018 The Korean Ophthalmological Society
This is an Open Access article distributed under the terms of the Creative Commons Attribution Non-Commercial License (http://creativecommons.org/licenses /by-nc/3.0/) which permits unrestricted non-commercial use, distribution, and reproduction in any medium, provided the original work is properly cited.
Original Article
Optical Coherence Tomography Measurement and Visual Outcome in Acute Central Retinal Artery Occlusion
Heesuk Kim1*, Hong Kyu Kim2*, Jong Yun Yang3, Sung Soo Kim1
1Institute of Vision Research, Department of Ophthalmology, Severance Hospital, Yonsei University College of Medicine, Seoul, Korea
2Department of Ophthalmology, Dankook University Hospital, Dankook University College of Medicine, Cheonan, Korea
3Siloam Eye Hospital, Seoul, Korea
Purpose: This study investigated visual acuity (VA) values and differences depending on optical coherence to- mography (OCT) findings in patients with acute central retinal artery occlusion (CRAO).
Methods: A retrospective chart review was performed on patients with acute CRAO who underwent macular and disc OCT. We evaluated changes in macular thickness and retinal nerve fiber layer (RNFL) thickness after acute CRAO onset based on OCT. We also determined the association of thickness changes with VA improvement.
Results: This study involved both eyes in a total of 12 patients with acute CRAO. A significant increase was ob- served in foveal (1 mm) thickness (p = 0.002), parafoveal (3 mm) thickness (p = 0.002), and peripapillary RNFL thickness (p = 0.005) in affected eyes with CRAO, but not in central foveal thickness (p = 0.266). A significant small difference in both eyes (affected eye – fellow eye) was shown in foveal (1 mm) and mean parafoveal (3 mm) thickness in the improved VA group (p = 0.008 and p = 0.004, respectively), but not in central foveal or peri- papillary RNFL thickness (both p = 0.283).
Conclusions: Both macular and RNFL thickness increased in patients with acute CRAO. RNFL thickness de- creased over time with progression of RNFL atrophy. Less macular damage caused by acute CRAO could be predicted by a small difference in macular thickness between eyes (affected eye – fellow eye). In such cases, patients had a greater chance of VA improvement.
Key Words: Macular thickness, Optical coherence tomography, Retinal artery occlusion, Retinal nerve fiber layer thickness, Vision outcome
Central retinal artery occlusion (CRAO), first described by von Graefes in 1859, is an ocular emergency that usually
occurs with sudden vision loss in one eye [1]. Retinal artery occlusion (RAO) originates by the same pathophysiological mechanism as stroke caused by thromboembolism and has been found to increase the risk of stroke by 1.78 times in all Korean adults and 3.11 times in adults aged 65 years and older according to a nationwide cohort study [2,3]. RAO is significantly associated with hypertension, ischemic heart disease, atrial fibrillation, diabetes mellitus, chronic renal failure, hyperlipidemia, and other conditions. These condi-
Received: July 24, 2017 Accepted: November 29, 2017
Corresponding Author: Sung Soo Kim, MD, PhD. Department of Oph- thalmology, Severance Hospital, #50-1 Yonsei-ro, Seodaemun-gu, Seoul 03722, Korea. Tel: 82-2-2228-3570, Fax: 82-2-312-0541, E-mail: seme- [email protected]
*These two authors contributed equally to this article.
tions are also linked to an increased risk of stroke [3].
Optical coherence tomography (OCT) is a noninvasive imaging technique that can provide in vivo cross-sectional images of retinal microstructures. In recent years, many studies have examined patients with RAO using OCT [4-8].
Schmidt et al. [9] categorized CRAO as incomplete, subto- tal, or total CRAO based on the degree of vision loss, reti- nal edema, and arterial blood flow delay. They demonstrat- ed that final visual prognostic outcome depends on the stage classified. Ahn et al. [4] showed that retinal and cho- roidal structural changes predominantly differed depend- ing on the stage of CRAO determined using OCT. They showed that OCT can be a useful imaging biomarker for diagnosis, staging, and prognosis of CRAO.
However, no quantitative analysis has been done to ex- plore CRAO with peripapillary retinal nerve fiber layer (RNFL) thickness, though one study identified disc edema in 22% of patients with permanent CRAO [10]. For these reasons, we quantitatively analyzed macular thickness and peripapillary RNFL thickness in affected and fellow eyes using OCT in CRAO patients. We also compared changes in macular thickness and RNFL thickness of both eyes be- tween two groups with and without improvement in visual acuity (VA).
Materials and Methods
This study adhered to the tenets of the Declaration of Helsinki and was approved by the institutional review board of Severance Hospital of Yonsei University (4-2016- 0384). Due to the retrospective nature, informed consent was waived.
Study subjects
The patient database in Severance Hospital of Yonsei University was searched, and patient records between March 2010 and February 2016 were reviewed. Patients in- cluded were those who met the following criteria: 1) diag- nosed with acute CRAO without cilioretinal artery sparing, 2) presented within seven days of decrease in visual acuity, 3) spectral dominant optical coherent tomography (SD- OCT) examination performed within 6 days, and 4) under- went assessment of macular thickness and peripapillary RNFL thickness. Exclusion criteria were 1) the presence of
ocular diseases such as macular degeneration, 2) history of retinal artery occlusion or stroke, 3) suspicion of iatrogenic CRAO, 4) followed up for less than one month, or 5) man- agement with other therapies except conservative treat- ment.
All patients received conservative treatment, including ocular massage, anterior chamber paracentesis, and intra- ocular pressure-lowering agents. No patients underwent in- tra-arterial or intravenous thrombolysis.
Ophthalmic examinations
All patients underwent comprehensive ophthalmic exam- inations including best-corrected VA, noncontact tonome- try, slit-lamp biomicroscopy, indirect ophthalmoscope, fun- dus photography, fundus fluorescein angiography, and SD- OCT examination. Fundus angiography was carried out in both eyes (Fig. 1A). SD-OCT examination was performed using Spectralis (Heidelberg Engineering, Heidelberg, Ger- many). SD-OCT was carried out in macular and peripapil- lary RNFL mode in both eyes. When examining the macu- lar scan, a range of 20 by 20 degrees of macular image was obtained using the Volume Scan method with the Spectra- lis OCT machine. On macular scan, a thickness map was developed showing an average thickness of 1-mm-, 3-mm-, and 6-mm-diameter zones from the fovea by measuring the distance from RNFL to the basement membrane (Fig.
1B, 1C). On peripapillary RNFL scan, RNFL thickness was measured within a 3-mm-diameter circle of the disc center (Fig. 1D, 1E). Two authors (HKK and JYY) manual- ly corrected the center of the fovea and baseline RNFL to prevent segmentation errors caused by edema or thickening of inner and outer retinal layers. We used the average thicknesses of the 1-mm zone (define as foveal thickness) and the 3-mm zone (defined as parafoveal thickness). The average thickness of the 6-mm zone was excluded due to missing data when adjusting for the macular center. These measurements might be influenced by individual variations such as age and health status. For this reason, the differ- ence in measurements between affected and fellow eyes was used as a variable to compare patients. Assuming mac- ular thickness and RNFL thickness were the same in both eyes, differences in measurements of the two eyes were de- fined as macular thickness change and peripapillary RNFL thickness change.
Statistical analysis
Data for continuous variables were expressed as mean ± standard deviation. The Wilcoxon signed-rank test was used to assess changes in macular thickness and RNFL thickness in affected and fellow eyes. The Mann-Whitney U-test was used to compare differences in macular thick- ness and RNFL thickness changes between improved VA and non-improved VA groups. Spearman’s correlation was used to identify the correlation between foveal or parafo- veal thickness and RNFL thickness. A p-value less than 0.05 was considered statistically significant. Statistical analyses were performed using IBM SPSS ver. 23.0 (IBM Corp., Armonk, NY, USA).
Results
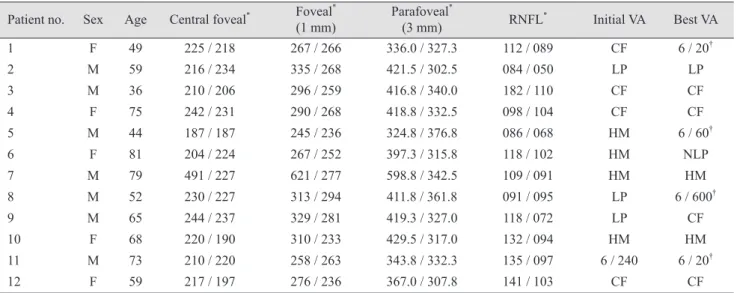
This study involved 12 affected and 12 fellow eyes in a total of 12 patients. The subjects were 7 men and 5 women, and their mean age was 61.7 ± 14.4 years (range, 36 to 81 years). Their initial VA was very poor (count fingers to light perception), and improvement in VA from baseline to high- er than count fingers was seen in 4 patients (Table 1).
According to comparison of macular thickness and RNFL thickness values measured with OCT, foveal thick- ness increased in the affected eye (p = 0.002), and parafove- al thickness increased at all temporal, superior, nasal, and inferior areas (all p < 0.005), but central foveal thickness did not (p = 0.266). Meanwhile, RNFL thickness increased sig- nificantly in the affected eye in all areas except the supero- nasal region (Table 2).
Differences in macular and RNFL thickness, defined as Fig. 1. Fundus angiography and optical coherence tomography of central retinal artery occlusion patient at initial visit (patient 1). Fundus angiography and optical coherence tomography scans taken at initial visit in patient 1 with central retinal artery occlusion. (A) shows disc leakage in the affected eye (the right eye) 10 minutes after fundus angiography. (B) shows macular thickness, and (C) represents the graph of measurements, indicating an increase of macular thickness on the affected side. (D) shows scan images of peripapillary retinal nerve fi- ber layer thickness, and (E) represents the graph of thickness values, revealing a thick retinal nerve fiber layer thickness in the affected eye compared with the fellow eye.
A
D C
E
B
the difference between the affected and fellow eyes of each patient (OCT measure of affected eye – OCT measure of fellow eye), were compared between the improved VA group and the non-improved VA group. When we defined the im-
proved VA group as those with a final VA greater than 6 / 600, differences in foveal and parafoveal thickness were sig- nificantly smaller in the improved VA group (p = 0.008, p = 0.004, respectively). However, no statistical difference was Table 1. Demographic data and visual acuity in patients with acute central retinal artery occlusion
Patient no. Sex Age Central foveal* Foveal*
(1 mm) Parafoveal*
(3 mm) RNFL* Initial VA Best VA
1 F 49 225 / 218 267 / 266 336.0 / 327.3 112 / 089 CF 6 / 20†
2 M 59 216 / 234 335 / 268 421.5 / 302.5 084 / 050 LP LP
3 M 36 210 / 206 296 / 259 416.8 / 340.0 182 / 110 CF CF
4 F 75 242 / 231 290 / 268 418.8 / 332.5 098 / 104 CF CF
5 M 44 187 / 187 245 / 236 324.8 / 376.8 086 / 068 HM 6 / 60†
6 F 81 204 / 224 267 / 252 397.3 / 315.8 118 / 102 HM NLP
7 M 79 491 / 227 621 / 277 598.8 / 342.5 109 / 091 HM HM
8 M 52 230 / 227 313 / 294 411.8 / 361.8 091 / 095 LP 6 / 600†
9 M 65 244 / 237 329 / 281 419.3 / 327.0 118 / 072 LP CF
10 F 68 220 / 190 310 / 233 429.5 / 317.0 132 / 094 HM HM
11 M 73 210 / 220 258 / 263 343.8 / 332.3 135 / 097 6 / 240 6 / 20†
12 F 59 217 / 197 276 / 236 367.0 / 307.8 141 / 103 CF CF
RNFL = retinal nerve fiber layer; VA = visual acuity; F = female; CF = count fingers; M = male; LP = light perception; HM = hand motion;
NLP = no light perception.
*Represented as affected eye thickness / fellow eye thickness (µm); †Patients with improvement in visual acuity.
Table 2. Optical coherence tomography measurements in patients with acute central retinal artery occlusion
Parameter Affected eye
(n = 12) Fellow eye
(n = 12) p-value*
Macular retinal thickness (µm)
Central foveal 241.3 ± 80.2 216.5 ± 17.3 0.266
Foveal (1 mm)† 317.3 ± 99.8 261.1 ±19.0 0.004
Parafoveal (3 mm)
Temporal† 390.9 ± 68.3 317.6 ± 19.1 0.002
Superior† 408.6 ± 71.5 327.0 ± 22.3 0.002
Nasal† 423.3 ± 88.0 327.5 ± 25.8 0.002
Inferior† 405.5 ± 59.5 322.3 ± 22.1 0.002
Mean† 407.1 ± 71.0 323.6 ± 21.9 0.002
Peripapillary retinal nerve fiber thickness (µm)
Temporal† 110.8 ± 45.0 070.5 ± 15.1 0.002
Superotemporal† 155.1 ± 14.2 122.1 ± 30.3 0.012
Superonasal 117.3 ± 45.0 098.8 ± 31.0 0.077
Nasal† 079.0 ± 36.7 056.3 ± 18.4 0.026
Inferonasal† 115.3 ± 34.7 090.2 ± 28.2 0.015
Inferotemporal† 170.1 ± 42.6 142.0 ± 21.6 0.019
Mean† 117.2 ± 27.8 089.6 ± 17.6 0.005
*Wilcoxon signed-rank test; †Differences were statistically significant at p < 0.05.
found in the difference in parapapillary RNFL thickness measurements between the improved VA and non-improved VA groups (Table 3). Even if we defined the improved VA group as those with a final VA greater than 6 / 60, differenc- es in foveal and parafoveal thickness were significantly smaller in the improved VA group (both p = 0.009, data not shown), although there was no statistical difference in para- papillary RNFL thickness (p = 0.283, data not shown).
We additionally evaluated the associations between base- line OCT features and final VA. When we evaluated the as- sociation between final VA and baseline OCT feature dif- ferences in the two eyes, final VA showed a significant correlation with baseline foveal and parafoveal thickness differences (p = 0.011, p = 0.001, respectively), but no signif- icant correlation with peripapillary RNFL thickness differ- ence (p = 0.846). When we evaluated the associations be- tween final VA and baseline OCT features in affected eyes, final VA showed a significant correlation with baseline fo-
veal and parafoveal thickness (p = 0.071, p = 0.011, respec- tively), but no significant correlation with peripapillary RNFL thickness (p = 0.842) (Table 4).
We did not find correlations between foveal or parafoveal thickness and RNFL thickness (p = 0.951, p = 0.538, data not shown) or between foveal or parafoveal thickness change and RNFL thickness change (p = 0.624, p = 0.806, data not shown).
Discussion
Acute retinal arterial ischemic disorders are mainly clas- sified as CRAO, branched retinal artery occlusion, or cot- ton wool spots and amaurosis fugax [11]. The rate of spon- taneous visual improvement in CRAO patients is very low.
Spontaneous recanalization can occur within 48 to 72 hours, but it is partial and has little effect on visual im- Table 3. Differences in macular thickness and peripapillary RNFL thickness change of affected and fellow eyes
Parameter Improved VA
(n = 4) Non-improved VA
(n = 8) p -value*
Mean follow-up period (mon) 19.5 ± 20.8 30.1 ± 21.4 0.610
Age (yr) 54.5 ± 12.8 65.3 ± 14.5 0.214
Sex, male (%) 3 (75.0) 4 (50.0) 0.408
Macular thickness difference (µm)
Central foveal 0.0 ± 7.3 37.3 ± 93.2 0.283
Fovea† 6.0 ± 10.4 81.3 ± 108.2 0.008
Parafovea
Temporal† 21.8 ± 23.0 99.1 ± 60.3 0.008
Superior† 28.5 ± 19.8 108.1 ± 60.8 0.008
Nasal† 30.3 ± 24.3 128.6 ± 76.7 0.004
Inferior† 37.8 ± 29.6 106.0 ± 53.4 0.016
Mean macular thickness† 29.6 ± 22.5 110.5 ± 61.9 0.004
Peripapillary retinal nerve fiber thickness (µm)
Temporal 30.0 ± 36.2 38.1 ± 27.4 0.368
Superotemporal 12.0 ± 29.7 45.4 ± 35.6 0.214
Superonasal 0.0 ± 16.2 28.0 ± 36.7 0.109
Nasal 26.0 ± 43.2 24.9 ± 22.9 0.808
Inferonasal 4.5 ± 7.9 31.6 ± 38.0 0.214
Inferotemporal 9.25 ± 24.1 35.8 ± 38.6 0.283
Mean RNFL thickness 14.5 ± 12.5 32.4 ± 23.3 0.283
RNFL = retinal nerve fiber layer; OCT = optical coherence tomography; VA = visual acuity.
*Mann-Whitney U-test for continuous variables, chi-square test for categorical variables; †Differences were statistically significant at p < 0.05.
provement [12]. Treatment options available for CRAO are as follows according to mechanism: 1) increasing blood ox- ygen, 2) reduction of intraocular pressure and hence in- crease of retinal artery perfusion, 3) reduction of retinal edema, 4) lysing or dislodging the clot, and 5) thrombolysis
of the embolus [13]. The use of thrombolysis of the embolus with recombinant tissue plasminogen activator remains controversial in patients with CRAO. Some studies have reported the benefits of intra-arterial or intravenous throm- bolysis [14-16], while other studies have found no benefits Table 4. Association between baseline optical coherence tomography measurements and final best visual acuity in patients with acute central retinal artery occlusion
Parameter Correlation coefficient p-value*
Macular thickness difference in both eye (µm)
Central foveal -0.032 0.921
Fovea† -0.700 0.011
Parafovea
Temporal† -0.789 0.002
Superior† -0.747 0.005
Nasal† -0.879 <0.001
Inferior† -0.868 <0.001
Mean macular thickness† -0.847 0.001
Peripapillary RNLF thickness difference in both eye (µm)
Temporal -0.089 0.783
Superotemporal -0.347 0.270
Superonasal -0.547 0.066
Nasal -0.247 0.429
Inferonasal -0.166 0.605
Inferotemporal -0.261 0.413
Mean RNFL thickness -0.063 0.846
Macular thickness in affected eye (µm)
Central foveal -0.050 0.877
Fovea -0.539 0.071
Parafovea
Temporal† -0.639 0.025
Superior† -0.554 0.062
Nasal† -0.666 0.018
Inferior† -0.800 0.002
Mean macular thickness† -0.700 0.011
Peripapillary RNFL thickness in affected eye (µm)
Temporal 0.261 0.413
Superotemporal -0.220 0.491
Superonasal -0.345 0.272
Nasal -0.293 0.355
Inferonasal -0.236 0.461
Inferotemporal -0.046 0.886
Mean RNFL thickness -0.065 0.842
RNFL = retinal nerve fiber layer.
*Spearman’s correlation test; †Differences were statistically significant at p < 0.05.
[17,18]. This study involved patients who received conser- vative treatment only via an increase in retinal artery per- fusion by reducing intraocular pressure.
Before the use of OCT, fundus photography was per- formed as a screening tool in patients with CRAO. Accord- ing to Hayreh and Zimmerman [10], the main findings for permanent CRAO were cherry-red spot (90%), retinal opacity (58%), box-carrying (19%), retinal arterial attenua- tion (32%), optic disc edema (22%), and pale disc (39%).
Since SD-OCT has been widely used in clinical imaging, studies have predominantly explored CRAO based on mi- cro-sectional images. These studies have shown that CRAO can lead to macular edema caused by thickening of inner and outer retinal layers due to ischemia of the superficial and deep capillary plexus [7]. The increase of macular thickness in the initial phase of ischemia can lead to macu- lar thickness decrease over time as atrophic change occurs [6,8]. Microvascular ischemia appears to affect the entire retina, not only the macular region. Subsequently, disc ede- ma is accompanied by RNFL thickening, and thickness de- crease is thought to develop following RNFL atrophy.
When we examined changes in RNFL thickness in a pa- tient over time, RNFL thinning progressed rapidly after CRAO onset (Fig. 2A-2F).
Several studies have been performed to determine the as- sociation of macular thickness measured with SD-OCT with VA improvement. Multiple studies have suggested the asso- ciation of initial macular thickness with improvement in VA [4,5,19]. On the contrary, one study observed no relationship between them [6]. These contradicting results are attributed to selection bias. The incidence of retinal artery occlusion is about 0.85 cases per 100,000 persons per year [20], and CRAO is even more rare. It is difficult to adjust for con- founding variables affecting macular thickness, including patient age and distribution of stage, in all patients with CRAO. Therefore, this controversy might have arisen from different research groups. Therefore, we conducted a com- parative analysis considering the difference in macular thickness between affected and fellow eyes as a novel vari- able defined as macular thickness change. Although a sig- nificantly smaller change in macular thickness was observed in the improved VA group, the results from this research cannot be generalized due to a relatively small sample size.
No correlation was found between macular thickness (foveal or parafoveal thickness) and RNFL thickness in this study. This outcome might be attributable to different ana- tomical locations of ischemic damage and the different types of blood vessels involved. Since blood supply to the Fig. 2. Changes in retinal nerve fiber layer (RNFL) thickness in the affected eye with central retinal artery occlusion (CRAO) (patient 4).
Optical coherence tomography scans taken over time in Patient 4 with CRAO. (A), (B), and (C) are peripapillary cross-sectional images and (D), (E), and (F) are schematic graphs of RNFL thickness. (A) and (D) are images taken at the initial visit (1 day after CRAO attack), (B) and (E) are images taken 2 months after onset, and (C) and (F) are peripapillary RNFL optical coherence tomography images and thick- ness assessed 6 months after onset, revealing a reduction in RNFL thickness over time after CRAO attack.
A
C B
D
E
F
optic disc arrives via retinal and posterior ciliary arteries [21], optic disc ischemia can be less severe as the posterior ciliary arteries play a compensatory role for ischemia in CRAO patients.
This study has several limitations. First, we conducted re- search on a small number of patients. Therefore, although actual RNFL changes can cause significant differences in visual outcome, there is a possibility that the results are not significant in this study. Second, morphological changes of macular and RNFL thickness might be stage-dependent and influenced by symptom duration. We did not consider these factors.
In conclusion, macular thickness measured by SD-OCT in the affected eye increased significantly compared with the fellow eye in patients with acute CRAO. A significant increase was also found in RNFL thickness, which then decreased over time with atrophic change in patients with acute CRAO. We demonstrated that a smaller difference in macular thickness between affected and fellow eyes can reveal less severe macular damage caused by acute CRAO.
A higher probability of VA improvement is anticipated in patients with less severe macular damage. Therefore, mac- ular thickness difference between affected and fellow eyes evaluated using SD-OCT in patients with acute CRAO can predict VA improvement.
Conflict of Interest
No potential conflict of interest relevant to this article was reported.
References
1. Sharma S, Brown GC. Retinal artery obstruction. In: Ryan SJ, editor. Retina. St. Louis: Mosby; 2001. p. 1350-67.
2. Hollenhorst RW. Significance of bright plaques in the reti- nal arterioles. JAMA 1961;178:23-9.
3. Rim TH, Han J, Choi YS, et al. Retinal artery occlusion and the risk of stroke development: twelve-year nationwide cohort study. Stroke 2016;47:376-82.
4. Ahn SJ, Woo SJ, Park KH, et al. Retinal and choroidal changes and visual outcome in central retinal artery occlu- sion: an optical coherence tomography study. Am J Oph- thalmol 2015;159:667-76.
5. Chen H, Xia H, Qiu Z, et al. Correlation of optical intensity on optical coherence tomography and visual outcome in central retinal artery occlusion. Retina 2016;36:1964-70.
6. Chen SN, Hwang JF, Chen YT. Macular thickness mea- surements in central retinal artery occlusion by optical coherence tomography. Retina 2011;31:730-7.
7. Yu S, Pang CE, Gong Y, et al. The spectrum of superficial and deep capillary ischemia in retinal artery occlusion. Am J Ophthalmol 2015;159:53-63.
8. Shinoda K, Yamada K, Matsumoto CS, et al. Changes in retinal thickness are correlated with alterations of elect- roretinogram in eyes with central retinal artery occlusion.
Graefes Arch Clin Exp Ophthalmol 2008;246:949-54.
9. Schmidt DP, Schulte-Monting J, Schumacher M. Prognosis of central retinal artery occlusion: local intraarterial fibri- nolysis versus conservative treatment. AJNR Am J Neu- roradiol 2002;23:1301-7.
10. Hayreh SS, Zimmerman MB. Fundus changes in central retinal artery occlusion. Retina 2007;27:276-89.
11. Hayreh SS. Acute retinal arterial occlusive disorders. Prog Retin Eye Res 2011;30:359-94.
12. Rumelt S, Brown GC. Update on treatment of retinal arte- rial occlusions. Curr Opin Ophthalmol 2003;14:139-41.
13. Cugati S, Varma DD, Chen CS, Lee AW. Treatment options for central retinal artery occlusion. Curr Treat Options Neurol 2013;15:63-77.
14. Ahn SJ, Kim JM, Hong JH, et al. Efficacy and safety of in- tra-arterial thrombolysis in central retinal artery occlusion.
Invest Ophthalmol Vis Sci 2013;54:7746-55.
15. Hattenbach LO, Kuhli-Hattenbach C, Scharrer I, Baatz H.
Intravenous thrombolysis with low-dose recombinant tissue plasminogen activator in central retinal artery occlusion.
Am J Ophthalmol 2008;146:700-6.
16. Chen CS, Lee AW, Campbell B, et al. Efficacy of intrave- nous tissue-type plasminogen activator in central retinal artery occlusion: report from a randomized, controlled tri- al. Stroke 2011;42:2229-34.
17. Schumacher M, Schmidt D, Jurklies B, et al. Central reti- nal artery occlusion: local intra-arterial fibrinolysis versus conservative treatment, a multicenter randomized trial.
Ophthalmology 2010;117:1367-75.
18. Schrag M, Youn T, Schindler J, et al. Intravenous fibri- nolytic therapy in central retinal artery occlusion: a pa- tient-level meta-analysis. JAMA Neurol 2015;72:1148-54.
19. Ikeda F, Kishi S. Inner neural retina loss in central retinal artery occlusion. Jpn J Ophthalmol 2010;54:423-9.
20. Klein R, Klein BE, Moss SE, Meuer SM. Retinal emboli and cardiovascular disease: the Beaver Dam Eye Study.
Arch Ophthalmol 2003;121:1446-51.
21. Hayreh SS. Blood supply of the optic nerve head. Ophthal- mologica 1996;210:285-95.