Dose Dependent Effects of Intravitreal Triamcinolone Acetonide on Diffuse Diabetic Macular Edema
Joon Sung Bae, MD
1, Sung Joon Park, MD
1, I Rum Ham, MD
1, Tae Gon Lee, MD
21
Department of Ophthalmology, Konyang University, Kim’s Eye Hospital, Seoul, Korea
2
Department of Ophthalmology, College of Medicine, Konyang University, Daejeon, Korea
Purpose: To evaluate the effect of different doses of intravitreal triamcinolone acetonide on diffuse diabetic macular edema.
Methods: In a retrospective study, 44 eyes with diffuse diabetic macular edema were treated with an intravitreal injection of 4 mg (n=12 eyes), 8 mg (n=17) or 25 mg (n=15) of triamcinolone acetonide (TA). Optical coherence tomography, best-corrected logMAR visual acuity and Goldmann tonometry were performed at baseline, 1 week, and 1, 3, 6, 9 and 12 months after treatment. Mean follow-up was 9.8 months (standard deviation=2.3) with a range of 5-12 months.
Results: The duration of intravitreal TA effects on macular thickness and visual acuity increased with increasing dosage. An observed increase in intraocular pressure induced by TA was not significantly associated with dosage.
Conclusions: In patients with diffuse diabetic macular edema who receive intravitreal TA, effects may last longer after a dosage of 25 mg, than after lower doses of 8 mg or 4 mg.
Korean J Ophthalmol 2009;23:80-85 ⓒ 2009 by the Korean Ophthalmological Society.
Key Words: Diabetic macular edema, Intravitreal triamcinolone acetonide injection
Received: June 13, 2008 Accepted: March 30, 2009
Reprint requests to Tae Gon Lee, MD. Department of Ophthalmology, Konyang University Hospital, #685 Gasuwon-dong, Seo-gu, Daejon 302-718, Korea. Tel: 82-42-600-9250, Fax:82-42-600-9176, E-mail: [email protected]
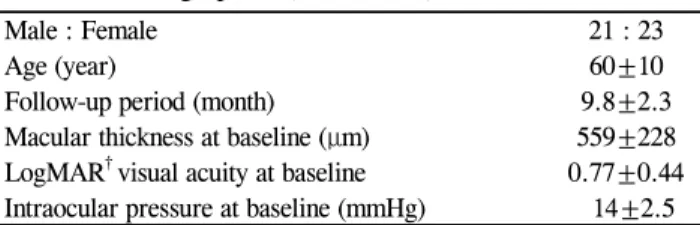
Table 1. Demographics (mean±SD
*)
Male : Female 21 : 23
Age (year) 60±10
Follow-up period (month) 9.8±2.3
Macular thickness at baseline (μm) 559±228 LogMAR
†visual acuity at baseline 0.77±0.44 Intraocular pressure at baseline (mmHg) 14±2.5
*
standard deviation;
†the logarithm of the minimum angle of resolution.
Macular edema is the main cause of visual impairment in diabetic patients.
1The Early Treatment Diabetic Retinopathy Study trial showed that focal laser photocoagulation is bene- ficial for eyes with clinically significant diabetic macular edema.
2However, the therapeutic value of scattered laser coagulation of the macula when capillary leakage and macular edema diffusely involve the posterior pole of the fundus has not been conclusively shown.
3Recent investigations have reported the use of intravitreal triamcinolone acetonide (TA) for treatment of diffuse diabetic macular edema.
4,5The exact mechanism of effects is not known, but triamcinolone is presumed to diminish retinal leakage and reduce retinal thickening in the macula, leading to improved visual acuity.
6Different doses varying from about 4 mg to about 20 mg TA have been employed thus far. Whether efficacy and duration of the effect of intravitreal TA are dosage-dependent is unknown.
Spandau et al.
7reported that the efficacy of intravitreal TA was dosage-dependent, and treatment response lasted longer, and was more pronounced with increasing dosage.
The purpose of this study was to investigate the dosage- dependency of the duration and efficacy of intravitreal TA in the treatment of diffuse diabetic macular edema.
Materials and Methods
This clinical retrospective study included 44 eyes (40 patients) with diabetic macular edema, defined according to the Early Treatment Diabetic Retinopathy Study (ETDRS).
All patients were treated randomly with 4 mg, 8 mg, or 25 mg TA intravitreally, from 2004 June to 2005 May.
Assessment of diabetic macular edema was based on oph- thalmoscopic examination, fluorescein angiography and OCT of the macula. The patients consisted of 19 men and 21 women with a mean age of 60 years (standard deviation [SD] 10;
range 43-83 years). Mean follow-up was 9.8 months (SD 2.3;
range 5-12 months). Macular thickness at baseline was 559 μm (SD 228; range 174-1263 μm). LogMAR visual acuity at baseline was 0.77 logMAR units (SD 0.44; range 0.2-2 units).
Mean intraocular pressure (IOP) at baseline was 14 mmHg (SD 2.5; range 9-19 mmHg) (Table 1).
Treatment with TA was intravitreal, with 12 eyes (27%)
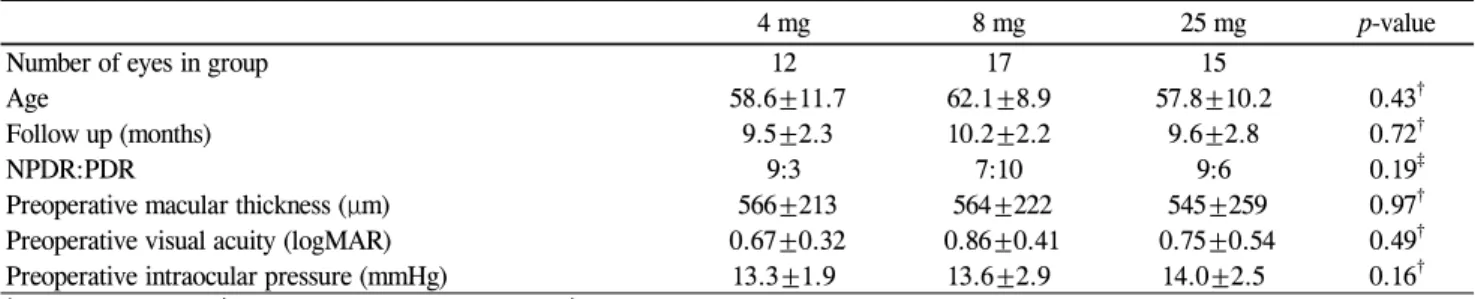
Table 2. Baseline data of patients in each study group (mean±SD
*)
4 mg 8 mg 25 mg p-value
Number of eyes in group 12 17 15
Age 58.6±11.7 62.1±8.9 57.8±10.2 0.43
†Follow up (months) 9.5±2.3 10.2±2.2 9.6±2.8 0.72
†NPDR:PDR 9:3 7:10 9:6 0.19
‡Preoperative macular thickness (μm) 566±213 564±222 545±259 0.97
†Preoperative visual acuity (logMAR) 0.67±0.32 0.86±0.41 0.75±0.54 0.49
†Preoperative intraocular pressure (mmHg) 13.3±1.9 13.6±2.9 14.0±2.5 0.16
†*
standard deviation;
†analysis of variance (ANOVA);
‡Chi-square test.
Table 3. Changes in macular thickness during follow-up (mean±SD
*) Follow-up
4 mg 8 mg 25 mg
No. of eyes
Differences
†of macular thickness
(μm) p-value
‡No. of eyes
Differences
†of macular thickness
(μm) p-value
‡No of eyes
Differences
†of macular
thickness (μm) p-value
‡1 month 12 347±203 0.002 17 351±203 0.001 15 363±239 0.001
3 months 12 306±209 0.005 17 333±267 0.002 15 348±251 0.001
6 months 11 80±173 0.345 16 246±212 0.003 10 333±310 0.018
9 months 8 12±56 0.741 12 -52±92 0.225 6 77±112 0.265
12 months 6 7±42 0.712 9 -73±136 0.295 6 134±171 0.114
*
standard deviation;
†Differences between the preoperative and the postoperative macular thickness;
‡Wilcoxon signed-rank test.
Fig. 1. Time course of macular thicknesses using OCT 3. Among the three groups, significant differences in macular thickness were seen at 6, 9 and 12 months (p=0.036, 0.028, 0.008 by ANOVA). In post-hoc tests, macular thickness in the 25 mg group was signi- ficantly thinner than in the 4 mg group at 6 months, and the other two groups at 9 and 12 months (p<0.05 by Tukey).
receiving 4 mg, 17 (39%) receiving 8 mg, and 15 (34%) treated with 25 mg. No patients received reinjection. During follow-up, if ocular surgery or other ocular treatment of diabetic retino- pathy had been performed, the patients were regarded as dropped at follow-up. All eyes included into the study received their last retinal laser treatment at least one month before inclusion into the study. If the criteria for retinal laser treatment according to the ETDRS study were fulfilled, laser treatment was performed. None of the eyes had received intravitreal injection before inclusion into the study. Randomization of patients into study groups was masked by the hospital pharmacy.
The hospital pharmacy prepared the TA for intraocular injection by extracting 0.1 mL (for an intended dosage of 4 mg) or 0.2 mL (for 8 mg) from a vial (Rheudenolone
Ⓡ, 40 mg/mL Kukje pharmacy, Korea) containing 40 mg of TA in 1 mL. The extracted volume was put into a tuberculin syringe (1 mL). An intended dosage of 25 mg was prepared from 0.1 mL precipitate after erecting the syringe for 1 hour before extracting 1 mL from the vial. Concentrations were measured by High Phase Liquid Chromatography assay.
The extracted TA was injected into the vitreous after instillation of 0.5% propacaine hydrochloride (Alcaine
Ⓡ, Alcon, USA) and 5% povidone iodine. The injection was performed 3.5 mm posterior to the limbus, through the inferior pars plana, with a 30-gauge needle. All patients were given levofloxacine drops (Cravit
Ⓡ, Santen, Japan) as a prophylactic treatment.
Visual acuity, macular thickness, and IOP baselines were determined at the beginning of the study. Macular thickness was measured by optical coherent tomography (OCT 3) (STRATUS-OCT Model 3000, Carl Zeiss Meditec Inc., San- Leandro. CA) and IOP was measured by Goldmann applana-
tion tonometry (GAP). Visual acuity was determined in a
standardized fashion by an observer performing best corrected
refractometry, with measurements converted into the logarithm
of the minimum angle of resolution (logMAR). Macular thick-
ness was determined manually with an OCT 3 measurement
by a sophisticated examiner. IOP with GAP was measured by
the same doctor. Visual acuity and IOP were re-examined the
first day after the injection, then after 1 week and 1, 2, and 3
months after the injection, and then at 3-month intervals.
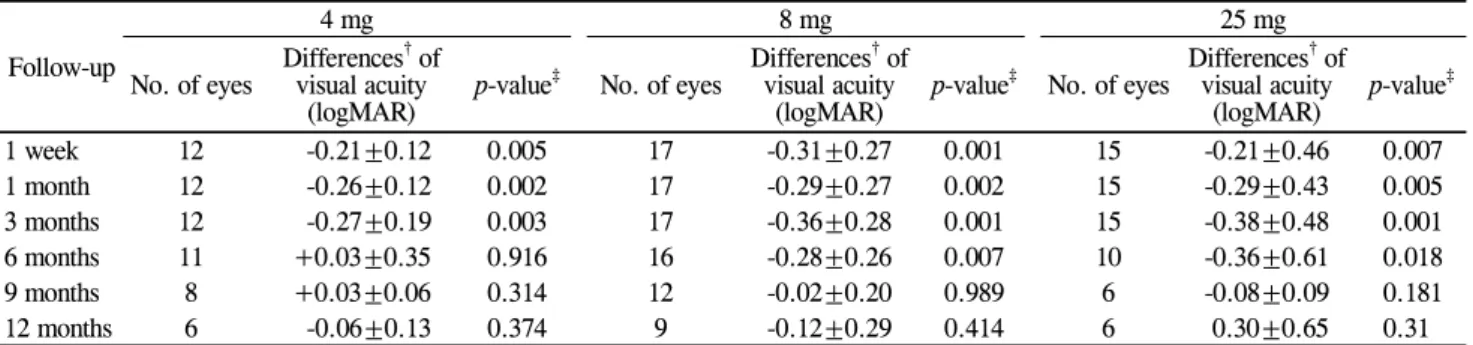
Table 4. Changes in visual acuity during follow-up (mean±SD
*) Follow-up
4 mg 8 mg 25 mg
No. of eyes Differences
†of visual acuity
(logMAR) p-value
‡No. of eyes Differences
†of visual acuity
(logMAR) p-value
‡No. of eyes Differences
†of visual acuity
(logMAR) p-value
‡1 week 12 -0.21±0.12 0.005 17 -0.31±0.27 0.001 15 -0.21±0.46 0.007
1 month 12 -0.26±0.12 0.002 17 -0.29±0.27 0.002 15 -0.29±0.43 0.005
3 months 12 -0.27±0.19 0.003 17 -0.36±0.28 0.001 15 -0.38±0.48 0.001
6 months 11 +0.03±0.35 0.916 16 -0.28±0.26 0.007 10 -0.36±0.61 0.018
9 months 8 +0.03±0.06 0.314 12 -0.02±0.20 0.989 6 -0.08±0.09 0.181
12 months 6 -0.06±0.13 0.374 9 -0.12±0.29 0.414 6 0.30±0.65 0.31
*
standard deviation;
†Differences between the preoperative and the postoperative visual acuity;
‡Wilcoxon signed-rank test.
Macular thickness was rechecked at 1, 3, 6, 9, and 12 months.
Mean follow-up was 9.8 (SD 2.3) months (range 5-12 months).
Statistical analyses were performed using a commercially available statistical software package (SPSS
Ⓡfor Windows, version 12.0, SPSS, Chicago, IL, USA) for analysis of variance (ANOVA), chi-square test, Wilcoxon signed-rank test and Mann-Whitney test. The post-hoc test was done with Tukey analysis. The level of significance was 0.05 (two-sided) for all statistical testing.
Results
In the first investigation, the 4 mg, 8 mg, and 25 mg study groups contained 12, 17, and 15 eyes, respectively, while in the final investigation, they contained 6, 9 and 6 eyes. Diag- noses, ages, and follow-up periods were not significantly different among the three study groups (p=0.43, 0.51, 0.19), and there were no statistical differences in preoperative macular thickness, visual acuity, or IOP among three groups (p=0.97, 0.49, 0.16) (Table 2).
Macular thickness during follow-up
In the 4 mg study group, macular thickness decreased significantly (p=0.002) from 566 μm at baseline to a peak of 218 μm at the 1-month follow-up. The thinnest region of macular thickness increased to a thickness of 653 μm at 12 months after injection. After the 3-month follow-up, macular thickness differed significantly from the baseline value (p=
0.005). Macular thickness at baseline (566 μm) and at the 6-month follow-up (513 μm) did not differ significantly (p=0.345). Macular thickness at the 9-month follow-up (737 μm) and the 12-month follow-up (653 μm) was thicker than at baseline (566 μm; p=0.741 for 9-month and p=0.712 for 12-month; Table 3, Fig. 1).
In the 8 mg study group, macular thickness decreased significantly from 565 μm at baseline to a plateau of 213 μm (p=0.001) to 247 μm (p=0.002) at 1 and 3 months after injec- tion. It increased to a value of 656 μm at 12 months after injection. Macular thickness obtained at the 6-month follow- up was significantly thinner than baseline (350 μm; p=0.003).
Macular thickness at the 9-month (611 μm) and 12-month
(656 μm) follow-ups was thicker than at baseline (565 μm p=0.225 and p=0.295; Table 3, Fig. 1).
In the 25 mg study group, macular thickness decreased significantly from 546 μm at baseline to a plateau between 182 μm (p=0.001) at 1 month after injection, 197 μm (p=
0.001) at 3 months after injection and 216 μm (p=0.018) at 6 months after injection. At the 9-month and 12-month follow- ups, macular thicknesses were 309 and 314 μm, which were thinner than baseline (546 μm) but not significantly different (p=0.2650 for 9-months and p=0.114 for 12-months; Table 3, Fig. 1).
Among the three groups, there were significant differences in macular thickness at 6, 9 and 12 months. At 6 months, macular thickness was significantly different (p=0.036), especially between the 4 mg and 25 mg groups (p=0.028). At 9 months, macular thickness was significantly different (p=0.008), espe- cially between the 4 mg and 25 mg group, and also between the 8 mg and 25 mg groups (p=0.009 and 0.029). At 12 months, comparison of macular thickness showed significant diffe- rences among the three groups (p=0.002). The macular thickness of the 25 mg study group was significantly thinner than in the other groups at 9 and 12 months (p<0.05; Fig. 1).
Visual acuity during follow-up
In the 4 mg study group, increase in visual acuity was significantly (p=0.003), from 0.67 logMAR unit at baseline to a peak of 0.39 logMAR unit at the 3-month follow-up.
From this peak value, it decreased to 0.66 at 12 months after injection. Visual acuity obtained at 1 week (0.46 logMAR unit), 1 month (0.41 logMAR unit) and 3 months (0.39 logMAR unit) differed significantly from the baseline visual acuity (p=0.005, 0.002, and 0.003). Visual acuity at 6, 9 and 12 months (0.73, 0.57, 0.66 logMAR unit) did not differ significantly from the baseline (0.67 logMAR unit; p=0.594, 0.115, 0.374;
Table 4, Fig. 2).
In the 8 mg study group, increase in visual acuity was
significant (p=0.001), from 0.86 logMAR unit at baseline to
a peak of 0.51 logMAR unit at the 3-month follow-up. From
this peak, it decreased to a value of 0.94 logMAR unit at 12
months after injection. Visual acuity obtained at 1 week (0.55
logMAR unit), 1 month (0.57 logMAR unit), 3 months (0.50
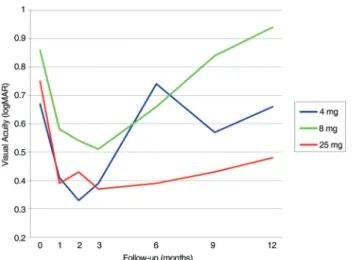
Fig. 2. Time course of logMAR visual acuities. Significant differ- ences among the three groups were seen at the 9- and 12-month fol- low-up (p<0.05 by ANOVA). The 25 mg study group showed sig- nificantly better visual acuity than other two groups (p<0.05) by a post-hoc test.
Table 5. Changes in intraocular pressure during follow-up (mean±SD
*)
Follow-up 4 mg 8 mg 25 mg
No. of
eyes Differences
†of
pressure (mmHg) p-value
‡No. of
eyes Differences
†of
pressure (mmHg) p-value
‡No. of
eyes Differences
†of
pressure (mmHg) p-value
‡1 week 12 -0.3±3.1 0.758 17 0.7±2.3 0.752 15 1.1±3.4 0.305
1 month 12 0.3±1.9 0.546 17 1.2±3.4 0.231 15 1.9±4.1 0.114
3 months 12 1.0±2.7 0.234 17 2.2±3.1 0.015 15 3.9±4.6 0.008
6 months 11 -0.7±2.5 0.395 16 1.6±3.7 0.139 10 5.1±9.1 0.171
9 months 8 1.5±1.9 0.180 12 0.8±4.8 0.928 6 2.0±3.6 0.131
12 months 6 0.4±1.8 0.648 9 -0.8±4.0 0.68 6 0.6±2.2 0.50
*
standard deviation;
†Differences between the preoperative and the postoperative intraocular pressure;
‡Wilcoxon signed-rank test.
Fig. 3. Time course of intraocular pressure. At 6, 9, and 12 months, significantly different results were obtained among the three groups (p=0.027, 0.025, 0.028 by ANOVA). Group 1 and 2 showed sig- nificant differences (p=0.025, 0.027) at 6 and 12 months, and groups 1 and 3 showed differences (p=0.025) at 9-months by post- hoc test.
logMAR unit), and 6 months (0.66 logMAR unit) differed significantly from the baseline (p=0.001, 0.002, 0.001, and 0.007). Visual acuity at the 9 and 12 month follow-ups (0.88, 0.94 logMAR unit) did not differ significantly from the baseline (p=0.989, 0.414; Table 4, Fig. 2).
In the 25 mg study group, visual acuity increased signifi- cantly (p=0.018) from 0.75 logMAR unit at baseline to a peak of 0.37 logMAR unit at the 3-month follow-up. From this peak, it decreased to a value of 0.48 logMAR unit at 12 months after injection. Visual acuity at 1 week (0.54 logMAR unit), 1 month (0.39 logMAR unit), 3 months (0.37 logMAR unit), and 6 months (0.39 logMAR unit) differed significantly from the baseline (p=0.007, 0.005, 0.001, and 0.018). Visual acuity at the 9- and 12- month follow-ups (0.42, 0.48 logMAR unit) did not differ significantly from the baseline (p=0.181, 0.310;
Table 4, Fig. 2).
At 9 and 12 months, visual acuity showed significant differences between the three groups (p=0.016, 0.002). At 9 and 12 months, comparisons between the 4 mg and 25 mg group, and also between the 8 mg and 25 mg groups showed significant differences (p<0.05), with the 25 mg group having better visual acuity (Fig. 2).
IOP during follow-up
In the 4 mg study group, IOP increased slightly, from 13.7 mmHg at baseline to a peak of 14.7 mmHg at the 3-month follow-up, however the change was not statistically signi- ficant (p=0.232). From the peak value, it decreased to 12.2 mmHg at 12 months after injection. IOP obtained through the follow-up period did not differ significantly from the baseline (Table 5, Fig. 3).
In the 8 mg study group, IOP increased from 13.7 mmHg at baseline to a peak of 15.8 mmHg at the 3-month follow-up and the change was statistically significant (p=0.015). From the peak value, it decreased to 15.4 mmHg at 12 months after injection. IOP measurements obtained through the follow-up period did not differ significantly from the baseline IOP, except at 3 months (Table 5, Fig. 3).
In the 25 mg study group, IOP increased from 15.0 mmHg at baseline to a peak of 19.9 mmHg at the 6-month follow-up, but the change was not statistically significant (p=0.171).
From the peak value, it decreased to 14.5 mmHg at 12 months
after injection. IOP obtained through the follow-up period
did not differ significantly from the baseline (Table 5, Fig. 3).
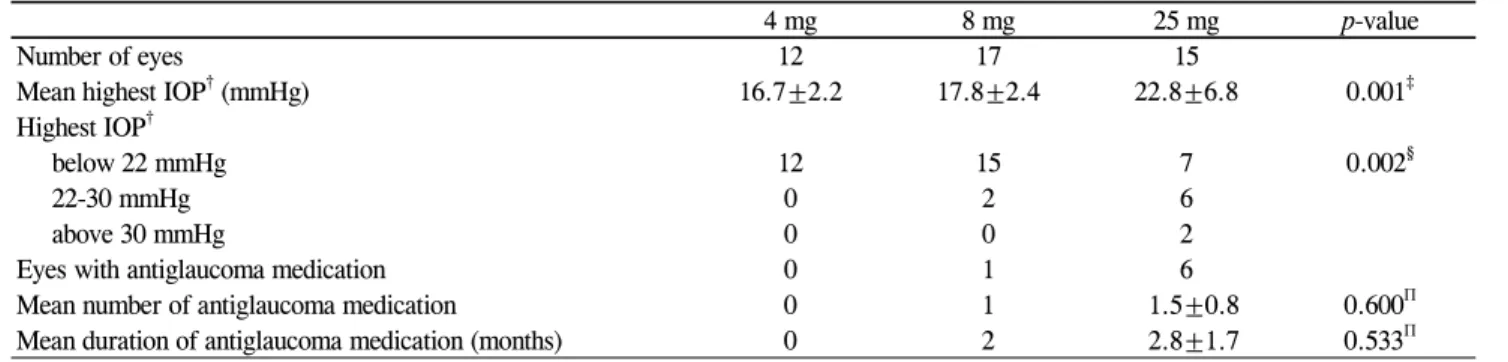
Table 6. Elevated intraocular pressure during follow-up (mean±SD
*)
4 mg 8 mg 25 mg p-value
Number of eyes 12 17 15
Mean highest IOP
†(mmHg) 16.7±2.2 17.8±2.4 22.8±6.8 0.001
‡Highest IOP
†below 22 mmHg 12 15 7 0.002
§22-30 mmHg 0 2 6
above 30 mmHg 0 0 2
Eyes with antiglaucoma medication 0 1 6
Mean number of antiglaucoma medication 0 1 1.5±0.8 0.600
ПMean duration of antiglaucoma medication (months) 0 2 2.8±1.7 0.533
П*