• 검색 결과가 없습니다.

Hyperglycemia exacerbates downregulation of dynamin-likeprotein 1 in ischemic cerebral injury

N/A
N/A
Protected

Academic year: 2022

Share "Hyperglycemia exacerbates downregulation of dynamin-likeprotein 1 in ischemic cerebral injury"

Copied!
7
0
0

로드 중.... (전체 텍스트 보기)

전체 글

(1)

Lab Anim Res 2017: 33(3), 202-208 https://doi.org/10.5625/lar.2017.33.3.202

ISSN 2233-7660 (Online)

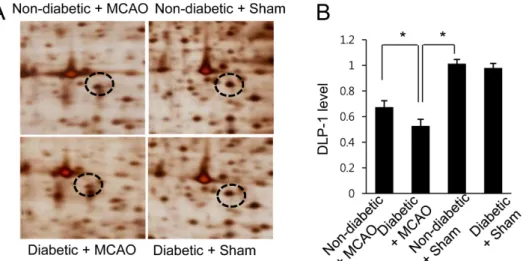
Hyperglycemia exacerbates downregulation of dynamin-like protein 1 in ischemic cerebral injury

Dong-Ju Park

1

, Myeong-Ok Kim

2

, Phil-Ok Koh

1,

*

1

Department of Anatomy, College of Veterinary Medicine, Research Institute of Life Science,

2

Division of Life Science and Applied Life Science, College of Natural Sciences, Gyeongsang National University, Jinju, Korea

Ischemic stroke is one of the leading causes of adult disability and death. Hyperglycemia is associated with an increased risk of stroke and poor outcomes after brain injury. Dynamin-like protein I (DLP-1) regulates mitochondrial fission and promotes mitochondrial dynamics. Neurodegenerative diseases are associated with mitochondrial dysfunction, and the downregulation of DLP-1 has been previously identified in a stroke animal model. Here, we investigated the changes in DLP-1 protein expression in an animal model of focal cerebral ischemia with induced hyperglycemia. Streptozotocin (40 mg/kg) was intraperitoneally injected into male rats to induce hyperglycemia, and middle cerebral artery occlusion (MCAO) was surgically induced 4 weeks after streptozotocin treatment. Brain tissue was isolated 24 hours after MCAO, and cerebral cortex samples were used for this study. Proteomics revealed a decrease in DLP-1 expression in MCAO animals when compared with controls, and this downregulation was more prominent in MCAO animals with hyperglycemia. Reverse-transcription polymerase chain reaction and Western blot analyses confirmed that DLP-1 was significantly downregulated in MCAO-injured animals with hyperglycemia compared to those without hyperglycemia. The decrease in DLP-1 indicates mitochondrial morphological changes and dysfunction. Together, these results suggest that the severe decrease of DLP-1 seen after brain injury under hyperglycemic conditions may exacerbate the damage to the brain.

Keywords: Brain ischemia, hyperglycemia, MCAO, dynamin-like protein 1

Received 13 May 2017; Revised version received 6 September 2017; Accepted 6 September 2017

Cerebral ischemia is associated with high mortality and severe disability [1]. The risk of cerebral ischemia is higher under hyperglycemic conditions than normal conditions [2]. Hyperglycemia exacerbates brain damage from acute cerebral ischemia and worsens the outcome of stroke [3]. Hyperglycemia increases blood-brain barrier permeability and vascular inflammation, and impairs cellular metabolism during cerebral ischemia [4-6].

Moreover, good control of blood glucose levels decreases mortality after ischemic stroke and improves the outcome of cerebral ischemia [7]. Ischemic injury, including cerebral ischemia, leads to increases in intracellular calcium, reactive oxygen species (ROS) generation, mitochondrial dysfunction, and the inflammatory response

[8,9]. Ultimately, cerebral ischemic conditions cause neuronal dysfunction and neuronal cell damage.

Dynamin-like protein 1 (DLP-1) is a GTPase that controls mitochondrial fission and fusion. DLP-1 is a member of the dynamin superfamily of proteins, and is abundantly localized in synapses [10]. Mitochondria maintain a dynamic reticular network by fission and fusion events. An imbalance between mitochondrial fission and fusion can cause mitochondrial dysfunction and structural impairment. Mitochondria are involved in various cellular functions, including supplying cellular energy, controlling the cell cycle, and playing a role in cell signaling, differentiation, and death [11]. Thus, dysfunction of mitochondria in neurons can cause the

*Corresponding author: Phil-Ok Koh, Department of Anatomy, College of Veterinary Medicine, Gyeongsang National University, 501 Jinjudaero, Jinju 52828, Korea

Tel: +82-55-772-2354; Fax: +82-55-772-2349; E-mail: [email protected]

This is an Open Access article distributed under the terms of the Creative Commons Attribution Non-Commercial License (http://creativecommons.org/licenses/

by-nc/3.0) which permits unrestricted non-commercial use, distribution, and reproduction in any medium, provided the original work is properly cited.

(2)

disruption of energy generation and can lead to neuronal damage [12-14]. Moreover, the expression of DLP-1 is associated with synaptic formation in hippocampal neurons [15]. Deficient synaptic formation and mitochondrial aggregation in DLP-1 knockout mice has been shown to lead to developmental abnormalities in the forebrain [15- 17 ]. These data support that DLP-1 is an essential protein for synaptic formation and mitochondrial functioning in neurons. We previously demonstrated that cerebral ischemic injury decreases DLP-1 expression [18]. Although several studies have demonstrated that hyperglycemic conditions exacerbate brain damage during cerebral ischemia, little is known about DLP-1 expression in ischemic brains in the context of diabetes.

Thus, the aim of this study was to investigate whether hyperglycemic conditions affect DLP-1 expression following focal cerebral ischemia.

Materials and Methods

Experimental animals

Male Sprague-Dawley rats (200-220 g, n=60) were purchased from Samtako Co. (Animal Breeding Center, Osan, Korea), maintained under controlled temperature (25

o

C) and lighting (12/12-h light/dark cycle), and were allowed free access to food. All experiments were carried out in accordance with guidelines approved by the ethics committee concerning animal research at Gyeongsang National University (GNU-141222-R0064).

Rats were randomly divided into four groups: non- diabetic+sham, diabetic+sham, non-diabetic+MCAO, and diabetic+MCAO. Diabetic conditions were induced by intraperitoneal injection of streptozotocin (40 mg/kg, Sigma, St. Louis, MO, USA). Streptozotocin was dissolved in 10 mM citrate buffer (pH 4.6) and non-diabetic animals received only citrate buffer as the vehicle. Blood glucose levels were determined using a strip sensor (Accu-Chek-Roche Diagnostics, Mannheim, Germany) according to the manufacturer protocol. A fasting blood glucose of >300 mg/dL was considered diabetic. Body weight and blood glucose were measured before MCAO.

Middle cerebral artery occlusion

MCAO was conducted via an intraluminal procedure, as previously described, after 4 weeks of streptozotocin treatment [19]. Zoletil (50 mg/kg; Virbac, Carros, France) was used for anesthesia before MCAO. Briefly, the right common carotid artery, external carotid artery, and

internal carotid artery were exposed through a midline cervical incision. The occipital and superior thyroid arteries were knotted with 6/0 black silk thread and subsequently cut. The external carotid artery was knotted with black silk thread, and a 4/0 monofilament nylon needle with a blunted round tip about 30 mm in length was inserted from the external carotid artery into the internal carotid artery until the tip blocked the origin of the middle cerebral artery. Sham-operated animals were subjected to the same procedures except for the insertion of the filament. Rats were decapitated 24 hours after the onset of permanent occlusion, and brain tissue was carefully excised. The infarction volume was determined by 2,3,5-triphenyltetrazolium chloride (TTC; Sigma) staining. Brain tissues were cut into 2-mm coronal sections using a brain matrix (Zivic Instruments, Pittsburgh, PA, USA). Brain sections were immersed in a 1% TTC solution in phosphate-buffered saline (PBS) for 20 min at 37

o

C, and then fixed in a 10% formalin solution [20].

The size of the infarct area was measured by Image- ProPlus 4.0 software (Media Cybernetics, Silver Spring, MD, USA). The volume of infarct lesions was calculated as the infarction area divided by the total section area, and reported as a percentage.

Two-dimensional gel electrophoresis

Our proteomics study was performed according to a previously described method [18]. The right cerebral cortices were excised according to experimental groups and homogenized in buffer solution (8 M urea, 4%

CHAPS, ampholytes, and 40 mM Tris-HCl). After homogenization, the homogenates were centrifuged at 16,000 g for 20 min at 4

o

C and the supernatant was removed. The pellets were dissolved in lysis buffer and the total protein concentration was determined via the Bradford method (Bio-Rad, Hercules, CA, USA) according to the manufacturer’s protocol. Immobilized pH gradient (IPG) gel strips (pH range 4-7 and pH 6-9;

17 cm; Bio-Rad) were incubated in rehydration buffer (8

M urea, 2% CHAPS, 20 mM DTT, 0.5% IPG buffer, and

bromophenol blue) for 13 hrs at room temperature. The

assayed protein samples were loaded on IPG strips using

the provided sample cups , and subjected to first-dimension

isoelectric focusing (IEF) using the Ettan IPGphor 3

system (GE Healthcare, Uppsala, Sweden) with the

following protocol: 250 V (15 min), 10,000 V (3 hours),

and then 10,000-50,000 V. After first-dimension separation,

the strips were incubated in equilibration buffer (6 M

(3)

urea, 30% glycerol, 2% sodium dodecyl sulfate (SDS), 50 mM Tris-HCl, and bromophenol blue) containing DTT and iodoacetamide. The strips were then loaded onto gradient gels (7.5-17.5%) and second-dimension electrophoresis was performed on Protean-II XI electro- phoresis equipment (Bio-Rad) at 5 mA per gel for 2 hours followed by 10 mA per gel at 10

o

C until the bromophenol blue dye migrated off the bottom of the gel.

Silver staining, image analysis and protein identifi- cation

For silver staining, the gels were first immersed in fixation solution (12% acetic acid, 50% methanol) for 2 hour, washed with 50% ethyl alcohol, and treated with 0.2% sodium thiosulfate. The gels were then washed with deionized water, followed by impregnation in a silver solution (0.2% silver nitrate), and were developed in a 0.2% sodium carbonate solution. The gel images were collected using Agfa Arcus 1200

TM

(Agfar-Gevaert, Mortsel, Belgium). The PDQuest 2-D analysis software (Bio-Rad) was used to analyze protein spots on gels after silver staining. Differentially expressed protein spots were determined based on the results of the PDQuest software. The protein spots were then excised and distained. The gel particles were digested in a trypsin- containing buffer. The extracted peptides were analyzed using a Voyager-DETM STR biospectrometry workstation (Applied Biosystem, Forster City, CA, USA) for peptide mass fingerprinting. Database searches were carried out using the MS-Fit and ProFound programs. SWISS- PROT and NCBI were used as the protein sequence databases.

Reverse transcription-PCR amplification

The right cerebral cortices were isolated under sterile conditions, immediately frozen in liquid nitrogen, and stored at −70

o

C. The TRIzol Reagent Kit (Life Technologies, Rockville, MD, USA) was used for extraction of total RNA according to the manufacturer’s instructions. Total RNA (1 μg) was reverse-transcribed into complementary DNA with a SuperScript III First-Strand Synthesis System (Invitrogen, Carlsbad, CA, USA) following the manufacturer’s instructions. The reverse transcription step was carried out at 42

o

C for 30 min, the inactivation of reverse transcriptase at 95

o

C for 5 min, followed by cooling down of the samples at 4

o

C for 5 min. The

primer sequences of DLP-1 were: 5'-TCACCAAAGAT GGTGCTCCCGGAT-3' (forward primer), 5'-AATTAC AGTACACAGGAA-3' (reverse primer). The primer sequences of actin were: 5'-GGGTCAGAAGGACTCC TACG-3' (forward primer), and 5'-GGTCTCAAACATG ATCTGGG-3' (reverse primer). The reverse-transcribed cDNA was used as a template for PCR amplification.

The reaction conditions for PCR were as follows: an initial step of 94

o

C for 5 min; 94

o

C for 30 sec, 54

o

C for 30 sec, and 72

o

C for 1 min, repeated for 30 cycles; and a final extension at 72

o

C for 10 min. The PCR products were loaded on 1% agarose gels, and the PCR product bands were visualized under ultraviolet light.

Western blot analysis

Western blot analysis was performed as previously described [18]. Briefly, the right cerebral cortices were dissolved and homogenized in lysis buffer (1 M Tris- HCI, 5 M sodium chloride, 0.5% sodium deoxycholate, 10% sodium dodecyl sulfate, 1% sodium azide, and 10%

NP-40) containing 200 μM phenylmethylsulfonyl fluoride as a protein inhibitor. After sonication, homogenates were separated by centrifugation at 15,000 g for 20 min at 4

o

C, and the supernatants were harvested for further process. A bicinchoninic acid kit (Pierce, Rockford, IL, USA) was used for the measurement of protein concentration according to the manufacturer’s protocols.

An equal amount of total protein (30 μg) from each sample was mixed with the loading buffer, boiled for 5 min, cooled down, and loaded onto a 10% SDS- polyacrylamide gel, where electrophoresis was carried out. The proteins were then transferred to polyvinylidene fluoride membranes (Millipore, Billerica, MA, USA).

The membranes were incubated with 5% non-fat dry

milk for 1 hour at room temperature to minimize non-

specific antibody binding, washed in Tris-buffered saline

containing 0.1% Tween-20 (TBST), and then incubated

with either an anti-DLP-1 antibody (diluted 1:1,000; BD

Biosciences, San Jose, CA, USA) or an anti- β-actin

(diluted 1:1,000; Santa Cruz Biotechnology, Santa Cruz,

CA, USA) overnight at 4

o

C. After washing in TBST, the

membranes were reacted with horseradish perxoxidase-

conjugated goat anti-rabbit IgG (1:5,000; Pierce). The

enhanced chemiluminescence Western blot analysis

system (Amersham Pharmacia Biotech, Piscataway, NJ,

USA) was used according to the manufacturer’s manual

for the detection of immunoreactive bands.

(4)

Data analysis

The experimental data are expressed as mean±SEM.

The intensity analysis was carried out using the SigmaGel 1.0 (Jandel Scientific, San Rafael, CA, USA) and SigmaPlot 4.0 (SPSS Inc., Point Richmond, CA, USA) programs. The relative expression levels of each group were normalized to that of the non-diabetic+sham group. The differences among various experimental groups were analyzed via two-way analysis of variance followed by post-hoc Scheffe’s test. A P value of <0.05 was considered statistically significant.

Results

We monitored the increase in blood glucose levels and corresponding decrease in body weight in animals that with streptozotocin-induced diabetes. Blood glucose levels were 102.5±2.5 mg/dL in non-diabetic animals and 343.7±24.8 mg/dL in diabetic animals. The mean body weight was 327.2±22.5 g in non-diabetic animals and 203.6±17.8 g in diabetic animals. We examined the infarct volume following MCAO in animals with hyper- glycemia and those without. Hyperglycemic animals exhibited more serious damage and an increased infarct volume following MCAO compared to non-diabetic animals. The average size of infarct was 28.25±3.35%

and 35.75±3.35% of the total section size in non- diabetic+MCAO animals and diabetic+MCAO animals, respectively (Supplementary data).

The results of the proteomic analysis showed decreases

in levels of DLP-1 in the cerebral cortex of MCAO animals when compared with control animals. We also found a more severe decrease in levels of DLP-1 in MCAO animals with hyperglycemia compared to MCAO animals without hyperglycemia. The peptide mass and sequence of DLP-1 were 14/90 and 21%, respectively.

However, DLP-1 expression was similar between sham operated animals with hyperglycemia and sham operated animals without hyperglycemia. DLP-1 expression levels are reported as a ratio relative to that of non-diabetic+

sham animal. DLP-1 expression levels were 0.67±0.04 in non-diabetic+MCAO animals and 0.53±0.03 in diabetic +MCAO animals, respectively (Figure 1). Reverse- transcription PCR and Western blot analyses also demonstrated a severe decrease in DLP-1 expression in diabetic+MCAO animals when compared with controls.

Transcript levels of DLP-1 were 0.78±0.03 and 0.15±

0.02 in non-diabetic+MCAO animals and diabetic+

MCAO animals, respectively (Figure 2). Moreover, DLP-1 protein levels were 0.69±0.03 and 0.43±0.04 in non-diabetic+MCAO animals and diabetic+MCAO animals, respectively (Figure 3).

Discussion

This study confirmed that hyperglycemia leads to more serious brain damage following cerebral ischemic injury compared to a normal, non-hyperglycemic state.

Our results are consistent with the results of previous studies [21,22]. Moreover, we identified a decrease in

Figure 1. Two-dimensional SDS-PAGE analysis of dynamin-like protein 1 (DLP-1) in the cerebral cortex of non-diabetic+sham animals, diabetic+sham animals, non-diabetic+middle cerebral artery occlusion (MCAO) animals, and diabetic+MCAO animals.

Circles indicate DLP-1 protein spots. The intensity of spots was measured using PDQuest software. The spot intensities are

reported as a ratio relative to normal+sham control animals. Data are shown as mean±SEM. *P<0.05. (vs. non-diabetic+sham).

(5)

DLP-1 protein levels in MCAO-injured animals with hyperglycemia compared to MCAO-injured animals without hyperglycemia. Oxidative stress leads to impaired mitochondrial function and neuropathological changes in diabetic conditions. Although the pathogenesis of diabetes mellitus is complex and not fully understood, hyper- glycemia induces oxidative stress, nerve hypoxia and ischemia, and growth factor deficiency [23-25]. Moreover, the increased generation of reactive oxygen species in hyperglycemic conditions can change mitochondrial morphology [26].

We recently reported a decrease in DLP-1 protein expression levels in cerebral ischemia following MCAO.

Moreover, in an in vitro study, we confirmed the down- regulation of this protein in glutamate-exposed hippo-

campal neurons. DLP-1 is involved in outer mitochondrial membrane fission, helps maintain mitochondrial morphology, and regulates apoptotic cell death [27,28].

Mitochondria are highly dynamic organelles that mediate cellular responses to stress and constantly undergo fission and fusion. Mitochondrial fusion and fission are critical processes for the maintenance of mitochondrial function and morphology. It has been reported previously that DLP-1 mediates the mitochondrial fission process [29]. Thus, it is thought that downregulation of DLP-1 can cause neuronal cell death and dysfunction in focal cerebral ischemia. Here, a proteomics approach identified a severe decrease in DLP-1 expression under hyper- glycemic conditions when combined with ischemic brain injury. Moreover, reverse-transcription PCR and

Figure 2. Reverse transcription PCR of DLP-1 in the cerebral cortex using RNA isolated from non-diabetic+sham animals, diabetic+sham animals, non-diabetic+MCAO animals, and diabetic+MCAO animals. The densitometric analysis is presented as the ratio of DLP-1 intensity to actin intensity. Data ( n=5) are presented as mean±SEM. *P<0.05.

Figure 3. Western blot analysis of DLP-1 in the cerebral cortex of non-diabetic+sham animals, diabetic+sham animals, non-

diabetic+MCAO animals, and diabetic+MCAO animals. Densitometric analysis is presented as a ratio of given protein intensities to

actin intensities. Molecular weight markers (kDa) are depicted on the left. Data (n=5) are shown as mean±SEM. *P<0.05.

(6)

Western blot analyses clearly showed more a serious decrease in DLP-1 expression in hyperglycemic animals with cerebral ischemia when compared with non-hyper- glycemic animals with cerebral ischemia. Hyperglycemia alone, without brain ischemic injury, did not decrease DLP-1 expression levels. A significant decrease in DLP- 1 expression most likely leads to the dysregulation of mitochondrial fission and fusion, and consequently induces neuronal damage and disorder.

Hyperglycemia enhances DNA fragmentation, activates cell death pathways, and causes mitochondrial swelling after transient focal cerebral ischemia [30-32]. Oxidative stress is thought to be one cause of neurodegenerative diseases, including cerebral ischemia and Parkinson’s disease. Oxidative stress induces the increase of mito- chondrial membrane permeability, energy metabolism disorder, and consequently apoptotic cell death [33].

This imbalance in mitochondrial dynamics causes neuro- degenerative diseases [29,34]. Patients with neuro- degenerative diseases often exhibit impaired mitochondrial dynamics, including disturbances in shape, size, fission- fusion processes, and distribution [34]. Hyperglycemia changes mitochondrial fission and fusion proteins in cerebral ischemia and reperfusion [35]. Moreover, DLP- 1 depletion leads to serious brain hypoplasia and neuronal cell death in DLP-1 knockout mice [16,17].

The maintenance of mitochondrial function is a critical factor in the health of neurons. Decreases in DLP-1 expression lead to mitochondrial dysfunction and finally induce apoptotic cell death. In this study, we confirmed that diabetes leads to heightened brain damage following MCAO injury. Additionally, hyperglycemia induces a more severe reduction of DLP-1 during MCAO injury compared to a non-hyperglycemic condition. The reduction of DLP-1 indicates that there may be underlying neuronal cell damage and disorder. Thus, our findings suggest that the severe decrease in DLP-1 expression in focal cerebral ischemia seen with hyperglycemic conditions exacerbates brain damage when compared to the damage associated with focal cerebral ischemia under non-hyperglycemic conditions.

Acknowledgments

This research was supported by the National Research Foundation of Korea (NRF) grant funded by the Korea government (MEST)(NRF-2015R1D1A1A01058270).

Conflict of interests The authors declare that there is no financial conflict of interests to publish these results.

References

1. Siniscalchi A, Gallelli L, Malferrari G, Pirritano D, Serra R, Santangelo E, De Sarro G. Cerebral stroke injury: the role of cytokines and brain inflammation. J Basic Clin Physiol Pharmacol 2014; 25(2): 131-137.

2. Doi Y, Ninomiya T, Hata J, Fukuhara M, Yonemoto K, Iwase M, Iida M, Kiyohara Y. Impact of glucose tolerance status on development of ischemic stroke and coronary heart disease in a general Japanese population: the Hisayama study. Stroke 2010;

41(2): 203-209.

3. Bruno A, Liebeskind D, Hao Q, Raychev R; UCLA Stroke Investigators. Diabetes mellitus, acute hyperglycemia, and ischemic stroke. Curr Treat Options Neurol 2010; 12(6): 492-503.

4. Widmer H, Abiko H, Faden AI, James TL, Weinstein PR. Effects of hyperglycemia on the time course of changes in energy metabolism and pH during global cerebral ischemia and reperfusion in rats: correlation of 1H and 31P NMR spectroscopy with fatty acid and excitatory amino acid levels. J Cereb Blood Flow Metab 1992; 12(3): 456-468.

5. Dietrich WD, Alonso O, Busto R. Moderate hyperglycemia worsens acute blood-brain barrier injury after forebrain ischemia in rats. Stroke 1993; 24(1): 111-116.

6. Folbergrová J, Memezawa H, Smith ML, Siesjö BK. Focal and perifocal changes in tissue energy state during middle cerebral artery occlusion in normo- and hyperglycemic rats. J Cereb Blood Flow Metab 1992; 12(1): 25-33.

7. Gentile NT, Seftchick MW, Huynh T, Kruus LK, Gaughan J.

Decreased mortality by normalizing blood glucose after acute ischemic stroke. Acad Emerg Med 2006; 13(2): 174-180.

8. Sims NR, Muyderman H. Mitochondria, oxidative metabolism and cell death in stroke. Biochim Biophys Acta 2010; 1802(1):

80-91.

9. Starkov AA, Chinopoulos C, Fiskum G. Mitochondrial calcium and oxidative stress as mediators of ischemic brain injury. Cell Calcium 2004; 36(3-4): 257-264.

10. Verstreken P, Ly CV, Venken KJ, Koh TW, Zhou Y, Bellen HJ.

Synaptic mitochondria are critical for mobilization of reserve pool vesicles at Drosophila neuromuscular junctions. Neuron 2005;

47(3): 365-378.

11. Westermann B. Mitochondrial fusion and fission in cell life and death. Nat Rev Mol Cell Biol 2010; 11(12): 872-884.

12. Palmer CS, Osellame LD, Stojanovski D, Ryan MT. The regulation of mitochondrial morphology: intricate mechanisms and dynamic machinery. Cell Signal 2011; 23(10): 1534-1545.

13. Shirendeb U, Reddy AP, Manczak M, Calkins MJ, Mao P, Tagle DA, Reddy PH. Abnormal mitochondrial dynamics, mitochondrial loss and mutant huntingtin oligomers in Huntington’s disease:

implications for selective neuronal damage. Hum Mol Genet 2011; 20(7): 1438-1455.

14. Swerdlow RH. The neurodegenerative mitochondriopathies. J Alzheimers Dis 2009; 17(4): 737-751

15. Li H, Chen Y, Jones AF, Sanger RH, Collis LP, Flannery R, McNay EC, Yu T, Schwarzenbacher R, Bossy B, Bossy-Wetzel E, Bennett MV, Pypaert M, Hickman JA, Smith PJ, Hardwick JM, Jonas EA. Bcl-xL induces Drp1-dependent synapse formation in cultured hippocampal neurons. Proc Natl Acad Sci U S A 2008;

105(6): 2169-2174.

16. Ishihara N, Nomura M, Jofuku A, Kato H, Suzuki SO, Masuda K,

Otera H, Nakanishi Y, Nonaka I, Goto Y, Taguchi N, Morinaga H,

Maeda M, Takayanagi R, Yokota S, Mihara K. Mitochondrial

fission factor Drp1 is essential for embryonic development and

(7)

synapse formation in mice. Nat Cell Biol 2009; 11(8): 958-966.

17. Wakabayashi J, Zhang Z, Wakabayashi N, Tamura Y, Fukaya M, Kensler TW, Iijima M, Sesaki H. The dynamin-related GTPase Drp1 is required for embryonic and brain development in mice. J Cell Biol 2009; 186(6): 805-816.

18. Jang AR, Koh PO. Ischemic brain injury decreases dynamin-like protein 1 expression in a middle cerebral artery occlusion animal model and glutamate-exposed HT22 cells. Lab Anim Res 2016;

32(4): 194-199.

19. Longa EZ, Weinstein PR, Carlson S, Cummins R. Reversible middle cerebral artery occlusion without craniectomy in rats.

Stroke 1989; 20(1): 84-91.

20. Jeon SJ, Sung JH, Koh PO. Hyperglycemia decreases expression of 14-3-3 proteins in an animal model of stroke. Neurosci Lett 2016; 626: 13-18.

21. Li ZG, Britton M, Sima AA, Dunbar JC. Diabetes enhances apoptosis induced by cerebral ischemia. Life Sci 2004; 76(3):

249-262.

22. Rizk NN, Rafols J, Dunbar JC. Cerebral ischemia induced apoptosis and necrosis in normal and diabetic rats. Brain Res 2005; 1053(1-2): 1-9.

23. Low PA, Lagerlund TD, McManis PG. Nerve blood flow and oxygen delivery in normal, diabetic, and ischemic neuropathy. Int Rev Neurobiol 1989; 31: 355-438.

24. Russell JW, Sullivan KA, Windebank AJ, Herrmann DN, Feldman EL. Neurons undergo apoptosis in animal and cell culture models of diabetes. Neurobiol Dis 1999; 6(5): 347-363.

25. Cameron NE, Cotter MA. Effects of evening primrose oil treatment on sciatic nerve blood flow and endoneurial oxygen tension in streptozotocin-diabetic rats. Acta Diabetol 1994; 31(4):

220-225.

26. Yu T, Robotham JL, Yoon Y. Increased production of reactive oxygen species in hyperglycemic conditions requires dynamic

change of mitochondrial morphology. Proc Natl Acad Sci U S A 2006; 103(8): 2653-2658.

27. Pitts KR, Yoon Y, Krueger EW, McNiven MA. The dynamin-like protein DLP1 is essential for normal distribution and morphology of the endoplasmic reticulum and mitochondria in mammalian cells. Mol Biol Cell 1999; 10(12): 4403-4417.

28. Smirnova E, Shurland DL, Ryazantsev SN, van der Bliek AM. A human dynamin-related protein controls the distribution of mitochondria. J Cell Biol 1998; 143(2): 351-358.

29. Chen H, Chan DC. Mitochondrial dynamics--fusion, fission, movement, and mitophagy--in neurodegenerative diseases. Hum Mol Genet 2009; 18: 169-176.

30. Ding C, He Q, Li PA. Activation of cell death pathway after a brief period of global ischemia in diabetic and non-diabetic animals. Exp Neurol 2004; 188(2): 421-429.

31. Muranyi M, Fujioka M, He Q, Han A, Yong G, Csiszar K, Li PA.

Diabetes activates cell death pathway after transient focal cerebral ischemia. Diabetes 2003; 52(2): 481-486.

32. Muranyi M, Ding C, He Q, Lin Y, Li PA. Streptozotocin-induced diabetes causes astrocyte death after ischemia and reperfusion injury. Diabetes 2006; 55(2): 349-355.

33. Tiwari BS, Belenghi B, Levine A. Oxidative stress increased respiration and generation of reactive oxygen species, resulting in ATP depletion, opening of mitochondrial permeability transition, and programmed cell death. Plant Physiol 2002; 128(4): 1271- 1281.

34. Johri A, Beal MF. Mitochondrial dysfunction in neurodegenerative diseases. J Pharmacol Exp Ther 2012; 342(3): 619-630.

35. Kumari S, Anderson L, Farmer S, Mehta SL, Li PA. Hyperglycemia alters mitochondrial fission and fusion proteins in mice subjected to cerebral ischemia and reperfusion. Transl Stroke Res 2012;

3(2): 296-304.

수치

Figure 1. Two-dimensional SDS-PAGE analysis of dynamin-like protein 1 (DLP-1) in the cerebral cortex of non-diabetic+sham animals, diabetic+sham animals, non-diabetic+middle cerebral artery occlusion (MCAO) animals, and diabetic+MCAO animals.
Figure 3. Western blot analysis of DLP-1 in the cerebral cortex of non-diabetic+sham animals, diabetic+sham animals, non- non-diabetic+MCAO animals, and non-diabetic+MCAO animals

참조

관련 문서

Results indicated that the agmatine has a ischemic preconditioning decreased the expression of nNOS in the cerebral cortex and striatum at 1 hr and 23 hr

We observed that the functional outcomes were improved at days 7 and 14 after middle cerebral artery oc- clusion, and GLT-1 activity was increased in the physical

JVS Original Article J Vet Sci 2015, 16(1), 75 85ㆍhttp //dx doi org/10 4142/jvs 2015 16 1 75 Canine model of ischemic stroke with permanent middle cerebral artery occlusion

In patients with a stenosis of middle cerebral artery (MCA), visualization of MCA on MRA by using three dimensional (3D)- time of flight (TOF) technique has been reported to be