INTRODUCTION
Magnetic resonance angiography (MRA) has developed dra- matically over the last quarter century, and has played a par- ticularly important role as a diagnostic tool for conditions of main intracranial arteries, including cerebral aneurysm1 and arterial steno-occlusive disease2 among others. The greatest benefit of MRA is its minimal invasiveness, namely its ability
to precisely delineate intracranial arteries without puncture of the artery or administration of contrast media.
In patients with a stenosis of middle cerebral artery (MCA), visualization of MCA on MRA by using three dimensional (3D)- time of flight (TOF) technique has been reported to be associ- ated with stroke recurrence3 and the distal/proximal signal in- tensity ratio of the MCA stenosis is also shown to predict stroke risk,4 indicating that signal intensity of intracranial arteries has a profound relation with stroke occurrence: Signal intensity loss of intracranial arteries on TOF-MRA signifies relevant ar- terial occlusion, which is considered to be a critical situation in terms of cerebral blood flow (CBF) and metabolism. Occasion- ally, however, limited number of cases without signal intensity of MCA on TOF-MRA are encountered: They show anterograde delineation on angiography using contrast media, such as CT angiography (CTA) or conventional angiography. Although this likely attributes to reduced arterial flow velocity,5 a conclusive understanding has yet to be obtained.
Received: January 16, 2017 Revised: August 13, 2017 Accepted: September 9, 2017
Corresponding author: Dr. Michiya Igase, Department of Geriatric Medicine and Neurology, Ehime University, 454 Shitsukawa, Toon, Ehime 791-0295, Japan.
Tel: 81-89-960-5851, Fax: 81-89-960-5852, E-mail: [email protected]
•The authors have no financial conflicts of interest.
© Copyright: Yonsei University College of Medicine 2018
This is an Open Access article distributed under the terms of the Creative Com- mons Attribution Non-Commercial License (http://creativecommons.org/licenses/
by-nc/4.0) which permits unrestricted non-commercial use, distribution, and repro- duction in any medium, provided the original work is properly cited.
Mismatch between TOF MR Angiography and CT Angiography of the Middle Cerebral Artery may be a Critical Sign in Cerebrovascular Dynamics
Keiji Igase1, Michiya Igase2, Ichiro Matsubara1, and Kazuhiko Sadamoto1
1Department of Neurosurgery, Washokai Sadamoto Hospital, Ehime;
2Department of Geriatric Medicine and Neurology, Ehime University, Ehime, Japan.
Purpose: Although time-of-flight (TOF)-magnetic resonance angiography (MRA) can clearly depict intracranial arteries, the arteri- al flow of middle cerebral artery (MCA) is occasionally not detected. We evaluated this phenomenon with reference to cerebrovas- cular dynamics.
Materials and Methods: Seventeen patients with suspected occlusion of MCA or internal carotid artery on TOF-MRA were en- rolled. All patients underwent CT angiography (CTA) and quantitative cerebral blood flow (CBF) examination for measurement of resting CBF and cerebrovascular reactivity (CVR). Depending on appearance, patients were categorized into three groups.
Group A (n=6) had MCA delineation on both MRA and CTA, while groups B (n=6) and C (n=5) had no signal on MRA, but Group B had a MCA delineation on CTA.
Results: No significant difference between resting CBF and CBF after the administration of acetazolamide was seen among 3 groups. In contrast, mean CVR in group B was -19.7±18.1%, which was significantly lower than group A [36.4±21.7% (p<0.05)], but not than group C (21.4±35.2%). Furthermore, all patients in group B displayed a so-called steal phenomenon.
Conclusion: This study is the first to show that visualization of MCA on TOF-MRA closely correlates with CVR, and that a vascular pattern showing no MCA signal intensity on MRA but with MCA delineation on CTA indicates a critical cerebrovascular condition.
Key Words: Signal loss, TOF-MRA, occlusion, cerebral artery, cerebral blood flow
pISSN: 0513-5796 · eISSN: 1976-2437 Yonsei Med J 2018 Jan;59(1):80-84
https://doi.org/10.3349/ymj.2018.59.1.80
Here, we evaluated the association between visualization of MCA on TOF-MRA or CTA and cerebrovascular conditions us- ing single photon emission tomography (SPECT).
MATERIALS AND METHODS
Seventeen patients suspected of having occlusion of MCA or internal cerebral artery (ICA) on TOF-MRA were enrolled. As for ICA occlusion, because it was diagnosed with TOF-MRA, an occlusion at the intracranial portion of ICA was selected and all cases with ICA occlusion revealed no or misery flow of ICA from carotid bifurcation in the neck level. All patients un- derwent CTA and quantitative CBF examination. Although both symptomatic and asymptomatic cases were included, CBF examination was performed more than one month after onset to exclude fluctuation in CBF values, particularly in symptom- atic cases. Furthermore, no cases showed recanalization of ICA and MCA on TOF-MRA performed one month after the onset or first examination.
Six of 17 cases had a normal MCA signal in the lesion side due to feeding by collateral supply and revealed ICA occlusion and ipsilateral MCA fed by anterior or posterior communicat- ing artery. On the other hand, the remaining 11 cases had a sig-
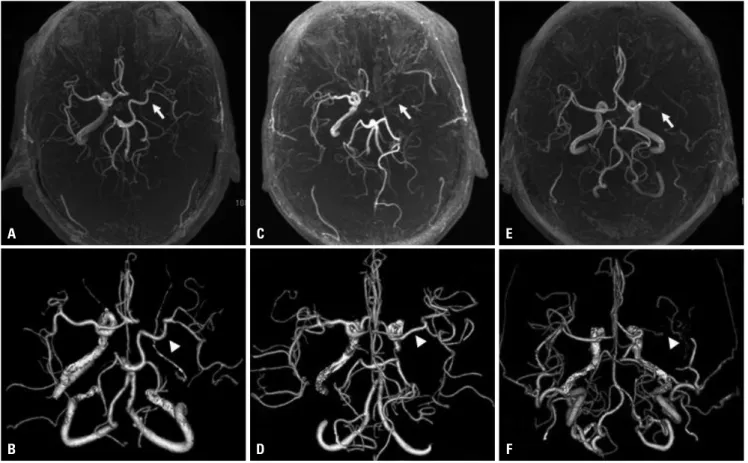
nal loss of MCA on TOF-MRA, whereas CTA could delineate the anterograde delineation of MCA in 6 cases, but not in re- maining 5 cases. We categorized all cases into three groups according to their visualization on TOF-MRA and CTA: group A had a MCA signal on TOF-MRA and an anterograde MCA delineation on CTA (Fig. 1A and B); group B had no MCA sig- nal and a MCA delineation on CTA (Fig. 1C and D); and group C had both no signal and delineation of MCA on both modali- ties (Fig. 1E and F). Resting CBF and CBF obtained after acet- azolamide administration were measured in all groups, and cerebrovascular reactivity (CVR) was calculated. Case sum- mary is presented in Table 1, showing mean age of 69.7±6.9 years old, male to female ratio of 8:9, and only 5 cases of symp- tomatic cases due to acute infarction.
TOF-MRA was conducted with a 3 tesla MRI (SIGNA HDxt:
GE Healthcare, Connecticut, UK) and performed with the fol- lowing sequence parameters: repetition time/echo time=26.0/
2.7 msec; scan time, 239 seconds; section thickness, 1.2 mm;
flip angle, 20°; field of view, 210×210; matrix, 512×224; and voxel volume, 0.43 mm3.
CTA was performed with a 64-row CT (LightSpeed VCT; GE Healthcare). After a bolus injection (50 mL) of iodine contrast media (300 mg/mL), helical CT scanning was performed using the Smart prep procedure, where the scanning was started af-
Fig. 1. Categorized 3 groups corresponding to their visualization on TOF-MRA (A, C, and E) and CTA (B, D, and F) are shown. Group A (A and B) had a MCA signal on TOF-MRA (arrow) and an anterograde MCA delineation on CTA (arrowhead); group B (C and D) had no MCA signal (arrow) and MCA delineation (arrowhead); and group C (E and F) had no MCA signal (arrow) and no MCA delineation (arrowhead) on both modalities. TOF-MRA, time- of-flight-magnetic resonance angiography; CTA, CT angiography, MCA, middle cerebral artery.
B A
D C
F E
ter CT value at the carotid level reached sufficient level. All row data were calculated on the console CT system and transferred to the workstation to create clear 3D-CTA images.
CBF analysis was performed with a SPECT system (Infinia3;
GE Healthcare). Quantitative CBF studies were acquired by N- isopropyl 123I P-iodoamphetamine (IMP) SPECT with the dual table autoradiography procedure,6 in which the Quantitative SPECT package (Nihon Medi-Physics, Tokyo, Japan) was used for calculation of CBF (mL/100 g/min) at rest (rCBF) and after acetazolamide administration (aCBF). On two slices acquired by QSPECT which included the main areas of the MCA, the mean value between them was used as a CBF value in the MCA area, and CVR was calculated using this formula: CVR=(aCBF- rCBF)/rCBF (%).
CBF values and CVR were compared among groups using the analysis of variance (ANOVA) followed by post hoc analy- sis (Bonferroni correction), and unpaired Student’s t-test was applied in comparison between rCBF and aCBF of each group.
All analyses were conducted using IBM SPSS statistics soft- ware (version 21, IBM Corp., Armonk, NY, USA). A p<0.05 was considered statistically significant.
Written informed consent for all procedures was obtained from all participants. This cross-sectional investigation was approved by the Ethics Committee of the Ehime University Graduate School of Medicine IRB (2017040401). All studies were performed in accordance with relevant guidelines and regulations.
RESULTS
CBF maps after acetazolamide administration in each group, which correspond to cases in Fig. 1, are shown in Fig. 2. The figure shows that both group A and C have almost sufficient vascular response, whereas group B has miserable response in terms of CVR.
Mean rCBF values were 30.8±3.7 mL/100 g/min in group A, 32.4±7.0 in group B, and 39.1±11.7 in group C, with no signifi- cant difference among them (Fig. 3, left), while mean aCBF values were 39.3±9.1, 25.4±5.7, and 50.0±23.4 mL/100 g/min, respectively (Fig. 3, right) with no significant difference among them by using ANOVA. Meanwhile, evaluation of CBF changes before and after acetazolamide administration showed a sig- nificant reduction in aCBF compared with rCBF in group B only (p<0.05), with the other two groups showing no signifi- cant changes between stages.
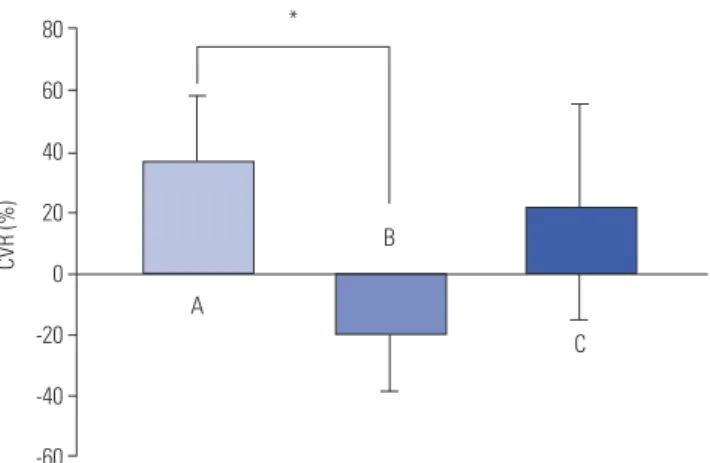
With regard to the analysis of CVR, mean CVR was 36.4±21.7%
in group A, -19.7±18.1% in group B, and 21.4±35.2% in group C, respectively, and ANOVA revealed a significant difference among 3 groups, with differences being significant between groups A and B (p<0.01). CVR was negative only in group B, showing the steal phenomenon in other words (Fig. 4).
DISCUSSION
In this study, we found various patterns in the visualization of the MCA on TOF-MRA and CTA. Among these, our group B, Table 1. Case Summary of All 17 Cases
Group No. Age Sex Disease
Symptoms Ipsilateral infarction
MRA CTA
Side Lesion (-):0 (+):1 (-):0 (+):1
A
1 65 F R ICAo Headache (-) 1 1
2 71 M L ICAo Incidental (-) 1 1
3 62 M L ICAo Rt.hemiparesis (+) 1 1
4 71 M R ICAo Incidental (-) 1 1
5 79 F R ICAo Dysarthria (+) 1 1
6 60 M R ICAo Incidental (-) 1 1
B
7 66 F R MCAo Dizzyness (-) 0 1
8 77 F R ICAo Incidental (-) 0 1
9 76 M R MCAo Lt. hemiparesis (+) 0 1
10 70 M L ICAo Dizzyness (-) 0 1
11 81 F R ICAo Incidental (-) 0 1
12 68 M L MCAo Dizzyness (+) 0 1
C
13 63 F L MCAo Headache (-) 0 0
14 65 F R MCAo Dizzyness (-) 0 0
15 71 F L MCAo Incidental (-) 0 0
16 80 F L ICAo Incidental (-) 0 0
17 60 M L MCAo Dysarthria (+) 0 0
69.7±6.9 M:F=8:9 R:L=9:8 ICAo=10, MCAo=7 (+):(-)=5:12
MRA, magnetic resonance angiography; CTA, CT angiography; ICAo, internal carotid artery occlusion; MCAo, middle cerebral artery occlusion.
In the colum of MRA and CTA, (+) and (-) means delineation and no delineation of middle cerebral artery, respectively.
which had no MCA flow on TOF-MRA but ordinary MCA de- lineation on CTA, represented a critical condition in terms of cerebrovascular dynamics, and group C, which had no MCA flow on TOF-MRA and no MCA delineation on CTA, was also suspeted to be in a severe CBF condition. However, among 5 cases of group C there was only one case of infarction, implying that these cases might have developed a collateral flow like a leptomeningeal anastomosis for longer period, to maintain CBF equilibrium.
Attenuation of signal intensity in the cerebral main artery on TOF-MRA is generally regarded to be due to reduced arterial flow velocity in that vessel.5 Although several causes of artifacts causing signal defects have been documented, such as flow turbulence, it seems quite likely that the invisible flow in the long course of the main artery is closely associated with slow
Fig. 2. CBF maps after acetazolamide administration in each group are depicted, coinciding with those of Fig. 1, where group A revealing almost suffi- cient vascular response in the lesion side, whereas group C showing partly decreased in comparison with contralateral side. Note that CBF maps of group B revealed intensely decreased vascular response in comparison with other 2 groups. CBF, cerebral blood flow.
A B C
Fig. 3. Mean CBF values of 3 categorized groups (A, B, and C) at rest and after acetazolamide administration were revealed in left and right, respectively. There were no significant differences in both rest and ac- etazolamide challenge (left and right) among all groups. In respect to CBF values after acetazolamide challenge (right), only group B had sig- nificant difference compared with the value before acetazolamide ad- ministration (*p<0.05). CBF, cerebral blood flow.
80 70 60 50 40 30 20 10 0
CBF (mL/100 g/min)
A B C A B C
Acetazolamide Rest
*
Fig. 4. Mean CVRs in all categorized groups (A, B, and C) are shown.
Mean CVR in group B was significantly lower than that in group A (*p<0.05); note that only the mean CVR in group B showed a negative value, which is regarded as a steal phenomenon. CVR: cerebrovascular response.
80
60
40
20
0
-20
-40
-60
CVR (%)
A
B
C
*
flow velocity. Furthermore, Liebeskind, et al.4 suggested the cor- relation of signal intensity ratio of distal/proximal MCA steno- sis with stroke risk, which might be partly attributable to the slow flow in the stenotic lesion.
Hirooka, et al.7 showed that grading of the visualization of MCA signal on single slab TOF-MRA was significantly corre- lated with the CVR in the cerebral hemispheres. Our six cases in group B are similar to the grade D used in their study. Given their conclusion and data in the above study, the loss of flow signal on TOF-MRA may reflect a reduced CVR, and the steal phenomenon in particular.
Since most of our cases were in subacute and chronic oc- clusion of the ICA or MCA, i.e. cases with infarction were 5/17 (29.4%), it is highly likely that either or both collateral and cross flow had consistently developed, and that hemispherical CBF had thereby reached a steady state. A previous study on symp- tomatic cases with unilateral occlusion of the ICA demonstrat-
ed the presence of regional CBF fluctuation and a significant difference in CBF value, depending on the direction of collater- al flow, such as anterior or posterior.8 Symptomatic cases with an intensely reduced CBF, CVR, or both require external and internal carotid artery bypass. Accordingly, therefore, the next step in our research is to apply this method to patients with acute stroke having major cerebral artery occlusion. Among less invasive methods for the evaluation of collateral flow in patients with unilateral ICA occlusion, the combination of two- dimensional-MRA and transcranial Doppler ultrasound ap- pears to be a good diagnostic tool as conventional angiogra- phy,9 and combination of multiple modalities would allow the assessment of not only CBF and CVR but also a collateral flow in the acute stage.
Regarding the effect of aging on the visibility of intracranial arteries on MRA, Kusunoki, et al.10 reported that the visibility of cerebral main arteries, which are categorized as ICA, MCA (M1 segment), and distal MCA, was significantly reduced in an age- dependent manner, suggesting that our present results require validation in a wider range of cases to exclude age-related factors.
As an advanced procedure for the delineation of the cere- bral main arteries, contrast enhanced 3D-TOF MRA is a prom- ising tool. Comparison of pre- and postcontrast MRA appears to be able to detect pseudo-occlusion cases in the acute phase of occlusion of a cerebral main artery.11 The addition of this con- trast MRA after plain TOF-MRA might allow to differentiate cases with severely impacted cerebral dynamics even in the acute stage of a major arterial occlusion.
In conclusion, albeit there is a limitation of small number of cases, this study has shown that the visualization of the cere- bral main artery on TOF-MRA may be closely associated with CVR, and it is quite possible that a pattern showing no MCA signal intensity on TOF-MRA but with MCA delineation on CTA indicates a dangerous situation in terms of cerebrovascu- lar dynamics.
ACKNOWLEDGEMENTS
We express our deepest appreciation to Mr. Fuminori Shino- zuka, and also appreciate all members of the MRI Laboratory and the Department of Radiology at Wahokai Sadamoto Hos- pital for their technical assistance.
ORCID
Keiji Igase https://orcid.org/0000-0002-9533-7815 Michiya Igase https://orcid.org/0000-0003-2545-4124
REFERENCES
1. Igase K, Matsubara I, Igase M, Miyazaki H, Sadamoto K. Initial experience in evaluating the prevalence of unruptured intracra- nial aneurysms detected on 3-tesla MRI. Cerebrovasc Dis 2012;33:
348-53.
2. Choi CG, Lee DH, Lee JH, Pyun HW, Kang DW, Kwon SU, et al. De- tection of intracranial atherosclerotic steno-occlusive disease with 3D time-of-flight magnetic resonance angiography with sen- sitivity encoding at 3T. AJNR Am J Neuroradiol 2007;28:439-46.
3. Chen H, Li Z, Hong H, Xing S, Liu G, Zhang A, et al. Relationship between visible branch arteries distal to the stenosis on magnetic resonance angiography and stroke recurrence in patients with se- vere middle cerebral artery trunk stenosis: a one-year follow up study. BMC Neurol 2015;15:167.
4. Liebeskind DS, Kosinski AS, Lynn MJ, Scalzo F, Fong AK, Fariborz P, et al. Noninvasive fractional flow on MRA predicts stroke risk of intracranial stenosis. J Neuroimaging 2015;25:87-91.
5. Wilcock DJ, Jaspan T, Worthington BS. Problems and pitfalls of 3-D TOF magnetic resonance angiography of the intracranial cir- culation. Clin Radiol 1995;50:526-32.
6. Kim KM, Watabe H, Hayashi T, Hayashida K, Katafuchi T, Eno- moto N, et al. Quantitative mapping of basal and vasareactive ce- rebral blood flow using split-dose 123I-iodoamphetamine and single photon emission computed tomography. Neuroimage 2006;
33:1126-35.
7. Hirooka R, Ogasawara K, Inoue T, Fujiwara S, Sasaki M, Chida K, et al. Simple assessment of cerebral hemodynamics using single- slab 3D time-of-flight MR angiography in patients with cervical internal carotid artery steno-occlusive diseases: comparison with quantitative perfusion single-photon emission CT. AJNR Am J Neu- roradiol 2009;30:559-63.
8. de Boorder MJ, van der Grond J, van Dongen AJ, Klijn CJ, Jaap Kappelle L, Van Rijk PP, et al. Spect measurements of regional ce- rebral perfusion and carbondioxide reactivity: correlation with ce- rebral collaterals in internal carotid artery occlusive disease. J Neu- rol 2006;253:1285-91.
9. Hendrikse J, Klijn CJ, van Huffelen AC, Kappelle LJ, van der Grond J. Diagnosing cerebral collateral flow patterns: accuracy of non- invasive testing. Cerebrovasc Dis 2008;25:430-7.
10. Kusunoki K, Oka Y, Saito M, Sadamoto K, Sakaki S, Miki H, et al.
Changes in visibility of intracranial arteries on MRA with normal ageing. Neuroradiology 1999;41:813-9.
11. Ishimaru H, Ochi M, Morikawa M, Takahata H, Matsuoka Y, Ko- shiishi T, et al. Accuracy of pre- and postcontrast 3D time-of-flight MR angiography in patients with acute ischemic stroke: correlation with catheter angiography. AJNR Am J Neuroradiol 2007;28:923-6.