HW/SW Co-design of a Visual Driver Drowsiness Detection System
Kok Choong Lai1*, M. L. Dennis Wong2, Syed Zahidul Islam3
1,2,3
Faculty of Engineering, Computing and Science,Swinbume University of Technology,Sarawak, Malaysia
요 약 치명적인 사고를 막기 위해 드라이버 졸음 (DD)를 검출하는 다양한 최근 방법이 제안되고있다. 본 논문은 운전자의 눈에 폐쇄 속도를 모니터링 할 수 있는 기능을 AdaBoost 기반 물체 검출 알고리즘에 적용한 DD 탐지 시스 템 구현에서 하드웨어/소프트웨어 공동 설계 방법을 제안한다. 소프트웨어 구성 요소는 DD 검출 알고리즘 중에서 필요한 기능성을 완전하게 달성하기 위해 전체적인 제어 및 논리 연산을 구현한다. 반면, 본 연구에서는 DD 검출 알고리즘의 중요한 기능은 처리를 가속화하기 위해 맞춤형 하드웨어 구성 요소를 통해 가속된다. 하드웨어/소프트웨 어 아키텍처는 비디오 도터 보드와 알테라 DE2 보드에 구현되었습니다. 제안 된 구현의 성능을 평가하고 몇 가지 최근의 작품을 벤치마킹했다.
Abstract There have been various recent methods proposed in detecting driver drowsiness (DD) to avert fatal accidents. This work proposes a hardware/software (HW/SW) co-design approach in implementation of a DD detection system adapted from an AdaBoost-based object detection algorithm with Haar-like features [1] to monitor driver’s eye closure rate. In this work, critical functions of the DD detection algorithm is accelerated through custom hardware components in order to speed up processing, while the software component implements the overall control and logical operations to achieve the complete functionality required of the DD detection algorithm. The HW/SW architecture was implemented on an Altera DE2 board with a video daughter board. Performance of the proposed implementation was evaluated and benchmarked against some recent works.
Key Words : drowsiness detection, hardware-software co-design, machine vision, FPGA, vehicular safety.
접수일 : 2013년 3월 7일 수정일 : 2013년 4월 16일 게재확정일 : 2013년 5월 8일
*교신저자 : Kok Choong Lai(blau@swinburne.edu.my)
1. Introduction
Driver drowsiness (DD) is one of the leading causes of road accidents in many countries throughout the world. Not only has it caused injuries and deaths, but also resulted in the lost of properties and productivity as well. There are many commercial systems that attempts to mitigate the above problem to a certain extend, such as lane departure warning systems and collision warning systems. However, all these commercial systems have a shortcoming – they generate warnings often after the
driver has already dozed off. More promising systems that directly estimate driver's state of drowsiness, such as systems that monitors the driver's steering response, ECG, head movement, eye closure and movement, yawning etc. shows higher effectiveness in detecting and warning imminent DD. Of all these systems, those that monitor the eye closure rate, such as PERCLOS [2]
is often favoured owing to its non-contact and non-invasive nature.
There are many systems that use PERCLOS as the measure of a DD. The implementations range from
simple edge detection-based systems [3] to complex Hough transform-based systems [4]. However, simple detection systems generally suffered from low-accuracy or robustness. On the other hand, complex systems are not easily adapted onto embedded systems, therefore there is a lack of practicality in real deployment. There are some known works in embedded DD detection systems [5, 6]. However, these systems did not employ complex detection algorithms as described in this work.
In this work, we realized a FPGA-based DD detection system using the object detection algorithm by Viola and Jones [1]. The main motivation behind the choice of this algorithm is due to its high detection rate and fast processing. Furthermore, many prior attempts of this algorithm [7--9] have confirmed the viability of this algorithm for embedded platforms. The proposed system will monitor driver’s eye closure rate, PERCLOS to determine the driver's state of drowsiness. In our design, in an attempt to strike a balance between speed, complexity and cost of the final product, we have opted to adopt a hardware/software (HW/SW) co-design approach: to increase the speed of detection, critical functions of the algorithm were accelerated using custom hardware IPs. Other non-critical functions were carried out by a soft-core Nios II processor.
The remaining of this work is arranged as follows:
Section II provides a quick review of necessary background materials and some related works. The actual design and implementation are then presented in Section III. Following which, we present and benchmark the experimental results against related works in Secion IV. Finally, in Section V, we conclude this work in by highlighting some areas of future extension.
2. Background Review and Related Works
The first half of this section describes briefly the
AdaBoost-based object detection, while the second half summarizes existing visual-based DD detection system.
2.1 AdaBoost-Based Object Detection The Viola-Jones object detection algorithm (c.f. [1]) introduced by classifies objects by using simple Haar-like features as shown in Figure 1, which detect either line or edge features. In essence, the detection is achieved by first individually summing up the pixel values in the white region and the black region, and then calculates the difference of the weighted sum of each of the regions. TheThis set of Haar features were extended in [10], which is the full set of features adopted in OpenCV, a popular computer vision software (C++) library [11].
Next, a weak classifier, one that has low classification accuracy, compares the resultant value to see if it exceeds a pre-defined threshold. If the threshold is exceeded, the weak classifier outputs true, meaning that the line or edge feature exists. A large number of weak classifiers can then be combined to form a strong classifier with high classification accuracy that is able to detect more complicated objects. The selection of features and the training of classifiers are achieved using a variant of AdaBoost, a supervised machine learning algorithm [12].
To detect object of different sizes in an input image, a rectangular mask steps the entire image to generate sub-images called sub-windows. Once the mask completely scans the whole image, it increases its size (aspect ratio is maintained) and scans the entire image again to generate a new set of sub-windows. This process is repeated until the maximum size of the mask is reached. Detection is performed on a sub-window as soon as it is generated.
The cascade structure was introduced by Viola and Jones to achieve rapid processing. This cascade structure consists of a series of strong classifiers called stage classifiers. The idea is to train a cascade that can quickly reject as much negative sub-windows in earlier
stages using simpler classifiers as possible, allowing almost all positive instances to pass to the next stage.
Latter stages of more complex classifiers then process the sub-windows that are more likely to contain the object of interest in order to reduce false positives.
Since many negative sub-windows get rejected early in the stages, are saved and the resultant detection speed is higher.
2.2 Existing Eye-Monitoring Detection Systems There are a large number of eye monitoring-based detection systems [13 – 18] that uses an eye illumination technique [19] to detect driver’s eyes. The technique exploits the ‘red eye’ effect often seen on pictures taken by a camera with flash on. By shining two infrared lights of different direction onto the driver in an alternating fashion, eyes can be detected on the captured images by a bright glow emanating from the pupils of the eyes. While this technique can detect eyes well and operates in low-light conditions, the detection is highly dependent on factors such as the brightness and size of the pupils, face orientation, external illumination interference, distance of the driver from the camera etc. as described by [4].
1. Edge Features
3. Line Features
2. Centre-Surround Features
(a) (b)
(a) (b) (c) (d)
(a)
Fig. 1. Upright Haar-like features used in OpenCV [3].
Other systems that did not employ the IR illumination technique started off with simple image-processing methods such as binarisation [20], eye width and height measurement [21], histograms
[22], edge detection [3, 5, 6] and template matching [3].
Wang and Chin [5] uses grayscale projection, edge detection with Prewitt operator and complexity function for eye detection, while Moreno et al. [6] uses edge filters to highlight the edges of images, and sums up the number of white/black pixels to detect eye regions.
Detection rate were not discussed.
As general processing platforms grew more powerful there are systems that employ more complex features, such as skin colour predicates [23] or skin colour models together with an artificial neural network [24] to detect the eyes. More recent system [4] applies a modified circle Hough transform over the whole image to detect possible candidate regions that contain eyes. The system is complemented by an artificial neural network to classify open or closed eyes. These modern systems exhibit high accuracy. However, all of the abovementioned systems are implemented on a general purpose platform, as opposed to embedded system.
As discussed earlier, there isn’t any embedded DD detection system that uses a robust and high-performing detection algorithm reported to date.
To our knowledge, this work is the first report of an embedded DD detection system that uses the Viola-Jones object detection algorithm.
3. Hardware Implementation
In our work, Altera Quartus II, SOPC Builder, DSP Builder and MATLAB were used to develop the prototype system. The controller for the camera used to capture driver’s eyes, which deals with image data acquisition and color-to-grayscale conversion, is not described here. The prototype system is developed onto Altera DE2 board with Altera Cyclone II 2C35 FPGA.
A video daughter card was used in conjunction with the DE2 board.
As in a typical hardware realization of an algorithm, a compromise between available hardware resources
and processing speed is unavoidable. In our design, we aim to attain as much parallelism as possible with available hardware resources in order to achieve real-time detection. Our implementation follows closely to that of OpenCV.
3.1 Overview of HW/SW Co-Design
Figure 2 shows the overall block diagram of the FPGA implementation. In our implementation, we chose the fast version of Altera Nios II [25] as the processor (soft-core), connected to the memory-mapped system bus known as Avalon Switch Fabric. The reason for the fast version is because we have several components of the detection algorithm running on software; therefore a faster processor allows faster execution of these software components. The eye detection module consists of two IPs, the Integral Image Generator and the Haar Calculator.
FPGA Avalon Switch Fabric (Bus)
Nios II Processor
JTAG Module
SRAM Controller
SRAM (256×16)
Host
Camera Controller SDRAM (1M×16×4 banks)
VGA Out
Camera
Eye Detector Module
Timestamp Timer
Arrow shows direction of data traffic
Fig. 2. Components of the hardware software co-design implementation
Each of them has a separate connection to the system bus. The camera is controlled by the camera controller. The SDRAM controller resides in the camera controller, and stores all captured images from the camera. The camera controller was modified to include an Avalon Memory-Mapped (Avalon-MM) interface [26] to allow system access to the SDRAM.
Wait states were inserted into the camera controller
slave interface in order to maintain high synthesized speed. It takes 4 clock cycles for the processor to read from a new address in SDRAM. Processor instructions and data are stored in SRAM. The timestamp timer is needed for PERCLOS calculations. The alarm module is connected to an alarm-generating device, i.e. buzzer and speaker etc. JTAG is used for software debugging purposes and can be removed without affecting the system.
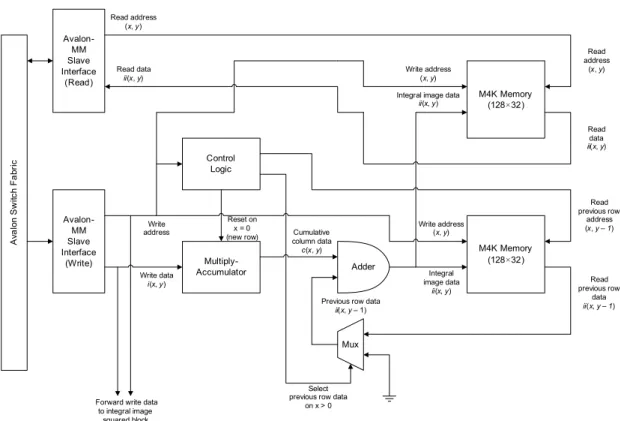
3.2 Hardware Integral Image Generator An integral image is the sum of all pixel values above and to the left, inclusive. Our implementation follows the idea described in [9]. Instead of scaling the sub-window to fit larger Region of Interest (ROI) of the input image, the ROI is scaled to fit a fixed-sized sub-window. Nearest neighbor algorithm was used for scaling. Since the sub-window is fixed in size, there is no need to scale Haar-like features. This saves limited hardware resources, such as memory storage.
Moreover, scaling input images has very little effect on detection rate, as proven by [9].
The integral image(and integral image squared) generator comprises of multiply-accumulators (MAC) and memories (RAM). It generates integral image based on image data inside the sub-window. This method as described in [7] forgoes the use of large storage to store the entire integral image based on a single input image frame. The drawback, however, is that every time a sub-window changes, a new integral image is generated, even if only a few pixels in the sub-window changes (i.e. steps to the right). The result is excessive repetitive computation, but is warranted due to the limited embedded memories inside the FPGA. Our implementation uses the fixed sub-window of 16×8 pixels, which is able to fit inside a single 7-bit address, 32-bit data M4K block (4608 bits including parity) in the Altera FPGA [27].
The integral image generator uses two memory blocks to store temporary integral image data in order to generate the integral image in one succession. To
Avalon Switch Fabric
Avalon- MM Slave Interface
(Write) Multiply-
Accumulator Control
Logic
M4K Memory (128×32)
M4K Memory (128×32) Adder
Avalon- MM Slave Interface
(Read)
Mux
Write address (x, y)
Write address
Write data i(x, y)
Read address (x, y)
Read data ii(x, y)
Reset on x = 0
(new row) Cumulative column data c(x, y)
Previous row data ii(x, y – 1)
Write address (x, y) Read address
(x, y)
Read data ii(x, y)
Integral image data ii(x, y)
Integral image data
ii(x, y)
Read previous row
address (x, y – 1)
Read previous row
data ii(x, y – 1)
Select previous row data
on x > 0 Forward write data
to integral image squared block
Fig. 3. Block Diagram of the Hardware Integral Image Generator.
illustrate this, we have to look at the following equation, where ii refers to integral image values, while c refers to the cumulative column sum:
(, =(,)+( , )+(, ) (1)
The integral image data are stored in a continuous block of memory accessed by address, a = x + 16y. i(x, y) is pixel data supplied to the generator. The portion i(x, y) + r(x –1,y) can be calculated using a multiply-accumulator. ii(x, y – 1) have to be read from the memory. However, since the M4K block used to store ii(x, y) data can only have 1 read port due to the configuration used [27], and this read port has to feed ii(x, y) data to the Haar-feature calculator, another M4K block was instantiated to store ii(x, y – 1). The reset of the multiply-accumulator on a new row (y) and the addition of ii(x, y – 1) are handled by the control logic. The hardware is duplicated to calculate
integral image squared, with the exception of having an extra multiplier to calculate the image squared.
The memory address space is mapped to the system bus for simpler access. The processor is required to send pixel data contiguously from (x, y) = (0, 0) to (x, y) = (15, 7).Integral image data is available immediately after sending the necessary pixel data. The processor is able to send a pixel value to the integral image generator in 1 clock cycle because there are no wait states. Therefore, 128 clock cycles are needed to generate the full integral image and image squared (since there are 16×8 = 128 pixels). To compute this integral image and image squared on Nios II on Cyclone II FPGA, the processor would require 128 cycles for integral image (addition takes 1 cycle per pixel) and 1024 cycles for integral image squared (each multiplication takes 5 cycles, plus 2-cycle multiplication latency and 1-cycle addition which makes 8 cycles required per pixel) [25]. In total, the processor needed 1152 cycles to generate required data. Our
Avalon Switch Fabric
Avalon- MM Slave Interface
(Write) Avalon- MM Slave Interface
(Read)
Register File
4-Port Add/
Substract
4-Port Add/
Substract
4-Port Add/
Substract
Fixed-Point Conversion
Fixed-Point Conversion
Fixed-Point Conversion
Gain
Gain
Mux
Substract
Multiplier
Multiplier
Multiplier
Substract Mux
Read address
Data
Haar feature value Variance
Write address
Write data
First rectangle
Second rectangle
Integral image squared in Haar feature
Weight for first rectangle = –1, therefore substract
– + 2
3
Select gain based on Haar feature
Haar Feature
value
Variance Inverse of
total number of pixels in Haar feature,
1/N
1/N Pixel squared
sum in Haar
feature 1/N
Pixel sum In Haar feature
Mean of pixel value
Fig. 4. Block Diagram of the Hardware Haar Feature Calculator
implementation is close to 10× faster compared to the processor alone
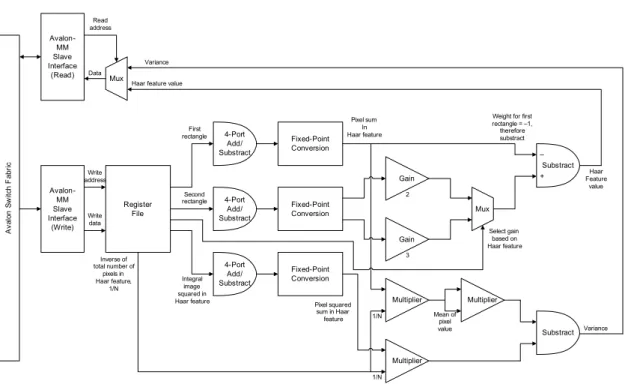
3.3 Hardware Haar-Feature Calculator The Haar-feature calculator is a separate IP connected to the system bus. It calculates Haar-feature value, f values based on the following equation [10]
which is implemented in OpenCV, where ω is the weight, R is the rectangle sum and r refers to the rectangles in a Haar feature. Only upright Haar features are used in this system:
=
∈
(2)
The Haar-feature calculator is implemented in fixed-point arithmetic, and works on 2 rectangles only (see Figure 1). The fixed-point method has little effect on detection rate [9]. The reason for having a 2-rectangle only Haar-feature calculator is that 3-rectangle Haar features are rarely found in the
trained Haar cascade. The processor is used to calculate the third rectangle if there is any 3-rectangle Haar feature. The weight ω1 for the first rectangle is always –1 (therefore the second rectangle will be subtracted by the first rectangle), while the weight ω2 for the second rectangle can be either 2 or 3 depending on the Haar feature [10]. For this reason, simpler Gain blocks are used instead of multipliers to represent the weights. The Haar-feature calculator works by having the processor to write integral image and values into the registers. Each write requires 2 clock cycles (due to wait states). The Haar-feature calculator then processes the data and outputs the Haar-feature value in 2 clock cycles when read by processor. Note that this Haar-feature calculator also computes the variance required for normalization [1], in which it takes in integral image squared values. 4 writes are required to supply all the integral image data to the calculator (each write carries 2 integral image values), while 5 writes are required to supply all the integral image squared data and inverse of total number of pixels in the Haar feature to the calculator (each write carries
Start camera to capture a new single image
into SDRAM
Generate integral image and integral image squared using hardware integral image generator
Begin
Generate new sub-window from fixed region in
input image
Execute entire Haar cascade using hardware
Haar-feature calculator Reset timer and detection history
Obtain lapsed time from timer, add time and
detection data into linked list
Calculate/Update PERCLOS value Eye detected in
sub-window?
Yes No
PERCLOS > 15%?
Trigger alarm Yes
No
All fixed region scanned?
Flag eye detected to detection history
No
Yes Construct new
linked list data structure
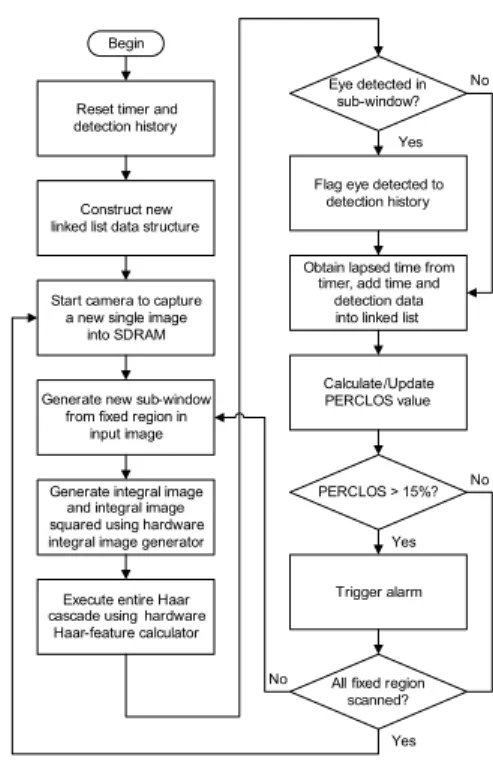
Fig. 5. Program flowchart of the SW Component one integral image squared data, while the inverse of
total number of pixels takes another write operation). 2 reads are required to obtain the Haar-feature value and variance. This leads to a total of 22 clock cycles to get all required data. Whilst simple the Haar calculator may be, it is faster by 14 cycles compared to calculating the Haar-feature values on the processor alone (which needs 36 cycles in fixed-point or otherwise integer arithmetic, see [25]). Haar-feature values are used by the processor for classification. The processor will compute the standard deviation from the variance obtained.
3.4 Software-Based Components
The processor is responsible for the movement of data between the SDRAM (image data), integral image generator and Haar-feature calculator. Scaling of image data into sub-windows, Haar classifications and PERCLOS calculations are also handled by the processor. Nearest neighbor algorithm is used for the scaling of images. As mentioned, Haar classifications are performed on the processor. PERCLOS calculations are achieved by maintaining the latest 60 seconds of eye detection data in a linked list. The overall program flow is shown in Figure 5.
4. Implementation Results
4.1 Classifier Detection Rate
To train a cascade that is tailored for eye detection, OpenCV was used. First, a large dataset of positive eye samples was collected from various online face databases ([28] and [29]). Negative samples were also collected from the Internet, mainly from Urtho’s [30]
negative sets. Then training was conducted at sample size of 16×8. When labeling eye samples for training, the aspect ratio was kept at 16×8 to minimise training distortions due to stretching of eye samples if the aspect ratio is not 16×8. The outcome of this training process is a 3-stage cascade with 103 simple Haar
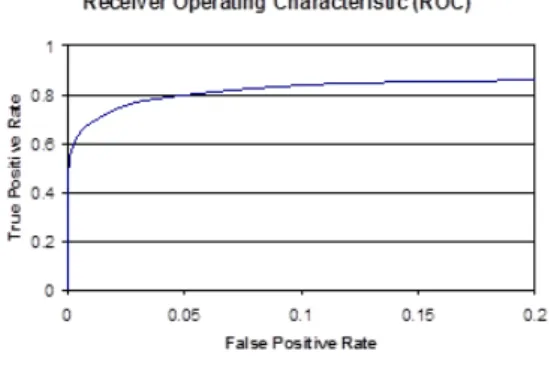
classifiers for the first stage, 234 for the second stage and 411 for the third stage. When tested on a subset of Yale B face database with 193 true positives, this cascade achieved 69.4% hit rate and 0.05% false positives. comparing We compared this cascade with popular Haar cascades for eye detection from the Internet, and the results are summarised in Table I.
Haar Cascade
Positive Hits
Hit Rate
False Positives
Own 134 69.4% 8
Urtho 125 64.8% 36
Ting Shan [31] 125 64.8% 1826
Shameem [31] 51 26.4% 82
Table 1. Comparison of Haar Cascades
Eye Detector Platform Hit
Rate
This work FPGA 69.4%
Betke and Mullally [3] GPP 83.0%
Orazio et al. [4] GPP 93.7%
Veeraraghavan and Papanikolopoulos [14]
GPP 70.9%
Smith et al. [23] SPARC 95.1%
Table 2. Comparison of Eye Detectors
There are more than one cascade in [31], but only Ting Shan’s and Shameem’s can differentiate opened eyes from closed eyes, which is what we have trained our cascade for. Compared to the closest competitor from Urtho – a 20-stage cascade with a total of 1410 simple classifier, our cascade not only possesses higher hit rate but also produces considerably less false positives, albeit at less stages, which may reduce performance due to the high number of simple classifiers per stage.
Our Haar cascade is also compared with other works that have published eye detection results, as shown in the Table II. The issue with such comparisons is that the detection dataset is always not equivalent; therefore an exactly fair benchmark comparison is difficult to infer. The results are obtained by averaging all open-eye hit rates (regardless of left/right eyes) based on dataset that are not part of the training dataset.
Fig. 6. Receiver operating characteristic for the trained cascade.
Smith et al. [23] boosts the highest hit rate with low false positives, but it ran on an UltraSparc system.
Orazio et al. [4] has the second highest hit rate with low false positives, however it is also the system that requires the highest computational needs – Pentium 4 running at 3.2 GHz due to its use of Hough transform.
Betke and Mullally [3] has good hit rates, but it also runs on a general purpose platform. Veeraraghavan and Papanikolopoulos [14] also reported a high hit rate, but template matching was used to detect eyes, which is
commonly associated with low robustness.
4.2 Implementation Constraints
Due to time constraints, this system was developed with certain limitations. First of all, a lesser, 14-stage 200 simple classifiers cascade was used; with 67% hit rate but higher false positives. Moreover, sub-windows were generated on a fixed region of interest of the input images where the driver’s eyes are usually located. The region of interest was downscaled using a single fixed scaling factor of 0.1 (in the original algorithm, the sub-window is scaled using a multitude of scaling factors to cover the whole image). In other words, the prototype system did not scan the whole input image using the best Haar cascade we have trained. With these constraints in place, hardware performance is not immediately measurable.
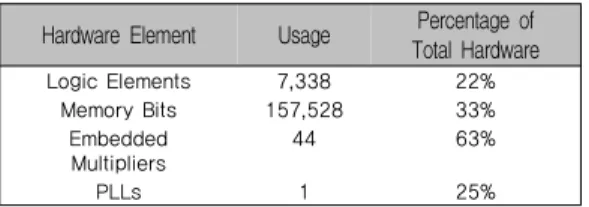
4.3 Hardware Resources
The total hardware resources required for the above implementation, including resources used by the camera controller, is shown below in Table III.
With the highest optimization settings in Altera Quartus II [26], the detection system on the FPGA is capable of running at 171.17 MHz without the JTAG module. However, the FPGA is pegged at 50 MHz in this work owing to the constraint of the on-board oscillator which runs at 50 MHz, and the SDRAM runs at only 100 MHz. Moreover, the instructions for the processor are stored in SRAM, which can only be accessed at 25 MHz. This further limits the speed of the system. Faster memories and a faster oscillator would further improve performance. Our future work will look at possible enhancements that through utilization of a phase lock loop (PLL) to bootstrap the running speed.
Hardware Element Usage Percentage of Total Hardware
Logic Elements 7,338 22%
Memory Bits 157,528 33%
Embedded Multipliers
44 63%
PLLs 1 25%
Table 3. FPGA Hardware Utilization
4. Conclusions
In this paper, we present an embedded implementation of a PERCLOS-based DD detection system on a FPGA with a soft-core Nios II processor and a custom eye detection IP block. The eye detection algorithm in use is derived from Viola and Jones' work on Haar like feature AdaBoost algorithm. Critical parts of the algorithm are hardware-accelerated, while the remaining parts run on a soft-core processor. This HW/SW co-design implementation, an emerging trend in embedded computing, provides great reusability and speed.
The current implementation can be further improved by having multiple integral image generators and Haar classifiers that work on different regions of the input image at the expense of greater FPGA resources. Dual processors and a higher bandwidth from the SDRAM are also needed for such enhancement. Another suggestion is to have the SDRAM controller, integral image generator and Haar classifier integrated together as a complete HW module using dedicated high-speed streaming interfaces rather than communicating over the system bus. This allows faster computation and earlier availability of feature
The current implementation achieves near 70% of accuracy at less than 2% false alarm rate. For practical deployment, we would like to see a further elevation in the accuracy metric which is independent of the hardware implementation issues.
Acknowledgment
A portion of the face images used in this work have been provided by and the Computer Vision Laboratory, UniversityofLjubljana,Slovenia[29].
The authors would like to thank Swinburne University of Technology Sarawak Campus for partially supporting this work. The authors also thank Altera Inc. for kindly sponsoring the DE2 board used in this work through its University Program. KCL would like to thank Aileen Poh Khai Ling for her support during this work.
References
[1] Viola, P & Jones, M 2001, ‘Rapid Object Detection using a Boosted Cascade of Simple Features’, Proceedings of the IEEE Computer Society Conference on Computer Vision and Pattern Recognition, vol. 1, pp. I-511 – I-518, IEEE, 10.1109/CVPR.2001.990517.
[2] Wierwille, WW, Ellsworth, LA, Wreggit, SS, Fairbanks, RJ
& Kirn, CL, 1994, Research on Vehicle-Based Driver Status/Performance Monitoring: Development, Validation, and Refinement of Algorithms For Detection of Driver Drowsiness, National Highway Traffic Safety Administration, New Jersey.
[3] Betke, M & Mullally, WJ 2000, ‘Preliminary Investigation of Real-Time Monitoring of A Driver In City Traffic’, Proceedings of the IEEE Intelligent Vehicles Symposium, pp. 563-568, IEEE, 10.1109/IVS.2000.898407.
[4] D’Orazio, T, Leo, M, Guaragnella, C & Distante, A 2007,
‘A visual approach for driver inattention detection’, Pattern Recognition, vol. 40, no. 8, pp. 2341-2355.
[5] Wang, F & Qin, H 2005, ‘A FPGA Based Driver Drowsiness Detecting System’, IEEE International Conference on Vehicular Electronics and Safety, pp.
358-363, IEEE, 10.1109/ICVES.2005.1563673.
[6] Moreno, F, Aparicio, F, Hernandez, W & Paez, J 2003, ‘A low-cost Real-Time FPGA solution for driver drowsiness detection’, The 29th Annual Conference of the IEEE Industrial Electronics Society, vol. 2, pp. 1396-1401, IEEE, 10.1109/IECON.2003.1280262.
[7] Wei, Y, Bing X & Chareonsak, C 2004, ‘FPGA Implementation of AdaBoost Algorithm for Detection of
Face Biometrics’, IEEE International Workshop on Biomedical Circuits and Systems, pp. S1/6- 17-20, IEEE, 10.1109/BIOCAS.2004.1454161.
[8] Nair, V, Laprise, P & Clark, J 2005, ‘An FPGA-Based People Detection System’. EURASIP Journal on Applied Signal Processing, vol. 2005, no. 1, pp. 1047–1061, ACM Portal: ACM Digital Library.
[9] Hiromoto, M, Nakahara , K & Sugano, H 2007, ‘A Specialized Processor Suitable for AdaBoost-Based Detection with Haar-like Features’, IEEE Conference on Computer Vision and Pattern Recognition, pp. 1-8, IEEE, 10.1109/CVPR.2007.383415.
[10] Lienhart, R & Maydt, J 2002, ‘An Extended Set of Haar-like Features for Rapid Object Detection’, IEEE International Conference on Inage Processing, vol. 1, pp.
900-903.
[11] Open Source Computer Vision Library 2008, Intel Corporation, SantaClara.
[12] Freund , Y & Schapire, RE 1995, ‘A Decision-Theoretic Generalization Of On-Line Learning And An Application To Boosting’, Computational Learning Theory: Eurocolt, pp. 23–37, Springer-Verlag.
[13] Grace, R, Byrne, VE, Bierman, DM, Legrand, JM, Gricourt, D, Davis, RK, Staszewski, JJ & Carnahan, B 1998, ‘A Drowsy Driver Detection System For Heavy Vehicles’, Proceedings of the 17th DASC AIAA/IEEE/SAE Digital Avionics Systems Conference, vol. 2, pp. I36/1-I36/8, IEEE, 10.1109/DASC.1998.739878.
[14] Veeraraghavan, H & Papanikolopoulos, N 2001, Detecting Driver Fatigue Through the Use of Advanced Face Monitoring Techniques, UniversityofMinnesota, Minneapolis.
[15] Ji, Q & Yang, X 2002, ‘Real-Time Eye, Gaze, and Face Pose Tracking for Monitoring Driver Vigilance’, Real Time Imaging, vol. 8, pp. 357-377.
[16] Ji, Q, Zhu, Z & Lan, P 2004, ‘Real-Time Nonintrusive Monitoring and Prediction of Driver Fatigue’, IEEE Transactions on Vehicular Technology, vol. 53, no. 4, pp.
1052-1068, IEEE, 10.1109/TVT.2004.830974.
[17] Cudalbu, C, Anastasiu, B, Radu, R, Cruceanu, R, Schmidt, E & Barth, E 2005, ‘Driver Monitoring With A Single High-Speed Camera And IR Illumination’, International Symposium on Signals, Circuits and Systems, vol. 1, pp.
219-222, IEEE, 10.1109/ISSCS.2005.1509893.
[18] Bergasa, LM, Nuevo, J, Sotelo, MA & Vazquez, M 2006,
‘Real-Time System for Monitoring Driver Vigilance’, IEEE Transactions on Intelligent Transportation Systems,
vol. 7, no. 1, pp. 63-77, IEEE, 10.1109/TITS.2006.869598.
[19] Ebisawa, Y & Satoh, S 1993, ‘Effectiveness of pupil area detection technique using two light sources and image difference method’, Proceedings of the 15th Annual International Conference of the IEEE Engineering in Medicine and Biology Society, pp. 1268-1269, IEEE.
[20] Ueno, H, Kaneda, M & Tsukino, M 1994, ‘Development of Drowsiness Detection System’, Proceedings of the Vehicle Navigation and Information Systems Conference, pp.
15-20, IEEE, 10.1109/VNIS.1994.396873.
[21] Sakaguchi, Y. Nakano, T. Yamamoto, S. 1996,
‘Development of non-contact gaze detecting system and its applications to gaze duration measurement of on-board display’, Proceedings of the IEEE Intelligent Vehicles
Symposium, IEEE, pp. 289-294, IEEE,
10.1109/IVS.1996.566393.
[22] Eriksson, M.; Papanikotopoulos, N.P. 1997, ‘Eye-Tracking for Detection of Driver Fatigue’, IEEE Conference on Intelligent Transportation System, vol. 9, no. 12, pp.
314-319, IEEE, 10.1109/ITSC.1997.660494.
[23] Smith, P, Shah, M & da Vitoria Lobo, N 2003,
‘Determining Driver Visual Attention With One Camera’, IEEE Transactions on Intelligent Transportation Systems, vol. 4, no. 4, pp. 205-218, IEEE, 10.1109/TITS.2003.821342.
[24] Wang, R, Guo, K, Shi S & Chu, J 2003, ‘A Monitoring Method of Driver Fatigue Behavior Based on Machine Vision’, Proceedings of the Intelligent Vehicles Symposium, vol. 9, no. 11, pp. 110-113, IEEE, 10.1109/IVS.2003.1212893.
[25] Nios II Processor Reference Handbook 2007, Altera Corporation, SanJose.
[26] Quartus II Handbook 2008, Altera Corporation, SanJose.
[27] Cyclone II Device Handbook 2008, Altera Corporation, SanJose.
[28] Kanade, T., Cohn, J. F., & Tian, Y. (2000). Comprehensive database for facial expression analysis. Proceedings of the Fourth IEEE International Conference on Automatic Face and Gesture Recognition (FG'00), Grenoble,France,46-53.
[29] CVL FACE DATABASE: http://www.lrv.fri.
uni-lj.si/facedb.html
[30] Urtho 2007, Urtho's face detection & normalization project, http://face.urtho.net/.
[31] Reimondo, A 2008, Haar Cascades, http://www.
alereimondo. com.ar/OpenCV.
저 자 소 개
Kok Choong Lai [정회원]
▪2008 Sept : School of Engineering, Swinburne University of Technology, Sarawak Campus
(BEng (Hons) Electronics and Computer Systems)
▪2008. July.~ Present: Senior Design Verification Egineer Intel Microelectronics (M) Sdn Bhd
▪E-Mail : joshua.lai@intel.com
<관심분야> : Pre-silicon design and validation, computer architecture, statistical modeling, data mining
M. L.Dennis Wong [정회원]
▪2005 July: School of Engineering, SUTS, Malaysia.
▪2008.July.: Dept. EEE, Universiti Tenaga Nasional, Malaysia
▪2013. May.~ Present: Research Fellow & Faculty Member York University, Toronto, ON
▪E-Mail : sislam@cse.yorku.ca
<관심분야> : VLSI Design and Testing, Biomedical System Design, FPGA Design
Syed Zahidul Islam [정회원]
▪1999 July : Dept. EEE, University of Liverpool, U.K.(BEng (Hons) Electronics and Communications)
▪2004.July.: Dept. EEE, University of Liverpool, U.K.(PhD (Signal Processing))
▪2012. June.~ Present: Associate Professor and Dean, Swinburne University of Technology, Sarawak
Campus
▪E-Mail: dwong@swinburne.edu.my
<관심분야> : Statistical Pattern Recognition, Cancellable Biometrics, VLSI Digital Signal Processing
![Fig. 1. Upright Haar-like features used in OpenCV [3].](https://thumb-ap.123doks.com/thumbv2/123dokinfo/5250793.628652/3.799.102.349.662.865/fig-upright-haar-like-features-used-opencv.webp)
![Figure 2 shows the overall block diagram of the FPGA implementation. In our implementation, we chose the fast version of Altera Nios II [25] as the processor (soft-core), connected to the memory-mapped system bus known as](https://thumb-ap.123doks.com/thumbv2/123dokinfo/5250793.628652/4.799.91.381.530.764/figure-overall-diagram-implementation-implementation-version-processor-connected.webp)