ABSTRACT
Background and Objectives: Hypertension awareness, treatment, and control have been substantially improved in the last decades worldwide, but hypertension management in younger adults is still challenged. We analyzed a nationally representative sample of Korea to investigate factors affecting hypertension management among the young Korean population.
Methods: Among 8,024 young adults aged 30–49 years from the 2014–2018 Korea National Health and Nutrition Examination Survey, 1,103 participants with hypertension were analyzed to identify factors associated with hypertension management status. Multiple logistic regression models were conducted separately by sex.
Results: Young adults with hypertension showed a low rate of awareness (35.8%), treatment (30.9%), and control (23.0%). The older age (40–49 years), obese (body mass index ≥25.0 kg/
m
2), having diabetes mellitus (DM), and having past-history of cardiovascular disease were positively associated with awareness, and taking health examination in the past 2 years were positively associated with both treatment and control of hypertension among male. Young females who were older (40–49 years), rural residents, unemployed, not taking sodium over the recommended amount, having dyslipidemia, and having DM showed a higher likelihood of awareness. Young females who have not experienced unmet medical needs in the past year were more likely to be treated or controlled with hypertension.
Conclusions: The factors associated with hypertension awareness, treatment, and control were different by sex and age group. Enhancing attention on hypertension among young hypertension and encouraging them to visit clinics would be key strategies to improve hypertension management among the young hypertensive population.
Keywords: Young adult; Hypertension; Disease management; Epidemiologic factor
INTRODUCTION
Hypertension, one of the most prevalent and manageable risk factors for cardiovascular disease (CVD),
1-3)has been tackled in past decades by healthcare professionals both in population and high-risk approach. By introducing multidisciplinary public health programs and policies, the hypertension management status presented as awareness, treatment, and control rates have been substantially improved worldwide and also domestically.
1)4)According
Original Article
Received: May 14, 2020 Revised: Jun 18, 2020 Accepted: Aug 18, 2020 Correspondence to Hyeon Chang Kim, MD, PhD
Department of Preventive Medicine, Yonsei University College of Medicine, 50-1 Yonsei-ro, Seodaemun-gu, Seoul 03722, Korea.
E-mail: [email protected]
Copyright © 2020. The Korean Society of Cardiology
This is an Open Access article distributed under the terms of the Creative Commons Attribution Non-Commercial License (https://
creativecommons.org/licenses/by-nc/4.0) which permits unrestricted noncommercial use, distribution, and reproduction in any medium, provided the original work is properly cited.
ORCID iDs Yong Woo Jeon
https://orcid.org/0000-0002-0659-4159 Hyeon Chang Kim
https://orcid.org/0000-0001-7867-1240 Conflict of Interest
The authors have no financial conflicts of interest.
Author Contributions
Conceptualization: Jeon YW, Kim HC;
Data curation: Jeon YW; Formal analysis:
Jeon YW, Kim HC; Investigation: Jeon YW, Kim HC; Methodology: Jeon YW; Project administration: Kim HC; Software: Jeon YW;
Supervision: Kim HC; Validation: Kim HC;
Visualization: Jeon YW; Writing - original draft:
Jeon YW; Writing - review & editing: Jeon YW, Kim HC.
Yong Woo Jeon , MD
1and Hyeon Chang Kim , MD, PhD
1,21
Department of Preventive Medicine, Yonsei University College of Medicine, Seoul, Korea
2
Cardiovascular and Metabolic Diseases Etiology Research Center, Yonsei University College of Medicine, Seoul, Korea
Factors Associated with Awareness, Treatment, and Control Rate of
Hypertension among Korean Young
Adults Aged 30–49 Years
to the study conducted in 12 high-income countries, hypertension awareness, treatment, and control rates have increased to reach 40–80% over the last 2 decades until they became plateaued in the mid-2000s, while the prevalence has not changed a lot.
1)Given that the control rate was less than 25% in the 1980s–early 1990s in most countries, it was remarkable progress owing to the repeatedly updated hypertension management guidelines and public health programs.
3)5)6)However, the achievement was different by age. The young adults in the US, aged 20–39 years, had a control rate of 33.0% in 2010, while the older people showed a control rate of 55.7% in 40–59 years and 54.9% in ≥60 years.
7)A study analyzing nation-wide data of China reported that the control rate was estimated 6.1–7.6% among young adults in contrast to 12.5–13.3% among elderly people.
8)The public health challenge derived from this discrepant management status between young and old hypertensive people was observed worldwide.
7)9-11)Even in South Korea, one of the countries with the best hypertension control,
1)both male and female young populations still have awareness and treatment rates below 50% as well as low control rates.
4)Kang et al.
11)reported that the proportion of controlled people among the hypertensive population in Korea was 9.8% among the age of 30–39 years, whereas 59.6%
among 60–69 years.
If starting from a young age, hypertension could lead to life-time-long exposure to elevated blood pressure, which has been observed in previous studies that it elevated CVD risk significantly regardless of race.
12)Therefore, early intervention and management are crucial for young hypertension to prevent future adverse CVD events. Many studies have explored factors or barriers associated with hypertension awareness, treatment, and control to suggest strategies promoting hypertension management.
13-15)However, most studies were conducted among middle-aged to elderly hypertensive population. Therefore, we investigated factors affecting awareness, treatment, and control of hypertension, especially among the young Korean population by analyzing a national representative sample of Korea.
METHODS
Study populations
We used data from the Korea National Health and Nutrition Examination Survey (KNHANES) conducted in the most recent 5 years (2014–2018). KNHANES provides data on a health interview, health examination, and nutrition survey.
6)The study population was restricted to young adults aged 30 to 49 years (n=10,591), among 39,199 participants in KNHANES 2014–2018.
4)Those who were pregnant (n=114) or had past-history of cancer (n=205) or chronic renal failure (n=27) were excluded. We also excluded people who lack information on the previous diagnosis of hypertension and medication use, people with incomplete blood pressure measurements, and people who had missing survey weight value (Supplementary Figure 1). Finally, 8,024 young adults (6,921 without and 1,103 with hypertension) were analyzed for this study.
Measurements
The KNHANES used the standardized protocol to measure blood pressure throughout
survey waves.
6)11)Blood pressure was measured 3 times by using a standard mercury
sphygmomanometer (Baumanometer wall unit 33; WA Baum Co., New York, NY, USA) with
5-minutes-resting beforehand. The measuring equipment was calibrated periodically, and
quality control was performed at every survey waves by both the Division of Health and Nutrition Survey, Korea Centers for Disease Control & Prevention and the Korean Society of Hypertension.
16)17)The mean of the last 2 measurements of systolic blood pressure (SBP) and diastolic blood pressure (DBP) was used in this study. The prevalence, awareness, treatment, and control rate of hypertension were assessed with the blood pressure measurements and a questionnaire-based health interview. The prevalence of hypertension was defined as SBP ≥140 mmHg or DBP ≥90 mmHg or self-reported antihypertensive medication use. We defined the awareness rate of hypertension as the proportion of people who reported to be diagnosed with hypertension from physicians, the treatment rate as the proportion of people who reported to use antihypertensive medication at least 20 days per month, and the control rate as SBP <140 mmHg and DBP <90 mmHg, among the prevalent hypertensive people.
4)Several variables were included in the analysis to investigate the factors associated with hypertension management status among the young adult Korean population. Age was divided into 2 groups: 30–39 years and 40–49 years. Obesity was defined as body mass index (BMI) ≥25.0 kg/m
2and overweight as 23.0 to 24.9 kg/m
2according to the Asian and Pacific perspective of the World Health Organization.
18)The residence places of participants were categorized based on their current addresses. Marital status was classified as “never married,” “currently married and cohabitated,” and “others,” which includes the separated, bereaved, divorced, etc. Education level was divided by the completion of college/university, high school, or else, and we redefined them into a binary variable for analysis: over- vs.
under- college graduate. We classified the occupation of the participants by 4 categories:
“white-collar” as managers, professionals, and office workers; “blue-collar” as indoor service providers, salesclerks, farmworkers, fishery workers, machinery workers, general laborers, and professional soldiers; “housewives”; and “unemployed.” We classified male homemakers as “unemployed” because of the tiny sample size (3 out of 732 hypertensive men). Current smokers were defined as those who had smoked at least 100 cigarettes lifetime and are still smoking. We defined current drinkers as who had consumed alcohol at least once a month on average in the past year. Physical inactivity was assessed using the Global Physical Activity Questionnaire. Those who reported participating in moderate to vigorous-intensity physical activity (PA) less than 150 minutes a week, 1 minute of vigorous PA is equal to 2 minutes of moderate PA, were considered as physically inactive.
19)Daily sodium intake was estimated by using a 24-hour dietary recall, and sodium consumption ≥2,000 mg/day was defined as sodium over-intake.
20)Dyslipidemia was defined as the presence of one or more of the following conditions: 1) hypercholesterolemia defined as fasting blood cholesterol level ≥240 mg/dL; 2) hypertriglyceridemia defined as fasting blood triglyceride level ≥200 mg/dL; 3) hyper-low-density-lipoprotein (LDL)-cholesterolemia defined as fasting blood LDL-cholesterol level ≥160 mg/dL; 4) hypo-high-density-lipoprotein (HDL)-cholesterolemia defined as fasting blood HDL-cholesterol level ≤40 mg/dL; 5) the self-reported use of lipid-lowering medication.
21)Diabetes mellitus (DM) was defined as fasting blood glucose level ≥126 mg/dL or reporting to be diagnosed from physicians or currently on medication or insulin injection. Past-history of CVD was obtained from participants' reporting of ever being diagnosed from physicians with stroke or myocardial infarction or angina pectoris.
Experience of unmet medical needs was reported by participants in response to the following question: “During the past year, have you ever been unable to get medical care when needed?”
Participants also reported health examination experience in the past 2 years by answering the
following question: “Have you ever gotten health examination in the past 2 years for health
management purposes?”
Statistical analyses
The study population's general characteristics were reported as the number of participants with a weighted proportion by factors (SURVEYFREQ procedure, SAS v9.4; SAS Institute Inc., Cary, NC, USA). Hypertension management status—awareness, treatment, control rate—was estimated among participants with hypertension. We performed logistic regression models (SURVEYLOGISTIC procedure, SAS v9.4; SAS Institute Inc.) to calculate odds ratios (ORs) with 95% confidence interval (CI) to assess the association of the factors with hypertension awareness, treatment, and control. We further adjusted the models by incorporating each factor for age, obesity, region, marital status, education, occupation, smoking status, drinking status, sodium over-intake, physical inactivity, dyslipidemia, DM, past-history of CVD, unmet medical needs in the past year, and health examination in the past 2 years. We conducted the analysis separately by sex and age based on the results of our preliminary analysis (Supplementary Data 1, Supplementary Tables 1-4) and the evidence from previous studies.
4)13)14)22)23)To take into account the effect on estimator variance attributable to the KNHANES' stratified multistage clustered probability sampling design, we applied survey sampling weights to all the analyses, and we used the DOMAIN statement for subgroup analyses. All statistical analyses were performed using SAS 9.4 software for Windows (SAS Institute Inc.).
RESULTS
The weighted prevalence of hypertension among the age of 30–49 young Korean population was 15.2% in total (22.2% in male vs. 7.7% in female; p value for difference <0.001). This equates to an estimated 2.3 million young adults with hypertension (1.7 million male and 0.6 million female). The hypertensive participants compared to the participants without hypertension had a higher proportion of 40–49 age group, male, BMI ≥25.0 kg/m
2, current smokers, and also having other comorbid diseases (Table 1).
The hypertension awareness rate was 35.8% among total hypertensive participants, 33.4%
in male and 43.5% in female when stratified by sex. The treatment rate and control rate were 30.9% and 23.0% respectively among hypertensive participants (28.1% and 19.3% in male, 39.8% and 34.6% in female, respectively) (Supplementary Tables 5-7).
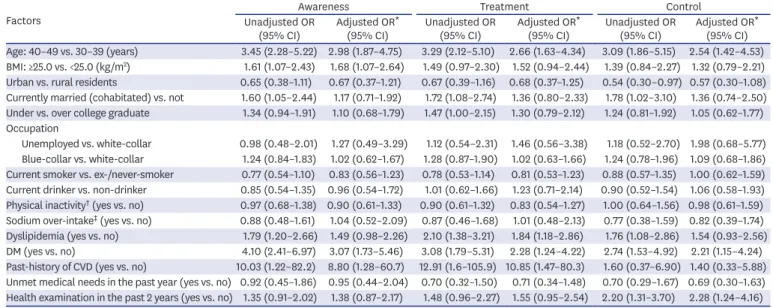
Table 2 shows the factors affecting hypertension management status among male participants. The odds of being aware of hypertension was 2.98-fold (95% CI, 1.87–4.75) higher in older (40–49 years) age group compared to younger (30–39 years) age group. The older age group also showed 2.65-fold (95% CI, 1.63–4.34) higher odds of being treated, and 2.54-fold (95% CI, 1.42–4.53) higher odds of controlling the disease compared to the younger age group. Those with higher BMI (≥25.0 kg/m
2) showed higher odds of being aware of hypertension (OR, 1.68; 95% CI, 1.07–2.64) and being treated (OR, 1.52; 95% CI, 0.94–2.44), but the control rate was not significantly higher than the lower BMI (<25.0 kg/m
2) group.
Marital status was associated with hypertension management status in a crude model, but not
statistically significant after covariates adjustment. Having DM was associated with a higher
awareness rate (OR, 3.07; 95% CI, 1.73–5.46), treatment rate (OR, 2.28; 95% CI, 1.24–4.22),
and control rate (OR, 2.24; 95% CI, 1.15–4.24). The male participants with past-history
of CVDs were more likely to be aware (OR, 8.80; 95% CI, 1.28–60.67) of hypertension and
to be treated (OR, 10.85; 95% CI, 1.47–80.26), but not to be controlled (OR, 1.40; 95% CI,
0.33–5.88). Those who have got health examination in the past 2 years showed a significantly higher control rate (OR, 2.28; 95% CI, 1.24–4.16) compared to those who have not.
The factors affecting hypertension management among female participants were presented in Table 3. The older (40–49 years) age group showed higher odds of being aware (OR, 2.87; 95% CI, 1.34–6.15), being treated (OR, 3.30; 95% CI, 1.51–7.24), and being controlled of hypertension (OR, 3.92; 95% CI, 1.64–9.36). The participants living in urban areas had a lower OR of awareness (OR, 0.40; 95% CI, 0.20–0.81) and treatment (OR, 0.48; 95% CI, 0.24–0.96) compared to those residing in rural areas. Unemployed participants showed significantly higher odds of awareness (OR, 2.06; 95% CI, 1.00–4.22), treatment (OR, 1.97;
95% CI, 0.96–4.03), and control (OR, 2.09; 95% CI, 0.92–4.75) than female white-collar workers. Females who reported to take sodium more than the recommendation for daily Table 1. General characteristics of young (30–49 years) Korean population from KNHANES (2014–2018)
Variables Total (n=8,024) Without hypertension
(n=6,921) With hypertension (n=1,103) Age (years)
30–39 3,744 (47.2) 3,403 (49.9) 341 (32.0)
40–49 4,280 (52.8) 3,518 (50.1) 762 (68.0)
Sex
Male 3,241 (51.8) 2,509 (47.5) 732 (75.8)
Female 4,783 (48.2) 4,412 (52.5) 371 (24.2)
BMI (kg/m
2)
<23.0 3,717 (43.1) 3,521 (47.8) 196 (17.0)
≥23.0, <25.0 1,693 (22.1) 1,487 (22.9) 206 (18.0)
≥25.0 2,603 (34.8) 1,905 (29.4) 698 (64.9)
Region
Rural 1,118 (12.1) 940 (11.9) 178 (13.7)
Urban 6,906 (87.9) 5,981 (88.1) 925 (86.3)
Marital status
Never married 1,118 (16.4) 944 (16.0) 174 (18.6)
Currently married (cohabitated) 6,537 (79.5) 5,678 (80.1) 859 (76.3)
Others * 369 (4.1) 299 (3.9) 70 (5.1)
Education
Elementary–middle school 341 (4.4) 268 (4.1) 73 (6.5)
High school 2,644 (33.7) 2,211 (32.8) 433 (39.1)
≥ College 4,764 (61.8) 4,207 (63.2) 557 (54.4)
Occupation
Unemployed 1,047 (12.6) 902 (12.7) 145 (12.5)
Housewives 999 (10.6) 950 (11.9) 49 (3.3)
White-collar 3,250 (42.9) 2,818 (43.1) 432 (41.2)
Blue-collar 2,453 (33.9) 2,015 (32.3) 438 (42.9)
Unhealthy lifestyle
Current smoking 1,713 (25.9) 1,352 (24.2) 361 (35.5)
Current drinking 5,109 (66.8) 4,297 (64.9) 812 (77.7)
Physical inactivity
†3,935 (48.7) 3,407 (48.9) 528 (47.8)
Sodium over-intake
‡6,526 (83.1) 5,596 (82.7) 930 (85.5)
Comorbidity
Dyslipidemia 2,269 (30.9) 1,697 (26.8) 572 (53.8)
DM 351 (4.9) 215 (3.4) 136 (13.3)
Past-history of CVD 46 (0.6) 28 (0.4) 18 (1.8)
Unmet medical needs in the past year 773 (10.1) 694 (10.5) 79 (7.6)
Health examination in the past 2 years 5,085 (66.1) 4,356 (65.8) 729 (67.7) Values are presented as number (%).
BMI = body mass index; CVD = cardiovascular disease; DM = diabetes mellitus; KNHANES = Korea National Health and Nutrition Examination Survey.
* Separated, bereaved, divorced, and etc.;
†Defined as not participating or participating less than 150 minutes per
week in moderate-to-vigorous physical activity;
‡Defined as taking over 2,000 mg/day.
intake
20)had a lower likelihood of being aware (OR, 0.44; 95% CI, 0.23–0.83), control (OR, 0.52; 95% CI, 0.27–1.00) of hypertension. The participants with dyslipidemia showed a higher likelihood of controlling the disease with OR of 2.19; 95% CI, 1.19–4.01; as well as of being aware of and being treated. Having DM was associated with a higher awareness rate (OR, 2.79; 95% CI, 1.11–6.82), treatment rate (OR, 2.34; 95% CI, 0.99–5.52) similar to male Table 2. Factors affecting hypertension awareness, treatment, and control rate among young (30–49 years) Korean males
Factors Awareness Treatment Control
Unadjusted OR
(95% CI) Adjusted OR *
(95% CI) Unadjusted OR
(95% CI) Adjusted OR *
(95% CI) Unadjusted OR
(95% CI) Adjusted OR * (95% CI) Age: 40–49 vs. 30–39 (years) 3.45 (2.28–5.22) 2.98 (1.87–4.75) 3.29 (2.12–5.10) 2.66 (1.63–4.34) 3.09 (1.86–5.15) 2.54 (1.42–4.53) BMI: ≥25.0 vs. <25.0 (kg/m
2) 1.61 (1.07–2.43) 1.68 (1.07–2.64) 1.49 (0.97–2.30) 1.52 (0.94–2.44) 1.39 (0.84–2.27) 1.32 (0.79–2.21) Urban vs. rural residents 0.65 (0.38–1.11) 0.67 (0.37–1.21) 0.67 (0.39–1.16) 0.68 (0.37–1.25) 0.54 (0.30–0.97) 0.57 (0.30–1.08) Currently married (cohabitated) vs. not 1.60 (1.05–2.44) 1.17 (0.71–1.92) 1.72 (1.08–2.74) 1.36 (0.80–2.33) 1.78 (1.02–3.10) 1.36 (0.74–2.50) Under vs. over college graduate 1.34 (0.94–1.91) 1.10 (0.68–1.79) 1.47 (1.00–2.15) 1.30 (0.79–2.12) 1.24 (0.81–1.92) 1.05 (0.62–1.77) Occupation
Unemployed vs. white-collar 0.98 (0.48–2.01) 1.27 (0.49–3.29) 1.12 (0.54–2.31) 1.46 (0.56–3.38) 1.18 (0.52–2.70) 1.98 (0.68–5.77) Blue-collar vs. white-collar 1.24 (0.84–1.83) 1.02 (0.62–1.67) 1.28 (0.87–1.90) 1.02 (0.63–1.66) 1.24 (0.78–1.96) 1.09 (0.68–1.86) Current smoker vs. ex-/never-smoker 0.77 (0.54–1.10) 0.83 (0.56–1.23) 0.78 (0.53–1.14) 0.81 (0.53–1.23) 0.88 (0.57–1.35) 1.00 (0.62–1.59) Current drinker vs. non-drinker 0.85 (0.54–1.35) 0.96 (0.54–1.72) 1.01 (0.62–1.66) 1.23 (0.71–2.14) 0.90 (0.52–1.54) 1.06 (0.58–1.93) Physical inactivity
†(yes vs. no) 0.97 (0.68–1.38) 0.90 (0.61–1.33) 0.90 (0.61–1.32) 0.83 (0.54–1.27) 1.00 (0.64–1.56) 0.98 (0.61–1.59) Sodium over-intake
‡(yes vs. no) 0.88 (0.48–1.61) 1.04 (0.52–2.09) 0.87 (0.46–1.68) 1.01 (0.48–2.13) 0.77 (0.38–1.59) 0.82 (0.39–1.74) Dyslipidemia (yes vs. no) 1.79 (1.20–2.66) 1.49 (0.98–2.26) 2.10 (1.38–3.21) 1.84 (1.18–2.86) 1.76 (1.08–2.86) 1.54 (0.93–2.56) DM (yes vs. no) 4.10 (2.41–6.97) 3.07 (1.73–5.46) 3.08 (1.79–5.31) 2.28 (1.24–4.22) 2.74 (1.53–4.92) 2.21 (1.15–4.24) Past-history of CVD (yes vs. no) 10.03 (1.22–82.2) 8.80 (1.28–60.7) 12.91 (1.6–105.9) 10.85 (1.47–80.3) 1.60 (0.37–6.90) 1.40 (0.33–5.88) Unmet medical needs in the past year (yes vs. no) 0.92 (0.45–1.86) 0.95 (0.44–2.04) 0.70 (0.32–1.50) 0.71 (0.34–1.48) 0.70 (0.29–1.67) 0.69 (0.30–1.63) Health examination in the past 2 years (yes vs. no) 1.35 (0.91–2.02) 1.38 (0.87–2.17) 1.48 (0.96–2.27) 1.55 (0.95–2.54) 2.20 (1.31–3.70) 2.28 (1.24–4.16) The reference group is “no” for binary variables (yes/no), unless stated.
BMI = body mass index; CI = confidence interval; CVD = cardiovascular disease; DM = diabetes mellitus; OR = odds ratio.
* Adjusted for age, obesity, region, marital status, education, occupation, smoking status, drinking status, sodium over-intake, physical inactivity, dyslipidemia, DM, past-history of CVD, unmet medical needs in the past year, health examination in the past 2 years;
†Defined as not participating or participating less than 150 minutes per week in moderate-to-vigorous physical activity;
‡Defined as taking over 2,000 mg/day.
Table 3. Factors affecting hypertension awareness, treatment, and control rate among young (30–49 years) Korean females
Factors Awareness Treatment Control
Unadjusted OR
(95% CI) Adjusted OR *
(95% CI) Unadjusted OR
(95% CI) Adjusted OR *
(95% CI) Unadjusted OR
(95% CI) Adjusted OR * (95% CI) Age: 40–49 vs. 30–39 (years) 2.64 (1.30–5.35) 2.87 (1.34–6.15) 2.93 (1.39–6.16) 3.30 (1.51–7.24) 3.15 (1.37–7.26) 3.92 (1.64–9.36) BMI: ≥25.0 vs. <25.0 (kg/m
2) 0.93 (0.56–1.53) 0.81 (0.44–1.49) 0.96 (0.58–1.59) 0.82 (0.45–1.50) 0.80 (0.47–1.37) 0.68 (0.36–1.29) Urban vs. rural residents 0.48 (0.25–0.92) 0.40 (0.20–0.81) 0.55 (0.28–1.07) 0.48 (0.24–0.96) 0.83 (0.42–1.63) 0.85 (0.43–1.70) Currently married (cohabitated) vs. not 0.87 (0.35–2.14) 0.73 (0.33–1.62) 1.18 (0.46–3.04) 1.04 (0.42–2.56) 1.17 (0.43–3.14) 0.93 (0.34–2.50) Under vs. over college graduate 1.33 (0.77–2.31) 0.82 (0.42–1.59) 1.40 (0.80–2.46) 0.91 (0.46–1.80) 1.41 (0.81–2.46) 1.00 (0.50–1.98) Occupation
Unemployed vs. white-collar 2.21 (1.14–4.29) 2.06 (1.00–4.22) 2.30 (1.18–4.50) 1.97 (0.96–4.03) 2.50 (1.21–5.17) 2.09 (0.92–4.75) Housewives vs. white-collar 1.26 (0.54–2.95) 1.23 (0.48–3.16) 1.52 (0.65–3.58) 1.41 (0.54–3.66) 1.56 (0.70–3.48) 1.82 (0.69–4.81) Blue-collar vs. white-collar 1.32 (0.67–2.59) 1.10 (0.50–2.44) 1.32 (0.67–2.60) 1.09 (0.48–2.47) 1.28 (0.62–2.65) 1.10 (0.45–2.69) Current smoker vs. ex-/never-smoker 0.76 (0.32–1.82) 0.74 (0.30–1.86) 0.51 (0.21–1.26) 0.46 (0.16–1.33) 0.63 (0.25–1.58) 0.52 (0.18–1.55) Current drinker vs. non-drinker 0.75 (0.45–1.26) 0.89 (0.51–1.56) 0.77 (0.46–1.30) 0.97 (0.55–1.71) 0.88 (0.51–1.51) 1.14 (0.63–2.06) Physical inactivity
†(yes vs. no) 0.95 (0.57–1.57) 0.89 (0.51–1.55) 0.91 (0.55–1.51) 0.82 (0.47–1.43) 0.97 (0.56–1.66) 0.94 (0.52–1.67) Sodium over-intake
‡(yes vs. no) 0.50 (0.28–0.90) 0.44 (0.23–0.83) 0.65 (0.36–1.18) 0.51 (0.27–1.11) 0.59 (0.32–1.08) 0.52 (0.27–1.00) Dyslipidemia (yes vs. no) 1.98 (1.15–3.41) 2.19 (1.19–4.01) 2.05 (1.19–3.55) 2.29 (1.26–4.16) 2.31 (1.33–4.02) 2.69 (1.50–4.83) DM (yes vs. no) 2.08 (1.01–4.29) 2.79 (1.14–6.82) 1.84 (0.90–3.74) 2.34 (0.99–5.52) 1.26 (0.60–2.64) 1.34 (0.57–3.18) Past-history of CVD (yes vs. no) 4.37 (0.51–37.3) 1.47 (0.21–9.97) 5.07 (0.60–43.19) 2.74 (0.36–21.0) 6.73 (0.79–57.2) 5.13 (0.61–43.5) Unmet medical needs in the past year (yes vs. no) 0.68 (0.26–1.80) 0.37 (0.14–1.02) 0.53 (0.20–1.45) 0.32 (0.11–0.89) 0.47 (0.17–1.30) 0.32 (0.11–0.93) Health examination in the past 2 years (yes vs. no) 1.54 (0.90–2.65) 1.47 (0.81–2.65) 1.29 (0.75–2.22) 1.14 (0.63–2.05) 1.15 (0.65–2.05) 1.01 (0.54–1.88) The reference group is “no” for binary variables (yes/no), unless stated.
BMI = body mass index; CI = confidence interval; CVD = cardiovascular disease; DM = diabetes mellitus; OR = odds ratio.
* Adjusted for age, obesity, region, marital status, education, occupation, smoking status, drinking status, sodium over-intake, physical inactivity, dyslipidemia,
DM, past-history of CVD, unmet medical needs in the past year, health examination in the past 2 years;
†Defined as not participating or participating less than
150 minutes per week in moderate-to-vigorous physical activity;
‡Defined as taking over 2,000 mg/day.
participants, but not control rate (OR, 1.34; 95% CI, 0.57–3.18). Those who had experienced unmet medical needs in the past year were less likely to be aware (OR, 0.37; 95% CI, 0.14–
1.02), to be treated (OR, 0.32; 95% CI, 0.11–0.89), and to be controlled (OR, 0.32; 95% CI, 0.11–0.93) of hypertension.
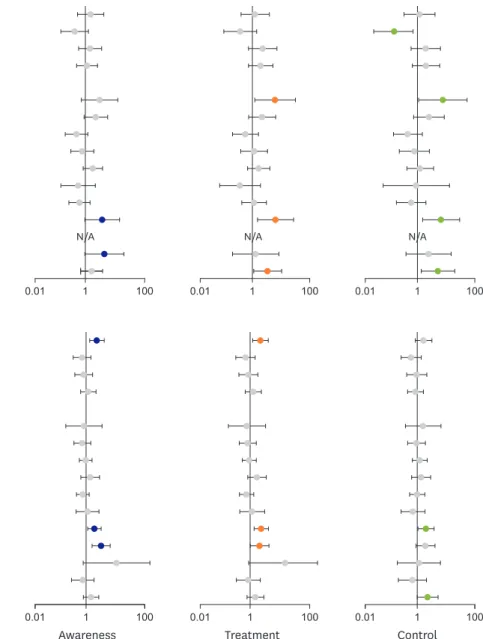
The results of stratified analysis by age group are presented in Figures 1 and 2. Among male participants aged 30–39 years, DM, and unmet medical needs in the past year were marginally associated with a higher proportion of hypertension awareness. The unemployment, DM, and health examination in the past 2 years were associated with both higher treatment
30–39 (years)
BMI ≥25.0 vs. <25.0 (kg/m
2) Urban vs. rural residents
Currently married (cohabitated) vs. not Under vs. over college graduate Occupation
Unemployed vs. white-collar Blue-collar vs. white-collar Current smoker vs. ex-/never-smoker Current drinker vs. non-drinker Physical inactivity* (yes vs. no) Sodium over-intake
†(yes vs. no) Dyslipidemia (yes vs. no) DM (yes vs. no)
Past-history of CVD (yes vs. no)
‡Unmet medical needs in the past year (yes vs. no) Health examination in the past 2 years (yes vs. no)
40–49 (years) BMI ≥25.0 vs. <25.0 (kg/m
2) Urban vs. rural residents
Currently married (cohabitated) vs. not Under vs. over college graduate Occupation
Unemployed vs. white-collar Blue-collar vs. white-collar Current smoker vs. ex-/never-smoker Current drinker vs. non-drinker Physical inactivity
†(yes vs. no) Sodium over-intake
‡(yes vs. no) Dyslipidemia (yes vs. no) DM (yes vs. no)
Past-history of CVD (yes vs. no)
Unmet medical needs in the past year (yes vs. no) Health examination in the past 2 years (yes vs. no)
1 100
0.01
Awareness Treatment Control
1 100
0.01 0.01 1 100
N/A
1 100
0.01 0.01 1 100 0.01 1 100
N/A N/A
Figure 1. Adjusted ORs (in log-scale) stratified by age group for hypertension awareness, treatment, and control status among Korean young male adults aged 30–49 years. The ORs were adjusted for age (continuous), obesity, region, marital status, education, occupation, smoking status, drinking status, physical inactivity, sodium over-intake, dyslipidemia, DM, past history of CVD, unmet medical needs in the past year, and health examination in the past 2 years.
BMI = body mass index; CVD = cardiovascular disease; DM = diabetes mellitus; N/A = not available; OR = odds ratio.
* Defined as not participating or participating less than 150 minutes per week in moderate-to-vigorous physical activity;
†Defined as taking over 2,000 mg/day;
‡
The estimates were not computed due to small sample size.
and control rates (Figure 1; Supplementary Table 8). Among the male participants in 40s, however, higher BMI (≥25.0 kg/m
2) and having dyslipidemia, DM had higher ORs for awareness, treatment, and control. Health examination in the past 2 years showed a higher likelihood of being controlled (Figure 1; Supplementary Table 9).
1 1,000
0.01 N/A N/A N/A
N/A
N/A
N/A
N/A N/A
N/A N/A
N/A N/A N/A
N/A N/A
40–49 (years)
Awareness Treatment Control
BMI ≥25.0 vs. <25.0 (kg/m
2) Urban vs. rural residents
Currently married (cohabitated) vs. not Under vs. over college graduate Occupation
Unemployed vs. white-collar Housewives vs. white-collar Blue-collar vs. white-collar Current smoker vs. ex-/never-smoker Current drinker vs. non-drinker Physical inactivity
†(yes vs. no) Sodium over-intake
‡(yes vs. no) Dyslipidemia (yes vs. no) DM (yes vs. no)
Past-history of CVD (yes vs. no)
Unmet medical needs in the past year (yes vs. no) Health examination in the past 2 years (yes vs. no)
1 1,000
0.01 0.01 1 1,000
1 1,000
0.01
30–39 (years)
Awareness Treatment Control
BMI ≥25.0 vs. <25.0 (kg/m
2) Urban vs. rural residents
Currently married (cohabitated) vs. not Under vs. over college graduate Occupation
Unemployed vs. white-collar
†Housewives vs. white-collar
†Blue-collar vs. white-collar
†Current smoker vs. ex-/never-smoker Current drinker vs. non-drinker Physical inactivity
†(yes vs. no) Sodium over-intake
‡(yes vs. no) Dyslipidemia (yes vs. no) DM (yes vs. no)
†Past-history of CVD (yes vs. no)
†Unmet medical needs in the past year (yes vs. no)
†Health examination in the past 2 years (yes vs. no)
1 1,000
0.01 0.01 1 1,000
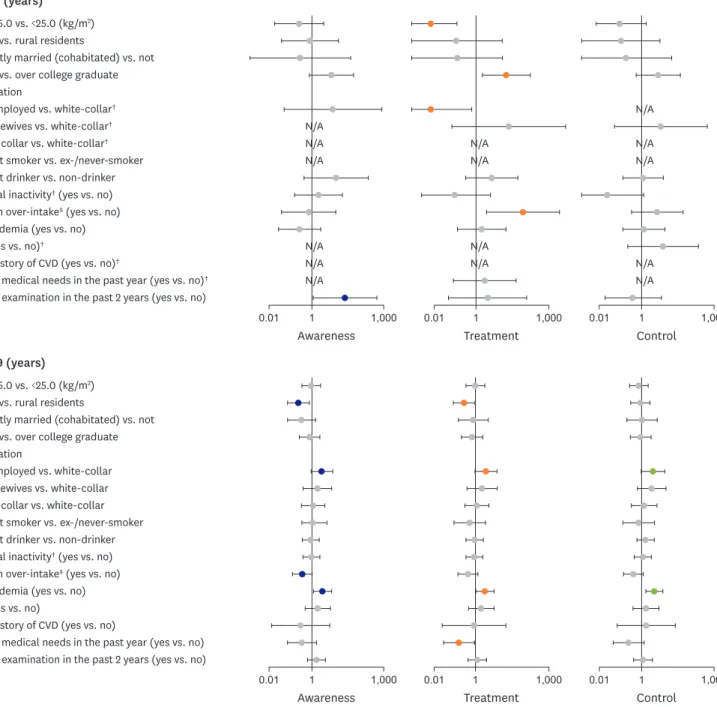
Figure 2. Adjusted ORs (in log-scale) stratified by age group for hypertension awareness, treatment, and control status among Korean young female adults aged 30–49 years. The ORs were adjusted for age (continuous), obesity, region, marital status, education, occupation, smoking status, drinking status, physical inactivity, sodium over-intake, dyslipidemia, DM, past history of CVD, unmet medical needs in the past year, and health examination in the past 2 years.
BMI = body mass index; CVD = cardiovascular disease; DM = diabetes mellitus; N/A = not available; OR = odds ratio.
* Defined as not participating or participating less than 150 minutes per week in moderate-to-vigorous physical activity;
†Defined as taking over 2,000 mg/day;
‡