Relationship between Shear Strength and Component Content of Fault Cores
15
0
0
전체 글
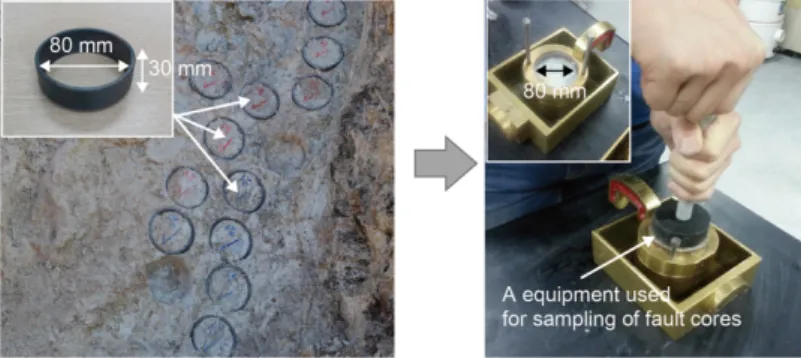
(2) 66. 윤현석 · 문성우 · 서용석. 다. 또한, 지구조적 작용 및 풍화 과정에 따라 구성 성분이 변형 및 변질되어 기반암과 다른 특성을 보이 고, 주변 암반에 비해 상대적으로 낮은 강도를 가진다 (Bieniawski, 1993; Norwegian Rock Mechanics Group, 2000; Riedmüller et al., 2001; Kahraman and Alber, 2006; Stille and Palmström, 2008). 특히, 암석의 파쇄 가 심할수록 구성 비율이 증가하는 단층 점토는 불연 속면 및 암반의 거동에 직접적인 영향을 미치는 것으 로 알려져 있다(Blenkinsop, 1991; An and Sammis, 1994; Woo, 2012). 또한, Henderson et al. (2010)은 노르웨이의 Basal 전단대에서 채취한 단층 각력을 대상 으로 실시한 링 전단시험으로부터 각력이 우세한 단층핵 이 기질이 우세한 단층핵에 비해 잔류 전단강도가 높다 는 연구 결과를 발표한 바 있다. 따라서 단층핵 구성물 질의 특성은 단층뿐만 아니라, 단층을 포함하고 있는 암 반의 거동을 규명하는 데 매우 중요한 요소 중 하나이다. 단층핵의 구성물질과 관련된 이전의 연구들은 마찰 거동에 대한 영향 인자(Morrow et al., 2000; Saffer and Marone, 2003; Moore and Lockner, 2004; Tesei et al., 2012)와 전단시험을 이용한 마찰계수 분 석(Ikari et al., 2007; Ikari et al., 2009; Haines, 2013)과 같이 주로 단층점토에 대한 실내시험을 통해 전단 특성에 미치는 영향을 분석하는 데 집중되어 있 다. 또한, Heilbronner and Keulen (2006)은 단층핵 입자의 불규칙한 형상이 전단강도를 저하시키는 경향 이 있다고 주장하였고, Abe and Mair (2009)는 수치 해석을 이용해 단층핵 구성 입자의 크기, 모양 및 배 열 등이 전단강도에 미치는 영향을 분석하는 등 단층 핵 내 입자 형상의 영향(Storti et al., 2003; Kim et al., 2016)과 수치해석을 이용한 연구(Mair and Abe, 2008; 2011) 등도 꾸준히 수행되고 있다. 이외에도 Brekke and Howard (1972)는 단층핵 내 구성 물질 이 암반의 거동에 미치는 영향을 분석하여 터널 굴착 시 발생될 수 있는 공학적 문제를 구분하여 설명하였 고, Stille and Palmström (2008)은 단층핵이 불균질 한 물질이고, 지질학적으로 매우 불확실한 요소들을 포 함하고 있기 때문에 구성 성분에 따라 다른 분석 결과 가 도출될 수 있다고 주장하였다. 이와 같이 많은 연 구자들은 지질공학적 문제를 발생시키는 주요 위해요 소 중 하나인 단층핵 구성물질의 특성을 규명하기 위 해 꾸준히 노력해왔다. 한편, Moon et al. (2014)과 Yun et al. (2015)은 국내 단층대에서 채취한 단층핵 시료를 대상으로 입도 와 전단강도 사이의 상관성을 분석한 바 있다. Moon. et al. (2014)은 단층핵에 대한 실내시험 결과를 바탕 으로 다중회귀분석을 통해 각력 및 점토의 함량과 수 직응력, 전단강도간의 상관관계식을 산정하였고, Yun et al. (2015)은 경주, 울산 지역에서 채취한 단층핵 시료를 대상으로 입도에 따른 단층핵의 전단강도 범위 를 제안하였다. 이 연구들은 단층핵의 각력 및 점토의 함량과 수직응력, 전단강도간의 관계식을 제안한 것으 로서 상대적으로 실내시험이 용이한 입도를 이용해 전 단강도를 간편하게 추정할 수 있는 장점이 있다. 그러 나 이 연구들은 분석에 이용된 시료의 수가 제한적이 고, 단층핵의 모암을 고려하지 않은 한계가 있다. 본 연구에서는 안산암질암, 화강암 및 퇴적암 단층 대에서 채취한 단층핵 시료를 대상으로 각력 및 점토 의 함량과 전단강도 사이의 상관성을 분석하였다. 이 를 위해 각 단층핵에 대한 직접전단시험과 입도시험으 로부터 산정된 결과를 바탕으로 단순회귀분석 및 다중 회귀분석을 실시하고, 전단강도에 미치는 각력 및 점토 의 영향을 비교·분석하였다. 또한, 각력 및 점토의 함량 과 전단강도 사이의 상관성을 분석함으로써 각 변수들 사이의 관계를 설명할 수 있는 회귀모형을 제안하였다.. 2. 단층핵의 시료 채취 및 산출상태 본 연구에 이용된 단층핵 시료는 총 179개(안산암질암 82개, 화강암 49개, 퇴적암 48개)로서 국내에 분포하는 단층대 32개 지점에서 채취하였다. 안산암질암 단층핵 시 료는 경북 경주, 양산 및 포항 등에 위치하는 단층대에 서 채취하였으며, 화강암은 울산과 경북 경주, 충남 논산 등에서 채취하였다. 퇴적암 단층핵 시료는 경북 영덕과 포항, 충북 단양 등에 위치하는 단층대에서 채취한 것으 로서, 대부분 이암과 셰일로 구성된 쇄설성 퇴적암이다. 시료 채취는 전단상자 규격(직경 80 mm, 높이 30 mm) 의 샘플러를 이용하였다(Fig. 1). 이 방법은 현장에서 채 취된 시료를 별도의 작업 없이 바로 직접전단시험에 이용함으로써 직접전단시험을 위한 시료 준비 과정 중 에 발생할 수 있는 시료의 교란을 최소화할 수 있다. 본 연구에서 이용된 단층핵 중 몇몇 시료의 야외 산 출상태를 암종별로 살펴보면, 경북 포항(양산 단층의 북쪽 지역)에 위치한 안산암질 단층핵은 노두 상에 발 달한 폭 약 1 m 내외의 단층대 내에 점토와 파쇄암 이 혼재되어 나타난다. 두께 10 cm 내외의 흰색 단층 점토 주변으로 회색의 단층점토 및 파쇄암이 분포하며, 부분적으로 직경 1~2 cm 내외의 각력을 포함하고 있 다(Fig. 2a). 특히, 흰색의 단층점토 우측부에 회색 단.
(3) 단층핵 구성물질의 함량과 전단강도 사이의 상관성 분석. 67. Fig. 1. Sample equipments used to minimize disturbance of fault core during specimens preparation for the direct shear test.. Fig. 2. Representative outcrop photographs of the fault cores used in this study. (a) and (b) in andesitic rock are composed of mixed gouge and cataclasite of various colors, and the fault breccia and damage zone are partially observed. (c) and (d) of granite in Ulsan Fault are developed with low dip of reddish brown and pinkish gouge with a maximum thickness of 30 cm, and no cataclasite or breccia is observed. (e) in the Cretaceous sedimentary rock is composed of whitish gouge and greenish gray cataclasite and (f) located in Danyang is contains dark gray to black gouge due to the influence of coaly shale.. 층점토와의 경계가 뚜렷이 관찰되는 것이 특징적이다. 경북 경주시 양북면에 위치한 단층핵의 경우 신생대. 제3기 장기통 범곡리층군에 속하는 곳으로 기반암은 안산암 및 응회암으로 구성되어 있다. 단층핵 부분은.
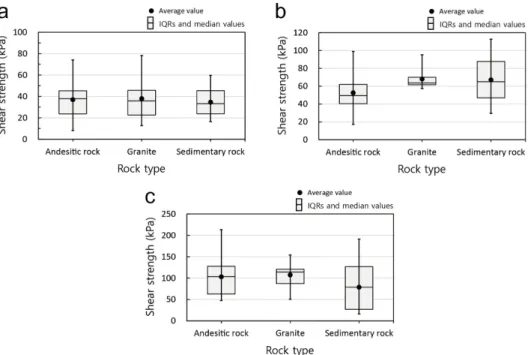
(4) 68. 윤현석 · 문성우 · 서용석. 암회색과 적색의 점토 및 파쇄암이 혼재되어 있고, 단 층핵 아래에 부분적으로 손상대(damage zone)가 관찰 된다(Fig. 2b). 손상대는 단층핵을 둘러싸고 있는 부분 으로서 단층대의 외곽부에 위치하며, 경우에 따라서는 Fig. 2b와 같이 명확한 경계 없이 단층핵과 혼재되어 나타나는 혼합대(mixed zone)로 나타난다(Caine et al., 1996; Heynekamp et al., 1999; Faulkner et al., 2003; Shipton et al., 2006). 또한 Fig. 2a와 달 리 암회색과 적색 단층점토 사이의 경계부가 명확히 구분되지 않는 것으로 보아 두 번 이상의 단층작용이 있었던 것으로 판단된다. Fig. 2c와 2d는 울산 단층대 내에 위치하는 화강암 단층핵으로서 최대 30 cm 두께의 점토층이 경사 20° 내외의 저각으로 발달하고 있다. 적갈색과 담홍색의 단 층점토가 교호하거나 혼재되어 분포하며, 파쇄암이나 각력 등은 관찰되지 않는다. Choi et al. (2015)은 이 단층점토에 대한 방사성 연대측정을 통해 최후기 단층 운동 시기를 3만 3천년전 이후라고 발표하였으며, 그 결과를 바탕으로 붕적층이 퇴적된 이후에도 반복적인 단층 운동을 겪었을 것으로 추론하였다. 이 화강암 단층핵으로부터 남동쪽으로 약 500 m 이 격된 곳에는 백악기 퇴적암이 위치하며, 이 퇴적암층 내에 수 cm 두께의 흰색 단층점토와 회녹색의 파쇄암. 이 혼재되어 산출된다(Fig. 2e). 충북 단양에 위치하는 단층핵은 기반암인 탄질 셰일의 영향으로 암회색 내지 검은색을 띄고 있으며, 두께 10 cm 내외의 점토를 함 유하고 있다(Fig. 2f). 단층핵 주변으로는 기반암과 손 상대가 혼재되어 분포한다.. 3. 실내시험 및 결과 3.1. 직접전단시험 및 전단강도 단층핵의 전단강도를 산정하기 위해 직접전단시험을 실시하였다(ASTM D 3080-11). 전단시험은 직경 80 mm, 높이 30 mm의 전단상자를 이용하였고, 수직응 력(σn) 54, 108, 162 kPa 하에서 실시되었다. 전단속 도는 ASTM에서 제시한 속도 범위인 시료 직경의 0.5~2.0%/min을 준용하여 1 mm/min으로 설정하였다. 한편, 동일한 지점에서 채취한 단층핵 시료라도 서론에 서 언급한 것처럼 각력의 모양, 크기, 입도 등에 따라 전 단강도가 다를 수 있다. 따라서 시험 결과 값의 오차를 최소화하기 위해 한 지점에서 다수의 시료를 채취하였 고, 각 수직응력마다 1~3회에 걸쳐 시험을 실시하였다. Fig. 3은 직접전단시험으로부터 산정된 각 수직응력 에서의 전단강도 범위를 상자그림(box pot)을 이용해 나타낸 것이다. 상자그림은 그룹별로 데이터의 양이 많. Fig. 3. Box plots for shear strength of fault cores in andesitic rock, granite, and sedimentary rock under normal stress (a) 54 kPa, (b) 108 kPa, and (c) 162 kPa. The gray boxes are IQRs (inter-quartile ranges)..
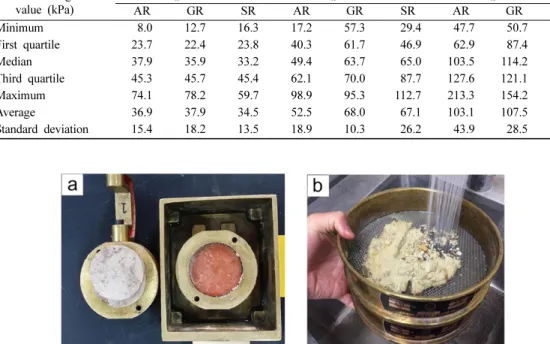
(5) 단층핵 구성물질의 함량과 전단강도 사이의 상관성 분석. 을 때 각 그룹의 사분위수 범위(interquartile range, 이하 IQR)와 수염범위(whisker range)를 비교함으로써 데이터의 분포를 쉽게 가시화할 수 있다(Tukey, 1970). 직접전단시험 결과, σn=54 kPa에서 전단강도의 IQR은 안산암질암에서 23.7~45.3 kPa, 화강암에서 22.4~45.7 kPa, 퇴적암에서 23.8~45.4 kPa로 세 암종 이 큰 차이를 보이지 않으며, 중앙값과 평균값도 서로 유 사한 것으로 나타났다(Fig. 3a; Table 1). σn=108 kPa 에서의 IQR은 σn=54 kPa에서와 달리 화강암에서 61.7~70.0 kPa로 가장 좁은 범위를 보이고, 퇴적암에서 46.9~87.7 kPa로 가장 넓은 범위를 보인다(Fig. 3b; Table 1). 그러나, 중앙값과 평균값은 화강암(각각 63.7 kPa와 68.0 kPa)과 퇴적암(각각 65.0 kPa과 67.1 kPa) 이 서로 유사하고, 안산암질암(각각 49.4 kPa와 52.5 kPa) 에서 가장 낮은 것으로 나타났다. σn=162 kPa에서도 IQR은 σn=108 kPa과 동일하게 화강암이 87.4~ 121.1 kPa로 가장 좁은 범위를 보이고, 퇴적암에서 27.1~126.8 kPa로 가장 넓은 범위를 보인다(Fig. 3c; Table 1). 퇴적암의 전단강도가 넓은 IQR을 보이는 것 은 다양한 퇴적 물질로부터 생성된 지질학적 기원의 특성상 화성 기원의 안산암질암 및 화강암에 비해 상. 69. 대적으로 구성 성분이 불균질하고 다양하기 때문인 것 으로 판단된다. σn=162 kPa에서의 중앙값과 평균값은 퇴적암에서 78.9 kPa로 안산암질암(각각 103.5 kPa와 103.1 kPa)과 화강암(각각 114.2 kPa와 107.5 kPa)에 비해 상대적으로 낮은 것으로 나타났다. 각 암종에서 의 전단강도 산정 결과는 Table 1에 요약하였다. 3.2. 입도분석 입도분석은 직접전단시험이 완료된 각 단층핵 시료 를 대상으로 실시되었다(Fig. 4a). 입도분석 시험은 건 조 시 점토물질이 덩어리로 뭉쳐지는 현상을 최소화하 고, 각 구성물질들을 확실히 분리하기 위해 체분석 방 법(ASTM D422-63)과 흙의 씻기 시험방법(ASTM D1140-17)을 함께 적용하였다(Fig. 4b). 또한, 각력의 크 기는 지질학 분야에서 연구자마다 직경 0.1~0.5 mm 로 다르게 정의하고 있고(Spry, 1969; Higgins, 1971; Laznicka, 1988; Snoke et al., 1998; Clark and James, 2003; Koša et al., 2003; North American Geologic-map Data Model Science Language Technical Team, 2004; Woodcock and Mort, 2008), 명확한 기준이 없는 실정이기 때문에 토질분야에서 흔히 이용. Table 1. Shear strength values of fault cores in andesitic rock, granite, and sedimentary rock under normal stress (σn) 54 kPa, 108 kPa, and 162 kPa. Abbreviations of rock type are as follows: andesitic rock (AR), granite (GR), and sedimentary rock (SR) Shear strength value (kPa) Minimum First quartile Median Third quartile Maximum Average Standard deviation. AR 8.0 23.7 37.9 45.3 74.1 36.9 15.4. σn=54 kPa GR 12.7 22.4 35.9 45.7 78.2 37.9 18.2. SR 16.3 23.8 33.2 45.4 59.7 34.5 13.5. AR 17.2 40.3 49.4 62.1 98.9 52.5 18.9. σn=108 kPa GR SR 57.3 29.4 61.7 46.9 63.7 65.0 70.0 87.7 95.3 112.7 68.0 67.1 10.3 26.2. AR 47.7 62.9 103.5 127.6 213.3 103.1 43.9. σn=162 kPa GR SR 50.7 16.4 87.4 27.1 114.2 78.9 121.1 126.8 154.2 191.1 107.5 78.9 28.5 58.1. Fig. 4. Photographs showing (a) a fault core specimen after the direct shear test and (b) the procedure of sieve test (using sieve No. 4 and No. 200) and soil washing test..
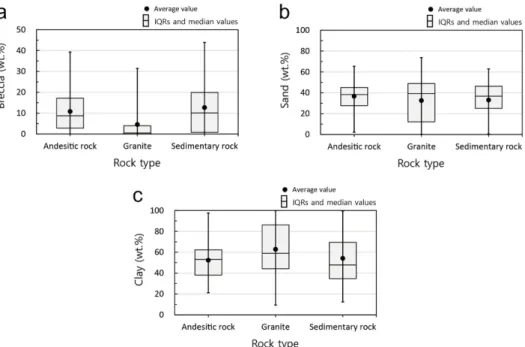
(6) 70. 윤현석 · 문성우 · 서용석. 되는 흙의 통일분류법(ASTM 2487-17)을 바탕으로 구 분되었다. 이 방법은 국제적으로 통일된 분류방법 중 하나로서 토질 및 지질공학 분야에서 쉽게 활용할 수 있는 장점이 있다. 따라서, ASTM의 기준에 따라 No.4 체와 No.200체를 이용하여 각력(≥4.75 mm), 모 래(4.75~0.075 mm), 점토(≤0.075 mm)로 각각 분류 하였다. 입도분석 결과, 단층핵 내 각력의 함량은 안선암질 암과 퇴적암에서 각각 최대 39.3 wt.%와 43.9 wt.% 로 산정되었으나, IQR은 각각 2.8~17.2 wt.%, 0.8~ 19.9 wt.%로 대부분 20.0 wt.% 이하의 함량을 보인다 (Fig. 5a; Table 2). 화강암은 IQR이 0.0~4.0 wt.%로 세. 암종 중 가장 적은 각력을 포함하고 있으며, 중앙값과 평균값(각각 0.5 wt.%와 4.6 wt.%)도 가장 적은 것으로 나타났다. 반면, 점토의 함량에 대한 IQR은 화강암에서 44.2~86.2 wt.%로 가장 넓은 범위를 보이고, 중앙값과 평균값도 화강암에서 각각 59.1 wt.%와 62.8 wt.%로 가장 높게 산정되었다(Fig. 5c; Table 2). 모래의 IQR 은 화강암에서 12.1~48.9 wt.%로 가장 넓은 범위에 분포하나, 중앙값과 평균값은 세 암종이 유사한 값을 보인다(Fig. 5b; Table 2). 점토 함량의 최댓값은 안산 암질암에서 97.6 wt.%, 화강암에서 99.8 wt.%, 퇴적 암에서 99.5 wt.%로 100 wt.%에 근접한 값을 보인다. 각 암종에서의 입도분석 결과는 Table 2에 요약하였다.. Fig. 5. Box plots for particle size of fault cores in andesitic rock, granite, and sedimentary rock. The gray boxes are IQRs (inter-quartile ranges). Table 2. Results of particle size analysis for fault cores in andesitic rock, granite, and sedimentary rock. Abbreviations of rock type are as follows: andesitic rock (AR), granite (GR), and sedimentary rock (SR) Results of particle size analysis (wt.%) Minimum First quartile Median Third quartile Maximum Average Standard deviation. AR 0.0 2.8 8.8 17.2 39.3 10.8 9.7. Breccia (≥4.75 mm) GR SR 0.0 0.0 0.0 0.8 0.5 10.1 4.0 19.9 31.4 43.9 4.6 12.7 8.5 13.2. Sand (4.75~0.075 mm) AR GR SR 2.3 0.2 0.5 27.7 12.1 25.1 38.3 39.2 36.8 45.0 48.9 46.3 65.4 73.7 62.9 36.7 32.6 33.1 13.0 22.2 18.7. AR 21.2 38.2 53.2 62.3 97.6 52.4 17.6. Clay (≤0.075 mm) GR 9.5 44.2 59.1 86.2 99.8 62.8 27.1. SR 12.4 34.7 47.9 69.5 99.5 54.2 26.9.
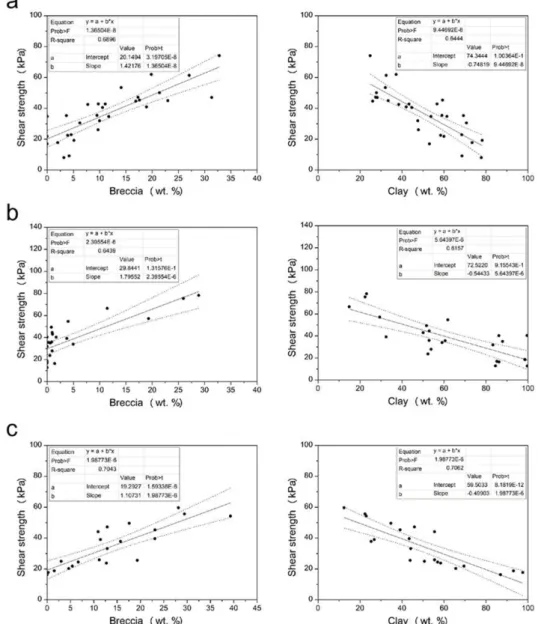
(7) 단층핵 구성물질의 함량과 전단강도 사이의 상관성 분석. 4. 회귀분석 단층핵 내 각력 및 점토의 함량과 전단강도 사이의 상관성을 분석하기 위해 직접전단시험과 입도분석 결 과를 이용하여 회귀분석을 실시하였다. 회귀분석은 각 변수들 사이의 관계를 설명함으로써 상관성을 규명할 수 있는 통계학적 방법이다. 본 절에서는 각력 및 점 토의 함량과 전단강도 사이의 상관성을 다각적으로 분. 71. 석하기 위해 단순회귀분석과 다중회귀분석을 수행하였 다. 회귀분석은 데이터 분석 소프트웨어인 Origin과 통 계 소프트웨어인 SPSS (statistical package for the social science)를 이용하였다. 4.1. 단순회귀분석 Figs. 6~8은 각 수직응력(σn=54, 108, 162 kPa)에 서의 암종별 각력의 함량과 전단강도, 점토의 함량과. Fig. 6. Results of simple regression analysis between the shear strength and content of breccia and clay in (a) andesitic rock, (b) granite, and (c) sedimentary rock under normal stress 54 kPa. The dotted lines are the UCI (upper confidence interval) and LCI (lower confidence interval) for 95% confidence Interval..
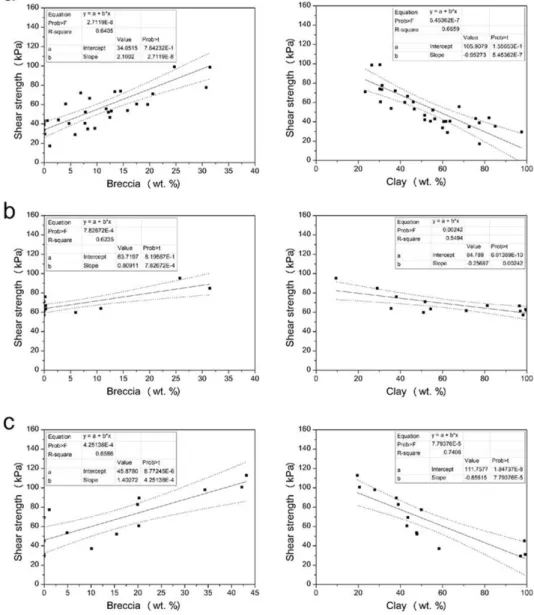
(8) 72. 윤현석 · 문성우 · 서용석. 전단강도 사이의 관계를 나타낸 그래프로서, 단순회귀 분석 결과와 결정계수(coefficient of determination, R-squared), 95% 신뢰구간(confidence interval)을 함 께 도시하였다. 결정계수는 회귀식의 적합도를 나타내 는 방법으로 회귀모형에 의해 설명되는 변동이 전체 변동에서 차지하는 상대적인 크기를 나타낸 것이다. 즉, 결정계수가 클수록 회귀모형에서의 각 독립변수(각력 및 점토함량)가 결정계수(전단강도)를 잘 설명한다고. 할 수 있다. 신뢰 구간은 실내시험으로부터 획득한 전 단강도 값과 회귀식으로부터 추정된 전단강도 값의 표 준편차를 이용하여 결정되는 것으로서, 회귀모형을 만족 하는 데이터를 확률(95%)로 계산하여 상한(UCI, upper confidence interval)과 하한(LCI, lower confidence interval)을 설정한 것이다. 분석 결과, 모든 수직응력에서 단층핵의 전단강도는 각력의 함량이 증가할수록 증가하며, 점토의 함량이 증. Fig. 7. Results of simple regression analysis between the shear strength and content of breccia and clay in (a) andesitic rock, (b) granite, and (c) sedimentary rock under normal stress 108 kPa. The dotted lines are the UCI (upper confidence interval) and LCI (lower confidence interval) for 95% confidence Interval..
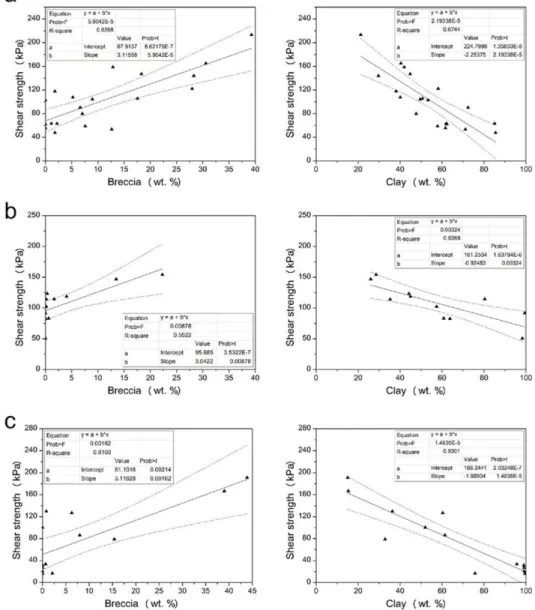
(9) 단층핵 구성물질의 함량과 전단강도 사이의 상관성 분석. 가할수록 낮아지는 경향을 보인다(Figs. 6~8). 결정계수 는 σn=108 kPa일 때의 화강암 점토와 σn=162 kPa 일 때의 화강암 각력에서 각각 0.549, 0.552로 산정되 어 다른 암종에 비해 상대적으로 낮은 상관성을 보이 지만(Figs. 7b and 8b), 그 외에는 0.610~0.830으로 산정되어 단층핵의 불균질성을 고려했을 때 비교적 높 은 상관성을 보이는 것으로 나타났다. 각 수직응력에. 73. 서 암종별 결정계수를 비교하면, σn=54 kPa과 σn=108 kPa일 때, 각력의 경우 퇴적암이 각각 0.704, 0.659로 세 암종 중 가장 높은 결정계수를 보이며, 점토 에서도 퇴적암이 가장 높은 결정계수를 보인다(Fig. 9). σn=162 kPa에서는 각력의 경우 안산암질암에서 0.637, 점토는 퇴적암에서 0.830으로 가장 높은 결정계 수를 보인다. 반면, 화강암은 각 수직응력에서 각력과. Fig. 8. Results of simple regression analysis between the shear strength and content of breccia and clay in (a) andesitic rock, (b) granite, and (c) sedimentary rock under normal stress 162 kPa. The dotted lines are the UCI (upper confidence interval) and LCI (lower confidence interval) for 95% confidence Interval..
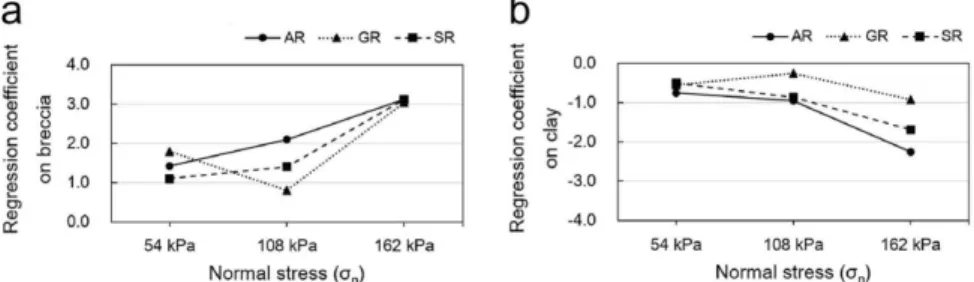
(10) 74. 윤현석 · 문성우 · 서용석. Fig. 9. Comparative analysis of coefficients of determination (R²) estimated from simple regression analysis.. Fig. 10. Comparative analysis of the regression coefficients on content of (a) breccia and (b) clay in each normal stress (σn=54, 108, and 162 kPa) estimated from simple regression analysis. Abbreviations of rock type are as follows: andesitic rock (AR), granite (GR), and sedimentary rock (SR).. 점토 모두 가장 낮은 결정계수를 보여 다른 암종에 비 해 상대적으로 낮은 상관성을 보인다. 또한, 수직응력 이 54, 108, 162 kPa로 증가할수록 각력의 함량과 전 단강도 사이의 결정계수는 감소하지만, 점토의 함량과 전단강도 사이의 결정계수는 화강암의 σn=108 kPa을 제외하고 증가하는 경향을 보인다(Fig. 9). 한편, 단순회귀분석에서 전단강도에 미치는 영향을 보 여주는 각력과 점토의 회귀계수(Figs. 6~8의 slope)를 비 교하면, 화강암 각력의 회귀계수가 수직응력 108 kPa 에서 약 0.81로 다른 수직응력에서의 회귀계수에 비해 낮은 값을 보일 뿐(Fig. 7b; Fig. 10a), 안산암질암과 퇴적암에서 각력의 회귀계수는 수직응력이 증가할수록 큰 값을 가진다(Fig. 10a). 또한, 점토의 회귀계수는 세 암석 모두에서 수직응력이 증가함에 따라 커지는 것으 로 분석되었다(Fig. 10b). 이는 각력과 점토 함량의 작 은 변화에도 전단강도 값이 크게 달라진다는 것으로서, 수직응력이 클수록 각력과 점토 함량의 변화가 전단강 도에 큰 영향을 미친다는 것을 의미한다. 결과적으로, 안산암질암, 화강암 및 퇴적암에서 단층 핵의 전단강도는 각력의 함량과 비례적인 관계이고, 점 토의 함량과는 반비례 관계를 보인다. 또한, 전단강도 는 수직응력이 증가할수록 각력보다 점토에서 높은 상 관성을 보이고, 회귀계수의 변화를 볼 때, 수직응력이. 증가할수록 각력과 점토의 함량에 더 민감하게 반응하 는 것으로 분석되었다. 4.2. 다중회귀분석 상기의 단순회귀분석에서 각력과 점토는 모두 전단 강도에 영향을 미치는 것으로 분석되었다. 그러나 이 2개의 변수가 전단강도에 동시에 미치는 영향을 단순 회귀분석만으로 설명하기 어렵다. 따라서 전단강도에 대한 각력과 점토 함량의 영향을 동시에 고려하기 위 해 다중회귀분석을 실시하였다. 다중회귀분석은 일반적 인 단순회귀모형과 비슷하나 독립변수가 다수일 때, 각 독립변수들이 종속변수에게 동시에 미치는 영향을 모 델화할 수 있는 장점이 있다. 본 연구에서 각력의 함 량( x1 )과 점토의 함량( x2 )을 독립변수로 하고, 전단강 도를 종속변수( yˆ )로 하는 다중회귀분석 모형의 형태는 다음과 같다. yˆ = b0 + b1x1 + b2x2 여기서, b0 는 각 독립변수(각력과 점토의 함량)가 변하지 않더라도 일반적으로 종속변수(전단강도)가 갖 는 값(절편), b1 과 b2 는 각 독립변수들이 종속변수에 미치는 영향이다..
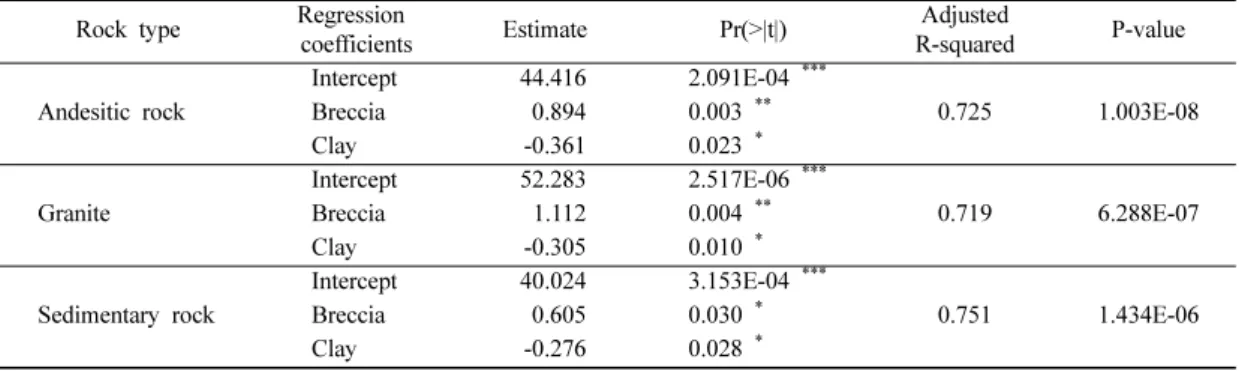
(11) 단층핵 구성물질의 함량과 전단강도 사이의 상관성 분석. Tables 3~5는 각 수직응력에서 암종별로 산정된 다 중회귀분석 결과로서, 단층핵의 전단강도에 미치는 각 력과 점토의 영향을 나타내는 계수(estimate)와 회귀식. 75. 의 결정계수(R-squared), 그리고 산정된 각 회귀계수 및 회귀식들의 적합성을 보여주는 유의확률(Pr과 Pvalue)을 요약한 것이다. 유의확률은 가설 검정에 대한. Table 3. Results of the multiple regression analysis showing the regression coefficients of the independent variables (breccia and clay) for each rock type under normal stress 54 kPa Regression Estimate coefficients Intercept 44.416 Breccia 0.894 Andesitic rock Clay -0.361 Intercept 52.283 Granite Breccia 1.112 Clay -0.305 Intercept 40.024 Sedimentary rock Breccia 0.605 Clay -0.276 Pr(>|t|) : 0 < *** < 0.001 < ** < 0.01 < * < 0.05 < . < 0.1 < ※signif. : p-value < 0.05 Rock type. Adjusted R-squared. Pr(>|t|). P-value. ***. 2.091E-04 0.003 ** 0.725 0.023 * 2.517E-06 *** 0.004 ** 0.719 0.010 * 3.153E-04 *** 0.030 * 0.751 0.028 * < 1 (signif. : < 0.05.). 1.003E-08. 6.288E-07. 1.434E-06. Table 4. Results of the multiple regression analysis showing the regression coefficients of the independent variables (breccia and clay) for each rock type under normal stress 108 kPa Regression Estimate coefficients Intercept 70.304 Breccia 0.979 Andesitic rock Clay -0.504 Intercept 73.288 Granite Breccia 0.544 Clay -0.125 Intercept 87.883 Sedimentary rock Breccia 0.620 Clay -0.578 Pr(>|t|) : 0 < *** < 0.001 < ** < 0.01 < * < 0.05 < . < 0.1 < ※signif. : p-value < 0.05 Rock type. Pr(>|t|). Adjusted R-squared. P-value. 0.762. 3.376E-10. 0.630. 2.000E-03. 0.753. 1.815E-04. ***. 3.462E-09 0.001 ** 2.121E-04 *** 2.976E-07 *** 0.050 • 0.163 2.661E-04 *** 0.131 0.023 * < 1 (signif. : < 0.05.). Table 5. Results of the multiple regression analysis showing the regression coefficients of the independent variables (breccia and clay) for each rock type under normal stress 162 kPa Regression Estimate coefficients Intercept 158.853 Breccia 1.812 Andesitic rock Clay -1.426 Intercept 137.995 Granite Breccia 1.707 Clay -0.639 Intercept 165.198 Sedimentary rock Breccia 0.711 Clay -1.431 Pr(>|t|) : 0 < *** < 0.001 < ** < 0.01 < * < 0.05 < . < 0.1 < ※signif. : p-value < 0.05 Rock type. Pr(>|t|). Adjusted R-squared. 2.432E-06 *** 0.002 ** 0.797 0.001 ** 5.511E-05 *** 0.094 • 0.687 0.036 * 3.276E-04 *** 0.397 0.811 0.003 ** < 1 (signif. : < 0.05.). P-value 5.084E-07. 4.000E-03. 9.702E-05.
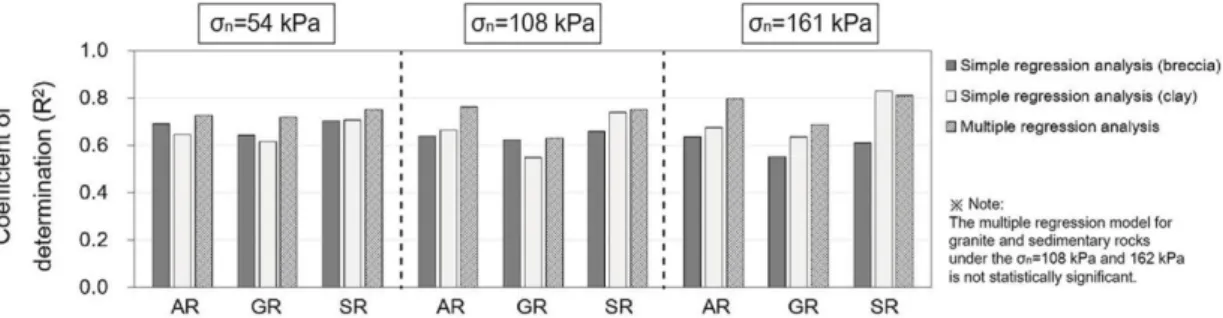
(12) 76. 윤현석 · 문성우 · 서용석. 오류의 가능성을 나타내는 지수로서, 산정된 회귀식 및 회귀계수들에 대한 판단이 잘못될 가능성, 즉, 회귀모 형의 적합도를 판단할 수 있는 기준이다. 일반적으로 유의확률은 유의수준(significance level) 0.05 이하일 때 적합하다고 판단하며, 이는 오류를 최대 5%까지 허 용하겠다는 의미로 매우 보수적인 범위에 속한다. 각 수직응력에서의 결정계수는 σn=54 kPa일 때,. σn=108 kPa과 σn=162 kPa에서 화강암 및 퇴적암에 대한 다중회귀모형의 적합성을 논의하기 위해서는 단 층핵 시료에 대한 추가적인 분석이 필요할 것으로 판 단된다.. 0.719~0.751, σn=108 kPa일 때, 0.630~0.762, σn= 162 kPa일 때, 0.687~0.811로 산정되어 다중회귀분석 에서도 높은 상관성을 보인다(Tables 3~5). 각력과 점 토에 대한 회귀계수를 비교하면, σn=54 kPa일 때 안. Fig. 11은 각 수직응력에서 단순회귀분석과 다중회 귀분석을 통해 산정된 각 회귀모형들의 암종별 결정계 수를 비교한 그래프이다. 단순회귀모형들만 살펴보면, σn=54 kPa일 때 안산암에서의 각력과 점토의 결정계. 산암질암에서 각각 0.894와 –0.361, 화강암에서 각각 1.112와 –0.305, 퇴적암에서 각각 0.605와 –0.276으로 각력의 회귀계수가 점토보다 큰 값을 가진다(Table 3). 따라서 각력과 점토의 함량을 동시에 고려했을 때, 전 단강도는 점토보다 각력에 더 민감하게 반응하는 것으 로 나타났다. σn=108 kPa에서의 회귀계수도 모든 암. 수는 각각 0.690과 0.644, 화강암에서 각각 0.644와 0.616으로 산정되어 각력이 점토보다 높은 상관성을 보 이지만, 퇴적암에서는 점토(R²=0.706)가 각력(R²=0.704) 보다 약간 높은 상관성을 보인다. 또한, σn=108, 162 kPa에서 결정계수는 σn=108 kPa의 화강암에서만 각력(R²=0.624)이 점토(R²=0.549)보다 높고, 그 외에 는 모두 점토의 결정계수가 각력보다 높은 것으로 나 타났다. 결과적으로, σn=54 kPa일 때의 안산암질암과. 종에서 각력이 점토보다 큰 값을 가지나, 화강암의 경 우 각력과 점토에 대한 회귀계수의 유의확률(Pr)이 각 각 0.050, 0.163으로 유의순준 0.05 이상이기 때문에 회귀식에 대한 적합성이 떨어진다(Table 4). 화강암 회 귀식의 유의확률(p-value)은 2.0×10⁻³으로 유의수준을 만족하지만, 각 회귀계수의 유의확률이 유의수준을 만 족하지 않기 때문에 통계적으로 의미가 없다. 따라서 σn=108 kPa에서의 화강암 다중회귀모형은 적용할 수 없다. σn=108 kPa에서의 퇴적암과 σn=162 kPa의 화강암, 퇴적암에서도 회귀식은 유의수준을 만족하지만, 각력 함량에 대한 회귀계수의 유의확률이 모두 0.05 이상이기 때문에 다중회귀모형을 적용하기 곤란하다 (Tables 4 and 5). 이러한 원인은 일반적으로 회귀분석 에 이용한 데이터의 편차가 크거나, 데이터의 수가 너 무 적기 때문에 발생하는 것으로 알려져 있다. 따라서. 5. 회귀모형의 제안. 화강암, σn=108 kPa일 때의 화강암을 제외하면, 단순 회귀모형을 이용한 전단강도의 산정은 점토의 함량을 이용하는 것이 더 적합한 것으로 분석되었다. 다중회귀모형에서는 화강암의 결정계수가 각 수직응 력에서 0.719, 0.630, 0.687로 산정되어 단순회귀분석 결과와 동일하게 세 암종 중 가장 낮은 상관성을 보인 다(Fig. 11). 또한, σn=162 kPa의 퇴적암을 제외한 모든 다중회귀모형에서 단순회귀모형보다 높은 결정계 수를 보여 각력과 점토의 함량을 동시에 고려할 때 전 단강도와 높은 상관성을 보이는 것으로 나타났다. 그 러나 4.2절에서도 언급하였듯이 다중회귀모형 중 σn=108, 162 kPa에서의 화강암과 퇴적암은 통계적으로 신뢰도가 떨어지기 때문에 전단강도를 산정하는 데 있어. Fig. 11. Comparative analysis of coefficients of determination (R²) estimated from simple regression analysis and multiple regression analysis. Abbreviations of rock type are as follows: andesitic rock (AR), granite (GR), and sedimentary rock (SR)..
(13) 단층핵 구성물질의 함량과 전단강도 사이의 상관성 분석. 77. Table 6. Regression equations for the shear strength of fault core estimated by simple regression analysis and multiple regression analysis Normal stress. Rock type Regression equation Andesitic rock τ =0.894x1−0.361x2+44.416 σn=54 kPa Granite τ =1.112x1−0.305x2+52.283 Sedimentary rock τ =0.605x1−0.276x2+40.024 Andesitic rock τ =0.979x1−0.504x2+70.304 σn=108 kPa Granite τ =0.809x1+63.720 Sedimentary rock τ =−0.856x2+111.758 Andesitic rock τ =1.812x1−1.426x2+158.853 σn=162 kPa Granite τ =−0.925x2+161.250 Sedimentary rock τ =−1.689x2+188.244 ※Note: τ=shear strength of fault core, x1=content of breccia, and x2=content of clay. 적합하지 않은 모형들이다. 따라서 이 4개 모델들의 전 단강도를 산정하기 위해서는 단순회귀모형을 이용하는 것이 타당하다. σn=108 kPa의 화강암은 단순회귀모형 중 각력이 점토보다 높은 결정계수를 보이기 때문에 각 력을 이용하여 전단강도를 산정하는 것이 더 적합하고, 이외의 모델들은 각력보다 점토를 이용한 단순회귀모형 이 더 적합한 것으로 판단된다. 상기의 분석 결과를 바 탕으로 각 수직응력과 암종에서 단층핵의 전단강도를 산정하는 데 가장 적합한 회귀모형을 Table 6에 요약 하였다. 제안된 모형들은 결정계수 0.624~0.830으로 높은 상관성을 보인다.. 6. 결. 론. 국내에 분포하는 안산암질암, 화강암 및 퇴적암 단 층대에서 채취한 단층핵을 대상으로 각력 및 점토의 함량과 전단강도 사이의 상관성을 분석하기 위해 단순 회귀분석과 다중회귀분석을 실시하였다. 직접전단시험으로부터 산정된 전단강도를 분석한 결 과, σn=54 kPa 하에서는 세 암종에서 모두 유사하며, σn=108 kPa인 경우 안산암질암에서 가장 낮은 중앙값 과 평균값을 보인다. 반면, σn=162 kPa에서의 중앙값 과 평균값은 안산암질암과 화강암이 유사하고 퇴적암 에서 가장 낮게 산정되었다. 각력 함량은 안산암질암 과 퇴적암에서 대부분 20 wt.% 이하이고, 화강암은 대부분 4.0 wt.% 이하로 분석되었다. 반면, 점토 함량 은 화강암이 다른 암종에 비해 많은 것으로 나타났다. 단순회귀분석을 이용하여 각력 및 점토 함량과 전단 강도 사이의 상관성을 분석한 결과, 전단강도는 각력 의 함량과 비례 관계를 보이며, 점토의 함량과 반비례 관계를 보인다. 각 암종별 전단강도는 σn=54 kPa일 때. R-squared 0.725 0.719 0.751 0.762 0.624 0.741 0.797 0.637 0.830. 안산암질암과 화강암, σn=108 kPa일 때 화강암을 제외 하면, 대부분 각력보다 점토에서 높은 상관성을 보인다. 또한, 수직응력이 증가할수록 결정계수는 각력의 경우 낮아지고, 점토에서 높아지는 경향을 보인다. 각력과 점토 함량의 변화가 전단강도에 미치는 영향은 수직응 력이 낮을 때보다 높을 때 더 큰 것으로 분석되었다. 다중회귀분석을 통해 각력과 점토가 동시에 전단강 도에 미치는 영향을 분석한 결과, 각력에 대한 회귀계 수가 점토보다 높은 값을 보여 각력 함량의 변화에 더 민감하게 반응하는 것으로 분석되었다. 또한, 통계적으 로 적합하지 않은 몇몇 모형을 제외하면, 다중회귀모 형들의 결정계수는 단순회귀모형보다 높은 값을 보인 다. 따라서 단층핵의 전단강도는 각력과 점토의 함량 을 동시에 고려할 때 높은 상관성을 보이는 것으로 나 타났다. 단순회귀분석과 다중회귀분석으로부터 산정된 회귀 모형들의 결정계수를 암종별로 비교·분석하여 단층핵의 전단강도를 산정하는 데 가장 적합한 회귀모형을 제안 하였고, 제안된 모형들은 0.624~0.830으로 높은 결정 계수를 보인다. 본 연구에서 단층핵의 전단강도는 각력 및 점토의 함량뿐만 아니라, 수직응력, 암종 등에 의해 달라질 수 있는 것으로 분석되었다. 그러나 서론에서 언급하였듯 이, 단층핵의 전단강도는 각력 및 점토함량 외에도 다 른 요소에 의해 달라질 수 있기 때문에 향후 다양한 영향 인자에 대한 연구가 필요할 것으로 판단된다. 단, 낮은 강도로 인해 실험적인 분석에 많은 제약이 있는 단층핵의 특성을 고려한다면, 본 연구의 분석 결과는 상대적으로 시료 채취 및 시험이 간편한 입도분석을 이용함으로써 전단강도를 추정할 수 있는 유용한 자료 가 될 수 있을 것이다..
(14) 78. 윤현석 · 문성우 · 서용석. 사. 사. 이 논문은 2017년도 정부(교육부)의 재원으로 한국 연구재단의 지원을 받아 수행된 기초연구사업임(No. 2017R1A6A3A01011979). 이 논문은 2018년 대한민국 교육부의 재원으로 충북대학교 연수연구원 사업의 지 원을 받아 연구되었음.. References Abe, S. and Mair, K. (2009) Effects of gouge fragment shape on fault friction: New 3D modelling results. Geophysical Research Letters, v.36, L23302. An, L.J. and Sammis, C.G. (1994) Particle size distribution of cataclastic fault materials from southern California A 3-D study. Pure and Applied Geophysics, v.143, p.203-227. ASTM D1140-17 (2017) Standard test methods for determining the amount of material finer than 75-μm (No. 200) sieve in soils by washing. West Conshohocken, PA, 2017, DOI: 10.1520/D1140-17. ASTM D422-63 (2007) Standard test method for particlesize analysis of soils. ASTM International, West Conshohocken, PA, 2007, DOI: 10.1520/D042263R07E02. ASTM D2487-17 (2017) Standard practice for classification of soils for engineering purposes (Unified Soil Classification System). ASTM International, West Conshohocken, PA, 2017, DOI: 10.1520/D2487-17. ASTM D3080 / D3080M-11 (2011) Standard test method for direct shear test of soils under consolidated drained conditions. ASTM International, West Conshohocken, PA, 2011, DOI: 10.1520/D3080_D3080M-11. Bieniawski, Z.T. (1993) Classification of rock masses for engineering: The RMR system and future trend, In: Hudson, J.A. (Eds.). Comprehensive Rock Engineering, New York, Pergamon Press, v.3, p.553-574. Blenkinsop, T.G. (1991) Cataclasis and processes of particle size reduction. Pageoph, v.136, p.59-86. Brekke, T.L. and Howard, T.R. (1972) Stability problems caused by seams and faults. In Proceedings of the First North American Rapid Excavation and Tunnelling Conference, New York: AIME, p.25-41. Caine, J.S., Evans, J.P. and Forster, C.B. (1996) Fault zone architecture and permeability structure. Geology, v.24, p.1025-028. Choi, J.H., Kim, Y.S., Gwon, S.H., Paul, E., Sowreh, R., Kim T.H. and Lim S.B. (2015) Characteristics of large-scale fault zone and quaternary fault movement in Maegok-dong, Ulsan. Journal of Engineering Geology, v.25, p.485-498. Clark, C. and James, P. (2003) Hydrothermal brecciation due to fluid pressure fluctuations: examples from the Olary Domain, SouthAustralia. Tectonophysics, v.366, p.187-206. Faulkner, D.R., Lewis, A.C. and Rutter, E.H. (2003) On the internal structure and mechanics of large strike-. slip fault zones: field observations of the Carboneras fault in southeastern Spain. Tectonophysics, v. 367, p.235-251. Gudmundsson, A., Simmenes, T.H., Belinda, L. and Philipp, S.L. (2010) Effects of internal structure and local stresses on fracture propagation, deflection, and arrest in fault zones. Journal of Structural Geology, v.32, p.1643-1655. Haines, S.H., Kaproth, B., Marone, C., Saffer, D. and van der Pluijm, B. (2013) Shear zones in clay-rich fault gouge: A laboratory study of fabric development and evolution. Journal of Structural Geology, v.51, p.206225. Heilbronner, R. and Keulen, N. (2006) Grain size and grain shape analysis of fault rocks. Tectonophysics, v.427, p.199-216. Henderson, I.H.C., Ganerod, G.V. and Braathen, A. (2010) The relationship between particle characteristics and frictional strength in basal fault breccias: Implications for fault-rock evolution and rockslide susceptibility. Tectonophysics, v.486, p.132-149. Heynekamp, M.R., Goodwin, L.B., Mozley, P.S. and Haneberg, W.C. (1999) Controls on fault-zone architecture in poorly lithified sediments, Rio Grande Rift, New Mexico: implications for faultzone permeability and fluid flow. In: Haneberg, W.C., Mozley, P.S., Moore, J.C. and Goodwin, L.B. (Eds.), Faults and Subsurface Fluid Flow in the Shallow Crust. American Geophysical Union Geophysical Monograph, v.113, p.27-50. Higgins, M.W. (1971) Cataclastic rocks. United States Geological Survey Professional Paper, v.687, p.97. Ikari, M.J., Saffer, D.M. and Marone, C. (2007) Effect of hydration state on the frictional properties of montmorillonite-based fault gouge. Journal of Geophysical Research, v.112, B06423. Ikari, M.J., Saffer, D.M., and Marone, C. (2009) Frictional and hydrologic properties of clay-rich fault gouge. Journal of Geophysical Research, v.114, B05409. Kahraman, S. and Alber, M. (2006) Estimating unconfined compressive strength and elastic modulus of a fault breccia mixture of weak blocks and strong matrix. International Journal of Rock Mechanics and Mining Sciences, v.43, p.1277-1287. Kim, K.Y., Suh, H.S., Yun, T.S., Moon, S.W. and Seo, Y.S. (2016) Effect of particle shape on the shear strength of fault gouge, Geosciences Journal. v.20, p.351-359. Koša, E., Hunt, D., Fitchen, W.M., Bockel-rebelle, M.O. and Roberts, G. (2003) The heterogeneity of palaeocavern systems developed along syndepositional fault zones: the Upper Permian Capitan Platform, Guadalupe Mountains, U.S.A. In Permo-Carboniferous Carbonate Platforms and Reefs (eds W. M. Ahr, P. M. Harris, W. A. Morgan & I. D. Somerville), Special Publication of the Society of Economic Paleontologists and Mineralogists, v.78, p.291-322. Laznicka, P. (1988) Breccias and Coarse Fragmentites: Petrology, Environments, Associations, Ores (Developments in Economic Geology), Amsterdam: Elsevier, v.25, p.832. Mair, K. and Abe, S. (2008) 3D numerical simulations of fault gouge evolution during shear: Grain size.
(15) 단층핵 구성물질의 함량과 전단강도 사이의 상관성 분석 reduction and strain localization. Earth and Planetary Science Letters, v.274, p.72-81. Mair, K. and Abe, S. (2011) Breaking up: comminution mechanisms in sheared simulated fault gouge. Pure and Applied Geophysics, v.168, p.2277-2288. Matula, M. (1981) Rock and soil description and classification for engineering geological mapping report by the IAEG commission on engineering geological mapping. Bulletin of the International Association of Engineering Geology, v.24, p.235-274. Moon, S.W., Yun, H.S., Kim, W.S., Na, J.H., Kim, C.Y. and Seo, Y.S. (2014) Correlation analysis between weight ratio and shear strength of fault materials using multiple regression analysis. The Journal of Engineering Geology, v.24, p.397-409. (in Korean with English abstract) Moore, D.E. and Lockner, D.A. (2004) Crystallographic controls on the frictional behavior of dry and watersaturated sheet structure minerals. Journal of Geophysical Research, v.109, B03401. Morrow, C.A., Moore, D.E. and Lockner, D.A. (2000) The effect of mineral bond strength and adsorbed water on fault gouge frictional strength. Geophysical Research Letters, v.27, p.815-818. North American Geologic-map Data Model Science Language Technical Team (2004) Report on progress to develop a North American science-language standard for digital geologic-map databases; Appendix B: Classification of metamorphic and other compositegenesis rocks, including hydrothermally altered, impactmetamorphic, mylonitic, and cataclastic rocks. In Digital Mapping Techniques ‘04 - Workshop Proceedings (ed. D. R. Soller), U.S. Geological Survey Open File Report No. 2004-1451, p.85-94. Norwegian Rock Mechanics Group (2000) Engineering geology and rock engineering. In: Handbook No.2, Norwegian Rock and Soil Engineering Association, p.250. Riedmüller, G., Brosch, F.J., Klima, K. and Medley, E.W. (2001) Engineering geological characterization of brittle faults and classification of fault rocks, Felsbau,. 79. 19(4), 13-19. Saffer, D.M. and Marone, C. (2003) Comparison of smectite and illiterich gouge frictional properties: Application to the updidp limit of the seismogenic zone along subduction megathrusts. Earth and Planetary Science Letters, v.215, p.219-235. Shipton, Z.K., Soden, A.M., Kirkpatrick, J.D., Bright, A.M. and Lunn, R.J. (2006) How thick is a fault? Fault displacement-thickness scaling revisited. Geophysical Monograph Series, v.170, p.193-198. Snoke, A.W., Tullis, J. and Todd, V.R. (1998) Fault-Related Rocks. A Photographic Atlas - Princeton: Princeton University Press, p.617. Spry, A. (1969) Metamorphic Textures. London: Pergamon, p.350. Stille, H. and Palmström, A. (2008) Ground behaviour and rock mass composition in underground excavations. Tunnelling and Underground Space Technology, v.23, p.46-64. Storti, F., Billi, A. and Salvini, F. (2003) Particle size distributions in natural carbonate fault rocks. Earth and Planetary Science Letters, v.206, p.173-186. Tesei, T., Collettini, C., Carpenter, B.M., Viti, C. and Marone, C. (2012) Frictional strength and healing behavior of phyllosilicate-rich faults. Journal of Geophysical Research, v.117, B09402. Tukey, J.W. (1970) Exploratory data analysis. AddisonWesley Publishing Company, p.872. Woo, I. (2012) Laboratory study of the shear characteristics of fault gouges around Mt. Gumjung, Busan. The Journal of Engineering Geology, v.22, p.113-121. (In Korean with English abstract) Woodcock, N.H. and Mort, K. (2008) Classification of fault breccias and related fault rocks. Geological Magazine, v.145, p.435-440. Yun, H.S., Moon, S.W. and Seo, Y.S. (2015) Setting of the range for shear strength of fault cores in Gyeongju and Ulsan using regression analysis. Journal of Korean Tunnelling and Underground Space Association, v.17, p.127-140. (in Korean with English abstract).
(16)
수치
+7
관련 문서
In this research, through analysis of block shear strength according to layered material of Ply-lam CLT, composition of plywood, tree species used, and adhe- sive and comparing
Surface treatment with liner and sandblasting showed higher shear bond strength between zirconia core and veneering ceramic (p<0.05).. Conclusion: The sand blasting and
(2016), Analysis on Ultimate Strength of Single Shear Bolted Connections with Austenitic Stainless Steel (STS201), Proceedings of Annual Conference, Korea Institute for
The article ‘The effect of various sandblasting conditions on surface changes of dental zirconia and shear bond strength between zirconia core and indirect composite resin’
H., 2012, A study for shear strength characteristics of frozen soils under various temperature conditions and vertical confining pres- sures, Journal of the
The relation between unconfined compressive strength and shear wave velocity increased nonlinearly for cemented soils with less than 16% of cement ratio.. 요
An analysis of shear bond strength of Co-Cr alloy of porcelain fused to metal and
Study on Shear Strength Using a Portable Dynamic Cone Penetration Test and Relationship between N-Nc
Key words : shear strength, portable dynamic cone penetration test, cohension, friction angle, direct shear test 최근 집중강우로 인하여 전국적으로 산사태 및 사면붕괴
