Characteristics of Outpatients with Pandemic H1N1/09 Influenza in a Tertiary Care University Hospital in Korea
Kyung Sun Park, 1 Tae Sung Park, 1 Jin Tae Suh, 1 You Sun Nam, 2 Mi Suk Lee, 3 and Hee Joo Lee 1
1
Department of Laboratory Medicine, Kyung Hee University School of Medicine, Seoul;
2
Biomedical Science, Kyung Hee University Graduate School, Seoul;
3
Department of Internal Medicine, Kyung Hee University School of Medicine, Seoul, Korea.
Received: January 24, 2011 Revised: April 12, 2011 Accepted: April 21, 2011
Corresponding author: Dr. Hee Joo Lee, Department of Laboratory Medicine, Kyung Hee University School of Medicine, 23 Kyungheedae-ro, Dongdaemun-gu, Seoul 130-702, Korea.
Tel: 82-2-958-8672, Fax: 82-2-958-8609 E-mail: [email protected]
∙ The authors have no financial conflicts of interest.
© Copyright:
Yonsei University College of Medicine 2012 This is an Open Access article distributed under the terms of the Creative Commons Attribution Non- Commercial License (http://creativecommons.org/
licenses/by-nc/3.0) which permits unrestricted non- commercial use, distribution, and reproduction in any medium, provided the original work is properly cited.
The pandemic H1N1/09 emerged rapidly in Korea. Here, we describe the clinical characteristics of outpatients in Seoul, Korea who were infected in the 2009 H1N1 pandemic. We reviewed the cases of outpatients with pandemic H1N1/09 who vis- ited a tertiary care teaching hospital between September 1 and December 31, 2009. Infection with pandemic H1N1/09 was confirmed by molecular tests. Of a total of 7,182 tests, 3,020 (42.0%) were positive. Compared with 473 cases of in- fluenza-like illness (ILI), the 586 confirmed cases of pandemic H1N1/09 differed in age [odds ratio (OR) 0.975] and fulfilling at least one of the following factors:
age <5 or ≥65 years, history of contact with other pandemic H1N1/09-infected in- dividuals (OR 0.611), fever ≥37.8°C (OR 3.567), cough (OR 2.290), and myalgia (OR 1.559). The sensitivity of the best criteria, “fever (≥37.8°C) plus cough”
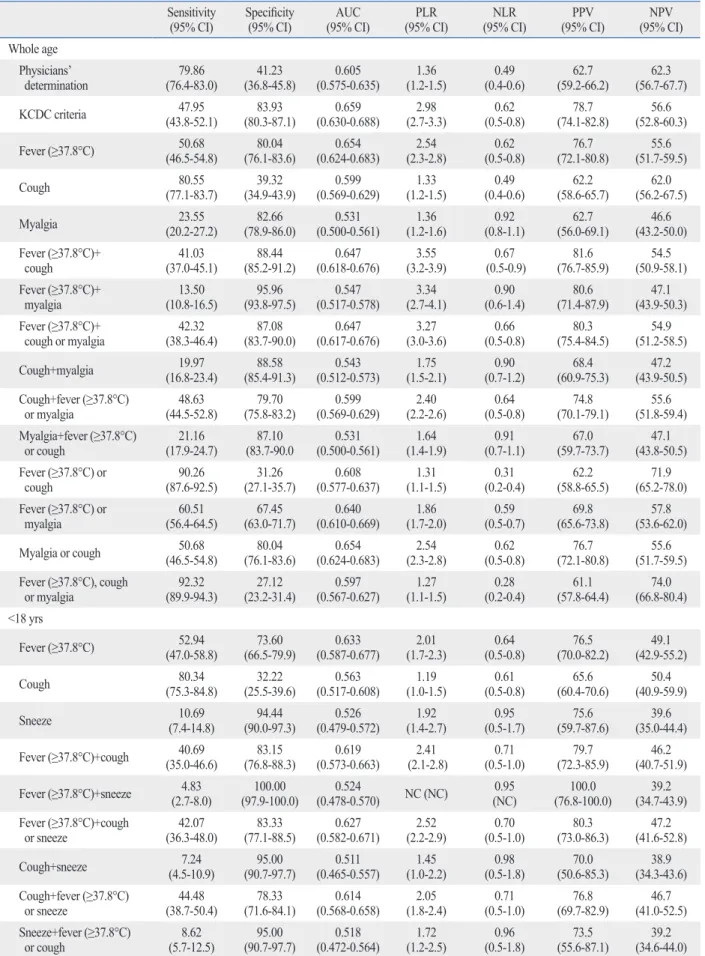
(41.03%) in this study was lower than that of the Korea Centers for Disease Con- trol and Prevention (KCDC) criteria (47.95%), whereas the positive likelihood ra- tio (3.55) and positive predictive value (81.6) of this criteria was higher than those of the KCDC criteria (2.98 and 78.7, respectively). The clinical characteristics of pandemic H1N1/09 are, in many regards, indistinguishable from those of ILI.
Moreover, the accuracy and predictability of criteria which include only symptoms or signs were not sufficient to diagnose pandemic H1N1/09 infection. Therefore, use of a combination of symptoms with confirmatory laboratory testing is neces- sary for accurate diagnosis of pandemic H1N1/09.
Key Words: Influenza A virus, H1N1 subtype, pandemic H1N1/09, outpatients, characteristics
The first case of pandemic H1N1/09 in Korea was identified on May 2, 2009. Af-
ter that time, the number of confirmed cases increased steadily; according to the
reports of the Korea Centers for Disease Control and Prevention (KCDC), which
operates the Korean emergency response system, a total of 2,417 cases had been
reported by August 19, 2009.
1Beginning August 21, 2009, the KCDC shifted its
strategy from containment to mitigation and altered the antiviral agent prescription
guidelines to allow clinicians to prescribe antiviral agents to all patients with
The KCDC criteria for suspicion of pandemic H1N1/09 infection were cases in which patients suffered from an unex- plained fever (defined by an ear temperature ≥37.8°C or anti- pyretics within 12 hours before hospital visit) within seven days before visiting the hospital and displayed symptoms such as a cough, sore throat, rhinorrhea, or nasal obstruction.
Statistical analysis was conducted using SPSS Statistics version 12.0 (SPSS, Inc., Chicago, IL, USA). We conduct- ed t-tests for quantitative data, chi-square or Fisher’s exact tests for qualitative data, depending on the anticipated cell number, and Cochran Mantel-Haenzel tests for investigat- ing the confounding variable of age. Multivariate logistic regression analyses were employed to evaluate the indepen- dent risk factors for pandemic H1N1/09-positive status by backward (wald) stepwise logistic regression models. Only the variables with p<0.1 by univariate analysis were includ- ed in the multivariate analysis. Finally, a p-value <0.05 was considered to be indicative of statistical significance. We then calculated sensitivity, specificity, area under the ROC curve (AUC), positive likelihood ratios (PLR), negative likelihood ratios (NLR), positive predictive value (PPV), and negative predictive value (NPV) of the possible diag- nostic criteria to identify those that were best for pandemic H1N1/09.
Between September 1 and December 31, confirmed-PCR tests for pandemic H1N1/09 were performed for a total of 7,182 patients (Fig. 1). Of these, 3,020 (42.0%) were posi- tive. We randomly selected 1,458 individuals (approximate- ly 20%) using SPSS Statistics. Of these, we excluded 399 inpatients, patients without detailed information about the symptoms of influenza-like illness without a laboratory di-
agnosis.
2Moreover, after that time, the KCDC did not con- duct individual epidemiologic investigations of confirmed cases. The incidence of influenza-like illness (ILI) and con- sumption of antiviral agents peaked in early November.
2The initial literature concerning the pandemic H1N1/09 infection associated the strain with profound morbidity and mortality.
3-7However, data on outpatients infected with pandemic H1N1/09 are still lacking. In this study, we de- scribe the clinical characteristics of outpatients with pan- demic H1N1/09 during the mitigation period at a tertiary university hospital in Korea.
We conducted a retrospective review of the presentation of outpatients with ILI at Kyung Hee University Hospital between September and December 2009. This study was approved by the IRB. In the vast majority of patients with ILI, pandemic H1N1/09 infection was confirmed by labora- tory testing. Written informed consent was obtained from all participants. The department of laboratory medicine at Kyung Hee University Hospital was designated as a quaran- tine station laboratory and was thus a treatment hub for pandemic H1N1/09. We began laboratory testing for pan- demic H1N1/09 on September 1, 2009.
Nose and/or throat swabs were collected from almost all subjects with ILI. Infection with pandemic H1N1/09 was confirmed via real-time reverse transcriptase-polymerase chain reaction (RT-PCR, RealTime Ready influenza A/H1N1 Detection set, Roche Diagnostics GmbH, Mannheim, Ger- many) and/or multiplex RT-PCR (Multiplex FluA ACE Sub- typing, Seegene, Inc., Seoul, Korea).
Fig. 1. Laboratory-confirmed cases of pandemic H1N1/09 influenza reported at Kyung Hee University Hospital between September 1 and December 31, 2009.
0 50 100 150 200
N um be r o f c as es
1 7 11 17 23 29 5 9 15 21 26 30 3 7 11 15 19 23 27 1 5 9 13 17 21 26 30 Date of onset
September October November December
1.304-3.296, p=0.002), and sneeze (OR 2.543, 95% CI 1.148-5.632, p=0.021) than patients with ILI. In multivariate analysis of the ≥18 age group, a fever of ≥37.8°C (OR 4.388, 95% CI 2.885-6.674, p<0.001) and cough (OR 2.677, 95% CI 1.779-4.030, p<0.001) were more frequent, and old- er age (OR 0.960, 95% CI 0.945-0.974, p<0.001) was less frequent in patients with pandemic H1N1/09. Interestingly, in contrast with the results of univariated analyses, the sig- nificant variables were not largely different except for sneeze (<18 age group, only) and age (≥18 age group, only), between the two groups.
A previous study
8reported that those with confirmed pandemic H1N1/09 were more likely to report feverishness, chills, or joint stiffness (OR 3.8, 95% CI 1.6-9.0) and rhi- norrhea or nasal congestion (OR 2.5, 95% CI 1.2-5.3), and were also more likely to have ≥38.1°C fever (OR 6.7, 95%
CI 2.7-16.7) compared to those with acute respiratory ill- ness. Moreover, the clinical features of infection with pan- demic H1N1/09 are similar to those of seasonal influen- za.
9-11Subjects with pandemic H1N1/09 influenza tended to have fever, cough, shortness of breath, myalgia, and fatigue, all similar symptoms to those suffering seasonal influenza.
Symptoms of 2009 pandemic H1N1 in children are simi- lar to those of seasonal influenza; for example, fever, cough, sore throat, and myalgia.
7,10-11Other symptoms (such as di- arrhea or vomiting) have occasionally been reported in chil- dren and in less than 5% of adults during periods of peak seasonal influenza incidence.
12Another study
10reported no significant differences in these symptoms between children and adults with pandemic H1N1/09.
onset of their illness, and those who had been sick for more than seven days. A total of 1,059 outpatients were include in this study, and of these, 586 patients were confirmed to have the pandemic H1N1/09 by laboratory test.
In addition, we investigated the age distribution of pan- demic H1N1/09 as well as the positivity rate according to age distribution (Fig. 2). Approximate numbers of infections peaked in two age groups: the pediatric and adult age groups.
We compared patients with pandemic H1N1/09 and those with ILI, and then compared those groups divided by age (<18 years and ≥18 years) using stratified analysis, Cochran Mantel-Haenzel tests (Table 1). In the latter cases, there were differences in significant variables for distinguishing charac- teristics of pandemic H1N1/09 between the two groups (<18 age group, only: sore throat; ≥18 age group, only: age, co- mobidities, risk of age, and myalgia).
Multivariate analysis (Table 2) of the whole age group, suggested that subjects with confirmed pandemic H1N1/09 were less likely to be older [odds ratio (OR) 0.975, 95%
confidence interval (CI) 0.966-0.984, p<0.001] and to have at least one of the following co-morbidities: age <5 or ≥65 years, a history of contact (OR 0.611, 95% CI 0.464-0.805, p<0.001), and were also more likely to have a fever of
≥37.8°C (OR 3.567, 95% CI 2.655-4.792, p<0.001), cough (OR 2.290, 95% CI 1.692-3.101, p<0.001), and myalgia (OR 1.599, 95% CI 1.1093-2.223, p=0.014) than subjects suffering ILI. However, multivariate analysis in the <18 age group, suggested that subjects with pandemic H1N1/09 were more likely to have a fever of ≥37.8°C (OR 3.142, 95% CI 2.041-4.835, p<0.001), cough (OR 2.073, 95% CI
Fig. 2. Age distribution of numbers of infections (columns) and positivity rate (line) during the 2009 H1N1 influenza pandemic.
0 5 10 15 20 25 30 35 40
0 20 40 60 80 100 120
N um be r o f H 1N 1 Po sit ive ra te o f H 1N 1, %
1 3 5 7 9 11 13 15 17 19 21 23 25 27 29 31 33 35 37 39 41 43 45 47 49 51 53 55 57 59 61 63 65 67 69 71 73 75 77 79 81 Age
Number of H1N1 Positive rate of H1N1, %
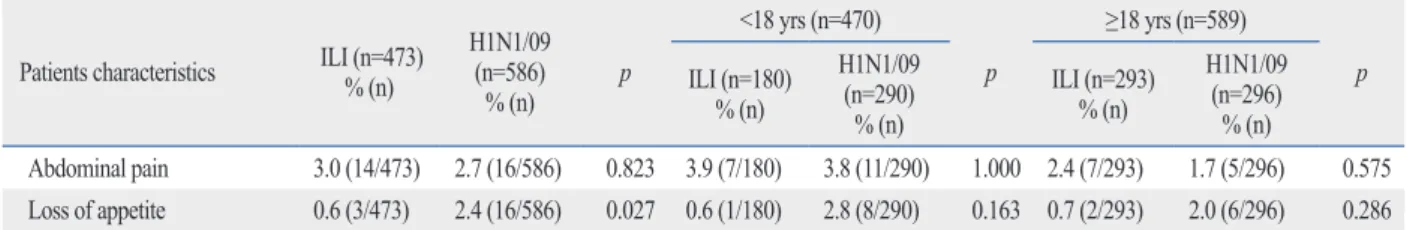
Table 1. Clinical Characteristics of Subjects with the Pandemic H1N1/09 Influenza and Those with Influenza-Like Illness by Age Patients characteristics ILI (n=473)
% (n)
H1N1/09 (n=586)
% (n) p
<18 yrs (n=470)
p
≥18 yrs (n=589) ILI (n=180) p
% (n)
H1N1/09 (n=290)
% (n)
ILI (n=293)
% (n)
H1N1/09 (n=296)
% (n)
Age in yrs, mean±SD 25.95±18.29 18.52±13.59 <0.001 7.79±4.53 7.96±4.82 0.703 29.03±11.05 36.99±14.31 <0.001 Gender, M : F 235 : 238 272 : 314 0.290 105 : 75 151 : 139 0.215 130 : 163 121 : 175 0.406 Risk factors for severe influenza infection
Co-morbidities 14.0 (66/473) 7.8 (46/586) 0.001 5.6 (10/180) 4.8 (14/290) 0.830 19.1 (56/293) 10.8 (32/296) 0.005 Type of co-morbidities
Diabetes 3.4 (16/473) 1.0 (6/586) 0.0 (0/180) 0.0 (0/290) 5.5 (16/293) 2.0 (6/296) Chronic pulmonary
diseases* 2.5 (12/473) 1.7 (10/586) 3.9 (7/180) 1.7 (5/290) 1.7 (5/293) 1.7 (5/296) Chronic
cardiovascular diseases
†3.4 (16/473) 1.0 (6/586) 0.0 (0/180) 1.0 (3/290) 5.5 (16/293) 1.0 (3/296) Chronic renal diseases
‡2.1 (10/473) 0.6 (5/586) 1.1 (2/180) 0.3 (1/290) 2.7 (8/293) 1.4 (4/296) Chronic liver diseases
§1.3 (6/473) 0.6 (5/586) 0.0 (0/180) 0.0 (0/290) 2.0 (6/293) 1.7 (5/296) Cancer or immuno-
compromised state
\\3.0 (14/473) 1.5 (9/586) 0.0 (0/180) 0.7 (2/290) 4.8 (14/293) 2.4 (7/296) Neurodevelopmental
disorders
¶0.2 (1/473) 0.3 (2/586) 0.6 (1/180) 0.3 (1/290) 0.0 (0/293) 0.0 (0/296) Pregnancy 0.6 (3/473) 0.5 (3/586) 0.0 (0/180) 0.0 (0/290) 1.0 (3/293) 1.0 (3/296) ≥2 co-morbidities 2.3 (11/473) 0.5 (3/586) 0.0 (0/180) 0.0 (0/290) 3.8 (11/293) 1.0 (3/296)
Age <5 or ≥65 yrs 16.9 (80/473) 14.5 (85/586) 0.283 34.4 (62/180) 27.6 (80/290) 0.122 6.1 (18/293) 1.7 (5/296) 0.005 History of contact with other
H1N1/09 identified
individuals 27.9 (132/473) 16.6 (97/586) <0.001 28.3 (51/180) 12.8 (37/290) <0.001 27.6 (81/293) 20.3 (60/296) 0.042
Exposure site 0.054 0.126 0.150
School (preschool) 26.6 (34/128) 42.0 (37/88) 37.5 (18/48) 60.0 (21/35) 19.3 (16/83) 30.2 (16/53) Home 52.3 (67/128) 34.0 (30/88) 52.1 (25/48) 34.3 (12/35) 54.2 (45/83) 34.0 (18/53) Military 0 (0/128) 1.1 (1/88) 0.0 (0/48) 0.0 (0/35) 0.0 (0/83) 1.9 (1/53) Hospital 5.5 (7/128) 3.4 (3/88) 0.0 (0/48) 0.0 (0/35) 8.4 (7/83) 5.7 (3/53) Workplace 7.8 (10/128) 12.5 (11/88) 0.0 (0/48) 0.0 (0/35) 12.0 (10/83) 20.8 (11/53) Others 7.8 (10/128) 6.8 (6/88) 10.4 (5/48) 5.7 (2/35) 6.0 (5/83) 7.5 (4/53) Co-morbidities, age <5 or
≥65 yrs, or history of
contact 48.4 (229/473) 34.5 (202/586) <0.001 56.7 (102/180) 40.0 (116/290) 0.001 43.3 (127/293) 29.1 (86/296) <0.001
Fever °C, mean±SD 37.04±0.84 37.71±0.93 <0.001 37.13±0.97 37.79±0.96 <0.001 36.98±0.80 37.63±0.89 <0.001
≥37.8°C 20.0 (90/451) 50.7 (296/584) <0.001 26.4 (47/178) 52.9 (153/289) <0.001 15.8 (43/273) 48.5 (143/295) <0.001
Fever for ≥3 days 7.2 (32/445) 7.9 (46/585) 0.686 12.0 (19/158) 11.8 (34/289) 1.000 4.5 (13/287) 4.1 (12/296) 0.840
Cough 60.7 (287/473) 80.5 (472/586) <0.001 67.8 (122/180) 80.3 (233/290) 0.003 56.3 (165/293) 80.7 (239/296) <0.001
Rhinorrhea 42.9 (203/473) 49.7 (291/586) 0.029 41.7 (75/180) 53.1 (154/290) 0.018 43.7 (128/293) 46.3 (137/296) 0.562
Sneeze 9.1 (43/473) 8.9 (52/586) 0.902 5.6 (10/180) 10.7 (31/290) 0.064 11.3 (33/293) 7.1 (21/296) 0.088
Nasal obstruction 11.6 (55/473) 12.5 (73/586) 0.681 9.4 (17/180) 11.0 (32/290) 0.643 13.0 (38/293) 13.9 (41/296) 0.809
Sore throat 47.6 (225/473) 50.5 (296/586) 0.341 30.6 (55/180) 41.7 (121/290) 0.019 58.0 (170/293) 59.1 (175/296) 0.802
Headache 31.7 (150/473) 36.5 (214/586) 0.102 18.9 (34/180) 26.6 (37/290) 0.059 39.6 (116/293) 46.3 (137/296) 0.114
Myalgia 17.3 (82/473) 23.5 (138/586) 0.013 3.3 (6/180) 5.9 (17/290) 0.274 25.9 (76/293) 40.9 (121/296) <0.001
Diarrhea 3.4 (16/473) 2.2 (13/586) 0.248 1.1 (2/180) 1.7 (5/290) 0.713 4.8 (14/293) 2.7 (8/296) 0.200
Vomiting 2.3 (11/473) 4.8 (28/586) 0.035 2.8 (5/180) 8.6 (25/290) 0.011 2.0 (6/293) 1.0 (3/296) <0.001
Nausea 2.7 (13/473) 3.9 (23/586) 0.294 2.8 (5/180) 3.8 (11/290) 0.613 2.7 (8/293) 4.1 (12/296) 0.496
of investigation. This study was conducted during the miti- gation period, between September and December 2009.
Therefore, active outbreak control strategies such as school closures, mass vaccination, and an anti-viral drug regimen had been applied, and sufficient health information had been provided to the public.
We assessed validation of sensitivity, specificity, AUC, PLR, NLR, PPV, and NPV for key variables significantly associated with pandemic H1N1/09 infection (Table 3).
However, considering the sensitivity, PLR, and PPV togeth- er, it was difficult to determine the best criteria for clinical diagnosis of pandemic H1N1/09 in outpatients, likely due to its non-specific presentation. We found no clear criteria for having a higher pretest probability (PLR ≥5 and NLR ≤ 0.2) in this study, especially considering the PLR and NLR from a previous study.
16Several other studies have suggested that young patients constituted a higher proportion of those positive for pan- demic H1N1/09.
2,4,5,13-15This may have been due to an out- break of pandemic H1N1/09 in preschools or schools. In the present study, subjects with pandemic H1N1/09 with a history of contact with other pandemic H1N1/09-infected individuals accounted for 16.6% of the relevant group. Of those subjects <18 years of age, 12.8% had a history of contact with other infected subjects; these exposures oc- curred mainly at school (60.0%) and at home (34.3%).
Unlike those suffering from ILI, all subjects with con- firmed pandemic H1N1/09 fulfilled at least one of the follow- ing conditions: age <5 or ≥65 years, or a history of contact (48.4% vs. 34.5%, p<0.001) identified via logistic regression analysis. These findings differ from those of other studies.
9,10The difference may be attributed, at least in part, to the time Table 1. Continued
Patients characteristics ILI (n=473)
% (n)
H1N1/09 (n=586)
% (n) p
<18 yrs (n=470)
p
≥18 yrs (n=589) ILI (n=180) p
% (n)
H1N1/09 (n=290)
% (n)
ILI (n=293)
% (n)
H1N1/09 (n=296)
% (n)
Abdominal pain 3.0 (14/473) 2.7 (16/586) 0.823 3.9 (7/180) 3.8 (11/290) 1.000 2.4 (7/293) 1.7 (5/296) 0.575 Loss of appetite 0.6 (3/473) 2.4 (16/586) 0.027 0.6 (1/180) 2.8 (8/290) 0.163 0.7 (2/293) 2.0 (6/296) 0.286 ILI, influenza like illness.
Statistical analysis of the clinical and laboratory characteristics of patients was conducted via t-tests for quantitative data, chi-square or Fisher’s exact tests for qualitative data depending on the anticipated cell number, and via Cochran Mantel-Haenzel tests for investigating a confounding variable of age (dividing into <18 age- group and ≥18 age-group).
*Includes chronic obstructive lung disease, asthma, bronchiectasis, bronchopulmonary dysplasia, etc.
†
Includes congestive heart failure, ischemic heart disease, valvular heart disease, congenital heart disease, etc.
‡
Includes nephritic syndrome, chronic renal failure, kidney transplantation status, etc.
§
Includes liver cirrhosis, liver transplantation status, etc.
\\
Includes cancer, immunosuppressive drugs, human immunodeficiency virus (HIV) infection, chemotherapy, etc.
¶