• 검색 결과가 없습니다.

Forecasting obesity prevalence in Korean adults for the years 2020 and 2030 by the analysis of contributing factors

N/A
N/A
Protected

Academic year: 2022

Share "Forecasting obesity prevalence in Korean adults for the years 2020 and 2030 by the analysis of contributing factors"

Copied!
7
0
0

로드 중.... (전체 텍스트 보기)

전체 글

(1)

http://e-nrp.org

Forecasting obesity prevalence in Korean adults for the years 2020 and 2030 by the analysis of contributing factors

Inkyung Baik

Department of Foods and Nutrition, College of Science and Technology, 77, Jeongnung-ro, Seongbuk-gu, Kookmin University, Seoul 02707, Korea

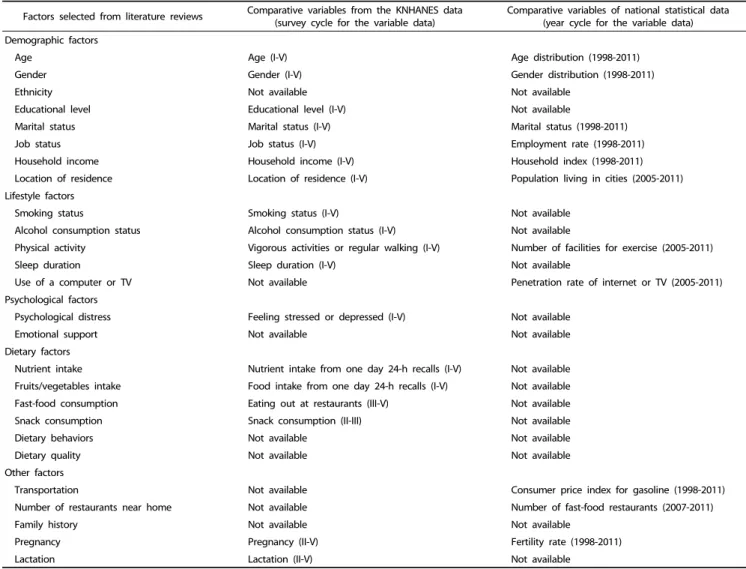
BACKGROUND/OBJECTIVES: There are few studies that forecast the future prevalence of obesity based on the predicted prevalence model including contributing factors. The present study aimed to identify factors associated with obesity and construct forecasting models including significant contributing factors to estimate the 2020 and 2030 prevalence of obesity and abdominal obesity.

SUBJECTS/METHODS: Panel data from the Korea National Health and Nutrition Examination Survey and national statistics from the Korean Statistical Information Service were used for the analysis. The study subjects were 17,685 male and 24,899 female adults aged 19 years or older. The outcome variables were the prevalence of obesity (body mass index ≥ 25 kg/m
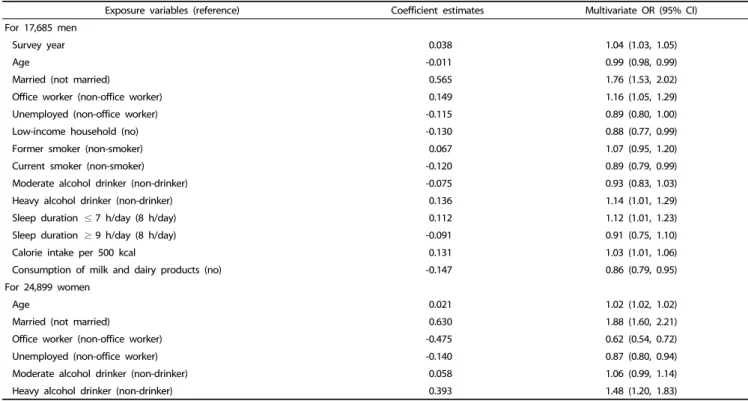
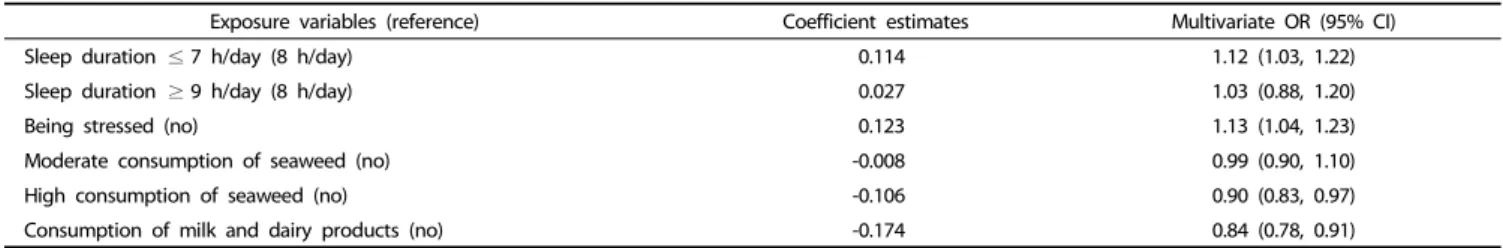
2

) and abdominal obesity (waist circumference ≥ 90 cm for men and ≥ 85 cm for women). Stepwise logistic regression analysis was used to select significant variables from potential exposures.

RESULTS: The survey year, age, marital status, job status, income status, smoking, alcohol consumption, sleep duration, psychological factors, dietary intake, and fertility rate were found to contribute to the prevalence of obesity and abdominal obesity. Based on the forecasting models including these variables, the 2020 and 2030 estimates for obesity prevalence were 47% and 62%

for men and 32% and 37% for women, respectively.

CONCLUSIONS: The present study suggested an increased prevalence of obesity and abdominal obesity in 2020 and 2030.

Lifestyle factors were found to be significantly associated with the increasing trend in obesity prevalence and, therefore, they may require modification to prevent the rising trend.

Nutrition Research and Practice 2018;12(3):251-257; https://doi.org/10.4162/nrp.2018.12.3.251; pISSN 1976-1457 eISSN 2005-6168 Keywords: Obesity, abdominal fat, prevalence, risk factors, forecasting

INTRODUCTION *

The increasing rate of obesity in Korea, as well as in western countries, is a growing public health problem. According to the data from the 2015 Korea National Health and Nutrition Examination Survey (KNHANES) for Korean adults aged 19 years or older, the prevalence of obesity defined as a body mass index (BMI) ≥ 25 kg/m

2

is about 40% for men and 26% for women.

These data mean that one-third of Korean adults are obese.

Compared to the 1998 obesity prevalence, which was 25% for men and 26% for women, a dramatic increase was observed in men [1]. The prevalence of abdominal obesity, which is defined as a waist circumference ≥ 90 cm for men and ≥ 85 cm for women, increased up to 55% for men, when comparing the 2015 to 1998 data. In contrast, the prevalence of obesity and abdominal obesity in women has minimally increased over 10 years. Thus, serious health effects associated with obesity, including increased risks of chronic diseases, have risen dramatically among males [1].

A recent report revealed that the socioeconomic costs of obesity, which include direct costs related to medical care and

indirect costs related to loss of productivity, are estimated at approximately 6.2 billion U.S. dollars per year. Compared to 2005, this is a 2.2-fold increase, which is greater than the increasing rate of smoking or alcohol drinking. The expenses related to obesity were observed to be primarily due to the direct costs for the treatment of chronic diseases [2].

The causes of obesity are numerous, complex, and inter- related. Obesity is reportedly influenced by factors that are biological, behavioral, and environmental [3,4]. The biological factors include age, gender, hormone, and genetic aspects;

behavioral factors include individual lifestyle, emotion, attitude, belief, cognition, and knowledge, and environmental factors are classified as macro- and micro-environments. The macro- environment comprises food costs, vehicle costs, transportation system, and investment costs for leisure activities, while the micro-environment consists of the propensity to consume foods per household, accessibility of fast food restaurants, park areas or exercise facilities, and usability of exercise facilities or sports programs.

Finkelstein et al. [5] considered age, ethnicity, educational level, marital status, economic level, consumption of healthy

This work was supported by a grant (2014P3500100) by Research of Korea Centers for Disease Control and Prevention. The funders have no role in the study.

§

Corresponding Author: Inkyung Baik, Tel. 82-2-910-4774, Fax. 82-2-910-5249, Email. [email protected] Received: December 28, 2017, Revised: April 5, 2018, Accepted: April 12, 2018

This is an Open Access article distributed under the terms of the Creative Commons Attribution Non-Commercial License (http://creativecommons.org/licenses/by-nc/3.0/)

which permits unrestricted non-commercial use, distribution, and reproduction in any medium, provided the original work is properly cited.

(2)

foods, and usage of the internet as factors contributing to obesity prevalence. Using a logistic regression model, they predicted obesity prevalence in U.S. adults at 37% and 42%

in 2020 and 2030, respectively. These forecasted estimates are lower than that projected by a previous study [6]. Using a linear regression model, in which obesity prevalence by year was fitted as a dependent variable, Wang et al. [6] reported 51%

as obesity prevalence in 2030. Similar to the method of Finkelstein et al. [5], Nacul et al. [7] identified factors contri- buting to the prevalence of chronic obstructive pulmonary disease to estimate the population prevalence using a logistic regression model. To the best of our knowledge, few studies have forecasted the future prevalence of obesity in Korean adults using statistical models, including factors contributing to the disease.

This study aimed to identify factors associated with obesity and estimate the 2020 and 2030 prevalence of obesity using a statistical model including the significant contributing factors.

Thus, time series data of the KNHANES and national statistics between 1998 and 2011 were used to construct a logistic regression model for obesity and abdominal obesity. After validating the model using the 2012 data, this study forecasted the 2020 and 2030 prevalence of obesity and abdominal obesity using estimates of population projections for Korea in 2020 and 2030 [8].

SUBJECTS AND METHODS Study population

This study utilized data from the KNHANES I-V cycles with thorough datasets (1998, 2001, 2005, 2007-2009, 2010-2012) for adults aged 19 years or older, with a particular focus on the health and nutrition interview records. In total, the data of 17,685 men and 24,899 women were collected for analysis. The national statistical data were obtained from the web-site of the Korean Statistical Information Service (http://kosis.kr). All proce- dures were approved by the Human Subjects Review Committee of Kookmin University (KMU-201407-HR-027).

Definition of outcome variables

The outcome variables of this study were the prevalence of obesity and abdominal obesity. Obesity was defined as a BMI

≥ 25 kg/m

2

. Abdominal obesity was defined as a waist circum- ference ≥ 90 cm for men and ≥ 85 cm for women.

Selection of exposure variables

The exposure variables were factors that contribute to obesity prevalence. Based on an initial literature review, potential exposure variables were listed and reviewed by an expert council, which consisted of nutritionists, public health specialists, epidemiologists, and clinical doctors (two experts for each major area). The following key-words were used to identify eligible articles on the PubMed website (http://www.ncbi.nlm.nih.gov/ pubmed):

‘risk factor’, ‘related factor’, ‘contributing factor’, ‘forecasting’,

‘body weight’, ‘BMI’, ‘obesity’, and ‘abdominal obesity’. Among 884 articles searched, those regarding non-human studies or clinical trials, as well as epidemiologic studies for pregnant or lactating women, babies, or children, were excluded from the

article list for review. After excluding 851 articles, 33 were reviewed by the author. According to the list revised by the expert council, available exposure variables in both the KNHANES and national statistical data were identified (Table 1).

From the 1998-2011 KNHANES data, the selected variables included age, gender, educational level, marital status, job status, income status, location of residence, smoking status, alcohol consumption status, physical activity, sleep duration, psychological distress, and dietary factors from 24-h recalls. On the recommendation of the expert council, physical activity was not included as an exposure variable because the survey questions on this topic were inconsistent. The dietary variables selected were total calories, carbohydrate, and fat intake and consumption of 23 food groups (grains, potatoes, sugary products, legumes, nuts, vegetables, mushrooms, fruits, seaweed, seasonings, meats, eggs, fish and seafood, milk and dairy products, plant oils, animal oils, other plant-based foods, other animal source-based foods, soft drinks, coffee and coffee-based products, low-calorie drinks, high-calorie drinks, and snacks).

Among the variables available in the 1998-2011, national statistical data, especially local data, those that overlapped with the KNHANES information were not selected, but data regarding fertility rate and consumer price index for gasoline were extracted. The variable of residence location accompanying the KNHANES data was excluded from the analysis.

Statistical analysis

According to the KNHANES data cycles, descriptive statistics for the outcome and exposure variables were calculated by gender. P-values for trend across the cycles were obtained from the Cochran-Armitage Chi-square test and analysis of variance trend tests. To analyze the association of the prevalence of obesity and abdominal obesity with exposure variables, logistic regression analysis was used. The model was constructed as follows; P (Oijt=1) = ∫ (α + β1*Xit + β2*Zjt + β3*T). In this model,

‘O’ indicates an outcome variable; ‘i’ indicates an individual; ‘j’

indicates the location of residence; ‘t’ indicates the year; ‘X’

indicates exposure variables for an individual subject; ‘Z’

indicates exposure variables from the national statistical data;

‘T’ indicates a rank of the years, and ‘∫( )’ indicates logit probability function. In the analysis, an integrated weight for the KNHANES data was considered. To identify ‘factors contri- buting to the outcome’, significant exposure variables were identified using the stepwise selection method at P < 0.05. To present the results of the stepwise selection, the odds ratio (OR) and 95% confidence interval (CI) were obtained. Coefficient estimates were used to construct the final forecasting models.

To forecast the 2020 and 2030 prevalence of obesity and abdominal obesity, the 2010 KNHANES data were used as individual-level data, as per Finkelstein et al. [6]. Given that the estimates of population projections for Korea in 2020 and 2030 were obtained using the 2010 Population and Housing Census data [8], the use of the 2010 KNHANES data was considered to be reasonable.

A linear regression model and an autoregressive integrated

moving average model were applied, to forecast the 2020 and

2030 data for fertility rate and consumer price index for

gasoline.

(3)

Factors selected from literature reviews Comparative variables from the KNHANES data

(survey cycle for the variable data) Comparative variables of national statistical data (year cycle for the variable data) Demographic factors

Age Age (I-V) Age distribution (1998-2011)

Gender Gender (I-V) Gender distribution (1998-2011)

Ethnicity Not available Not available

Educational level Educational level (I-V) Not available

Marital status Marital status (I-V) Marital status (1998-2011)

Job status Job status (I-V) Employment rate (1998-2011)

Household income Household income (I-V) Household index (1998-2011)

Location of residence Location of residence (I-V) Population living in cities (2005-2011) Lifestyle factors

Smoking status Smoking status (I-V) Not available

Alcohol consumption status Alcohol consumption status (I-V) Not available

Physical activity Vigorous activities or regular walking (I-V) Number of facilities for exercise (2005-2011)

Sleep duration Sleep duration (I-V) Not available

Use of a computer or TV Not available Penetration rate of internet or TV (2005-2011) Psychological factors

Psychological distress Feeling stressed or depressed (I-V) Not available

Emotional support Not available Not available

Dietary factors

Nutrient intake Nutrient intake from one day 24-h recalls (I-V) Not available Fruits/vegetables intake Food intake from one day 24-h recalls (I-V) Not available Fast-food consumption Eating out at restaurants (III-V) Not available

Snack consumption Snack consumption (II-III) Not available

Dietary behaviors Not available Not available

Dietary quality Not available Not available

Other factors

Transportation Not available Consumer price index for gasoline (1998-2011)

Number of restaurants near home Not available Number of fast-food restaurants (2007-2011)

Family history Not available Not available

Pregnancy Pregnancy (II-V) Fertility rate (1998-2011)

Lactation Lactation (II-V) Not available

KNHANES: Korea National Health and Nutritional Examination Survey

Table 1. Potential factors contributing to obesity selected from literature reviews and comparative variables selected from the KNHANES data and national statistical data

The predicted estimates were calculated with its 95% CI, after using the estimates of population projections for Korea in 2020 and 2030. All statistical analyses were performed with the assistance of SAS 9.1.3 (2008, SAS Institute, Cary, NC, USA), and the statistical significance level was set at 0.05 a two-tail test.

RESULTS

Comparison of characteristics of the study participants across the KNHANES cycles

Table 2 shows the age-adjusted values of outcome and exposure variables across the KNHANES cycles. The prevalence of obesity and abdominal obesity increased over 14 years (P-value for trend < 0.001). The proportion of the married, those with low income, smokers, and individuals who admitted to being stressed decreased, whereas that of office workers, alcohol drinkers, and individuals who had a depressed mood increased over 14 years. In addition, consumption of meat, eggs, dairy products, and drinks increased while seaweed consumption decreased over the cycles. In the national statistical data, fertility

rate declined, while consumer price index for gasoline increased over the time.

Analysis of associations between exposure variables and the prevalence of obesity and abdominal obesity

Using stepwise logistic regression analysis, exposure variables that were significantly associated with the trend of obesity prevalence were found (Table 3). Among men, the survey year, being married, office worker, heavy alcohol consumption, short sleep duration, and calorie intake were positively associated with the prevalence of obesity, whereas there was an inverse association for age, unemployment, low-income status, and consumption of milk and dairy products. Among women, age, being married, non-office worker, heavy alcohol consumption, short sleep duration, and being stressed were positively associated with obesity prevalence, but consumption of seaweed, milk, and dairy products showed an inverse association.

Table 4 provides the stepwise regression results for abdominal

obesity. Among men, the survey year, age, being married,

former smoking, heavy alcohol consumption, and calorie intake

(4)

Variables Survey cycles (yrs) P-value for trend I (1998) II (2001) III (2005) IV (2007-2009) V (2010-2011)

KNHANES data

Number of participants 6,454 5,396 4,725 15,001 10,953

Obesity, % 27.2 30.8 31.7 31.2 31.0 < 0.001

Abdominal obesity, % 24.0 26.3 25.6 27.1 25.1 < 0.001

Men, % 43.9 42.5 41.8 40.1 40.4 < 0.001

Married, % 89.5 89.1 86.8 86.9 85.3 < 0.001

Office worker, % 11.7 13.6 16.0 17.4 20.9 < 0.001

Non-office worker, % 48.4 39.5 40.8 39.3 37.0 < 0.001

Low-income household, % 36.3 22.8 19.6 22.4 15.2 < 0.001

Current smoker, % 32.3 27.5 21.9 20.6 17.5 < 0.001

Alcohol drinker, % 43.1 41.6 73.0 70.0 71.5 < 0.001

Sleep duration ≤ 7 h/day 69.2 68.1 69.2 68.9 70.0 < 0.01

Being stressed, % 36.2 32.7 33.7 28.1 26.5 < 0.001

Having a depressed mood, % 11.2 10.5 15.6 15.5 12.7 < 0.001

Calorie intake, kcal/day 1,897.5 1,901.5 1,976.5 1,827.5 2,001.9 0.52

Fat intake, g/day 34.1 36.4 40.4 34.0 40.7 0.25

Carbohydrate intake, g/day 318.9 307.6 309.8 303.2 322.2 0.10

Consumption of foods, g/day

Meat 63.1 84.8 82.2 75.1 94.3 < 0.001

Eggs 16.4 16.9 21.4 19.3 22.8 < 0.001

Seaweed 8.0 10.8 10.7 5.9 4.7 < 0.001

Milk and dairy products 40.4 40.3 55.0 62.2 82.5 < 0.001

Drinks 28.6 44.6 43.6 52.4 96.3 < 0.001

National statistical data

Fertility rate 1.48 1.33 1.10 1.22 1.26 < 0.001

Consumer price index for gasoline 63.9 73.5 82.7 94.1 106.0 < 0.001

KNHANES: Korea National Health and Nutritional Examination Survey

Table 2. Comparison of age-adjusted values of outcome and exposure variables across the survey cycles of the KNHANES and national statistical data

Exposure variables (reference) Coefficient estimates Multivariate OR (95% CI) For 17,685 men

Survey year 0.038 1.04 (1.03, 1.05)

Age -0.011 0.99 (0.98, 0.99)

Married (not married) 0.565 1.76 (1.53, 2.02)

Office worker (non-office worker) 0.149 1.16 (1.05, 1.29)

Unemployed (non-office worker) -0.115 0.89 (0.80, 1.00)

Low-income household (no) -0.130 0.88 (0.77, 0.99)

Former smoker (non-smoker) 0.067 1.07 (0.95, 1.20)

Current smoker (non-smoker) -0.120 0.89 (0.79, 0.99)

Moderate alcohol drinker (non-drinker) -0.075 0.93 (0.83, 1.03)

Heavy alcohol drinker (non-drinker) 0.136 1.14 (1.01, 1.29)

Sleep duration ≤ 7 h/day (8 h/day) 0.112 1.12 (1.01, 1.23)

Sleep duration ≥ 9 h/day (8 h/day) -0.091 0.91 (0.75, 1.10)

Calorie intake per 500 kcal 0.131 1.03 (1.01, 1.06)

Consumption of milk and dairy products (no) -0.147 0.86 (0.79, 0.95)

For 24,899 women

Age 0.021 1.02 (1.02, 1.02)

Married (not married) 0.630 1.88 (1.60, 2.21)

Office worker (non-office worker) -0.475 0.62 (0.54, 0.72)

Unemployed (non-office worker) -0.140 0.87 (0.80, 0.94)

Moderate alcohol drinker (non-drinker) 0.058 1.06 (0.99, 1.14)

Heavy alcohol drinker (non-drinker) 0.393 1.48 (1.20, 1.83)

Table 3. Results of stepwise logistic regression analysis for the prevalence of obesity

(5)

Exposure variables (reference) Coefficient estimates Multivariate OR (95% CI) For 17,685 men

Survey year 0.023 1.02 (1.01, 1.04)

Age 0.010 1.01 (1.01, 1.01)

Married (not married) 0.516 1.68 (1.44, 1.96)

Low-income household (no) -0.146 0.86 (0.76, 0.98)

Former smoker (non-smoker) 0.160 1.17 (1.03, 1.34)

Current smoker (non-smoker) 0.020 1.02 (0.90, 1.16)

Moderate alcohol drinker (non-drinker) -0.109 0.90 (0.80, 1.01)

Heavy alcohol drinker (non-drinker) 0.158 1.17 (1.03, 1.33)

Calorie intake per 500 kcal 0.166 1.04 (1.01, 1.07)

Consumption of milk and dairy products (no) -0.127 0.88 (0.79, 0.98)

For 24,899 women

Age 0.040 1.04 (1.04, 1.04)

Married (not married) 0.577 1.79 (1.45, 2.19)

Office worker (non-office worker) -0.479 0.62 (0.52, 0.73)

Unemployed (non-office worker) -0.047 0.95 (0.88, 1.03)

Moderate alcohol drinker (non-drinker) 0.109 1.12 (1.03, 1.21)

Heavy alcohol drinker (non-drinker) 0.592 1.80 (1.41, 2.31)

Being stressed (no) 0.204 1.23 (1.13, 1.33)

Calorie intake per 500 kcal 0.128 1.04 (1.01, 1.07)

Moderate consumption of seaweed (no) -0.011 0.99 (0.89, 1.11)

High consumption of seaweed (no) -0.129 0.88 (0.81, 0.96)

Consumption of milk and dairy products (no) -0.158 0.86 (0.79, 0.93)

Fertility rate 0.417 1.52 (1.20, 1.91)

OR, odds ratio; CI, confidence interval.

Table 4. Results of stepwise logistic regression analysis for the prevalence of abdominal obesity

Exposure variables (reference) Coefficient estimates Multivariate OR (95% CI)

Sleep duration ≤ 7 h/day (8 h/day) 0.114 1.12 (1.03, 1.22)

Sleep duration ≥ 9 h/day (8 h/day) 0.027 1.03 (0.88, 1.20)

Being stressed (no) 0.123 1.13 (1.04, 1.23)

Moderate consumption of seaweed (no) -0.008 0.99 (0.90, 1.10)

High consumption of seaweed (no) -0.106 0.90 (0.83, 0.97)

Consumption of milk and dairy products (no) -0.174 0.84 (0.78, 0.91)

OR, odds ratio; CI, confidence interval.

Table 3. continued

Fig. 1. Forecasted prevalence of obesity and abdominal obesity among women and men in 2020 and 2030

were positively associated with the prevalence of abdominal obesity, whereas low-income status and consumption of milk and dairy products had an inverse association. Among women, age, being married, non-office worker, moderate-to-heavy alcohol consumption, being stressed, calorie intake, and fertility rate were positively associated with the prevalence of abdominal obesity, but there was an inverse association for consumption of seaweed, milk, and dairy products.

Forecasting the prevalence of obesity and abdominal obesity for the years 2020 and 2030

Using the models including significant exposure variables presented in Tables 3 and 4, the predicted values of the prevalence of obesity and abdominal obesity for 2012 were calculated and compared with the actual values. The estimated obesity prevalence was 37.5% (95% CI: 36.5, 38.5) for men and 30.0% (95% CI: 29.4, 30.6) for women, while the actual values were 35.3% (95% CI: 32.7, 38.0) for men and 29.7% (95% CI:

27.2, 32.2) for women. Abdominal obesity was predicted to be

28.2% (95% CI: 27.5, 29.0) for men and 28.8% (95% CI: 28.1,

29.4) for women, the actual values were 23.3% (95% CI: 20.8,

(6)

25.9) for men and 23.8% (95% CI: 21.3, 26.4) for women. Thus, the prevalence of abdominal obesity seemed to be overesti- mated compared to its actual value (data available upon request).

Fig. 1 shows the predicted values of the prevalence of obesity and abdominal obesity for the years 2020 and 2030. The predicted values of obesity prevalence in men for 2020 and 2030 were 46.8% (95% CI: 45.7, 47.8) and 61.5% (95% CI: 60.4, 62.5), respectively. In women, the corresponding values for 2020 and 2030 were 32.3% (95% CI: 31.6, 32.9) and 37.0% (95% CI:

36.3, 37.6). The predicted values of the prevalence of abdominal obesity for 2020 and 2030 were 35.1% (95% CI: 34.3, 35.9) and 46.8% (95% CI: 45.9, 47.8), in men, and 29.8% (95% CI: 29.2, 30.5) and 35.6% (95% CI: 34.9, 36.4), in women, respectively.

DISCUSSION

This present study constructed forecasting models, which consist of factors significantly associated with the trends in the prevalence of obesity and abdominal obesity over 14 years, to propose the 2020 and 2030 equivalents. The survey year, age, marital status, job status, income status, smoking, alcohol consumption, sleep duration, psychological factors, dietary intake, and fertility rate were found to be factors contributing to the prevalence of obesity and abdominal obesity. By applying the forecasting models, including these variables, the estimated 2030 obesity prevalence was 61.5% for men and 37.0% for women. These estimates are 1.5-fold and 1.4-fold higher for men and women, respectively, relative to the 2015 data.

Compared to the forecasted estimate of obesity prevalence in 2030 for U.S. adults in the study of Finkelstein et al. [5], almost 20% more Korean adults were estimated to be classified as obese. This increased prevalence of obesity predicted in Korean than U.S. adults may be partly due to the different cutoff points used for the definition of obesity because a BMI ≥ 30 kg/m

2

is used to define obesity in the U.S.

Finkelstein et al. [5] reported that an age of 45 to 64 years, male, black or Hispanic ethnicities, being less educated, married, relatively lower income, high prices of healthy foods, and internet access are significant factors contributing to obesity prevalence.

Other epidemiologic studies with a large sample size reported that smoking [9,10], low fruit and vegetable intake [10], alcohol consumption [11], short sleep duration [12], and psychological depression or distress [13] are associated with obesity. Interes- tingly, this study observed that a lower trend in seaweed consumption over 14 years is significantly associated with a higher prevalence of obesity and abdominal obesity among women. Seaweed is low in calories and, therefore, a high consumption of seaweed may be helpful to control body weight. Gender-specific discrepancies in factors that seem to be positively associated with obesity prevalence are job status, smoking, psychological factors, and fertility rate. Office workers had a higher prevalence of obesity among men, whereas non-office workers had a higher prevalence among women.

Such associations between job status and obesity prevalence may reflect exposure to other risk factors of obesity, such as smoking or alcohol consumption. Psychological distress and fertility rate were found to be significant factors of obesity or abdominal obesity among women. However, because fertility

rate tends to decrease, the influence of this factor is expected to be minimized in 2030.

No prior study has forecasted the future obesity prevalence in Korean adults. The present study provides meaningful information on what modifiable factors, in particular lifestyle, should be improved to prevent increasing obesity prevalence.

For men, although current smoking was inversely associated with obesity prevalence, smoking history was positively associated with abdominal obesity. These results are coherent with the findings of previous studies [14-16]. Potential biological mechanisms underlying the association between smoking and abdominal obesity include hormonal changes due to smoking, in particular increased cortisol levels, leading to insulin resistance, and altered levels of sex hormones [17-20]. Smoking was not found to be a factor contributing to obesity or abdominal obesity among women, probably because of a small number of smokers. However, alcohol consumption was revealed to be a significant factor in both men and women. Alcohol contains 7 kcal/g, which is comparative to the caloric value of fat.

According to the 2015 KNHANES report, the proportion of alcohol drinkers who consume alcoholic beverages at least once a month is 75% in male adults and 45% in female adults.

Furthermore, the proportion of high-risk alcohol drinkers, which are defined as male drinkers who consume ≥ 7 drinks per drinking occasion or female drinkers who consume ≥ 5 drinks per drinking occasion and who have drinking occasions ≥ 2 per week, is 20% in men and 6% in women. Such proportions have been continuously increasing over 14 years, particularly in young men and women aged 19 to 44 years. Among men, younger age was significantly associated with obesity prevalence;

this association may be partly due to the high alcohol consump- tion in young men.

This study is a sole investigation to provide forecasting data on obesity prevalence for Korean adults. However, the factors that were used to construct the forecasting model may not be causal factors of obesity, due to the cross-sectional association.

A wide range of exposure variables was considered to establish the forecasting model although physical activity was not included in the forecasting model because of inconsistent information across the examination cycles. To take into account social and environmental factors, which have been suggested to have an association with obesity [3,4], national data regarding number of facilities for exercise, penetration rate of internet or TV, consumer price index for gasoline, and number of fast-food restaurants were collected in this study. However, only data of consumer price index for gasoline were available for the entire examination cycles although this variable was found not to be associated with obesity prevalence. Finally, when the validity of the forecasting model was investigated using the 2012 data, the projected estimates for obesity prevalence were almost similar compared with the actual prevalence while those for abdominal obesity were overestimated.

In summary, the present study proposed the years 2020 and

2030 prevalence of obesity and abdominal obesity using the

forecasting model, which included factors contributing to the

prevalence trend over the period 1998-2011. More attention

should be given to the factors which comprised the forecasting

model, although some of them may not be causal factors.

(7)

Individuals who have the factors contributing to an increasing trend in obesity prevalence may be at high-risk of obesity.

Further studies need to confirm the findings of the present study and should consider additional factors that may be associated with obesity. Meanwhile, some lifestyle factors should be modified to prevent obesity at the individual level while public health strategies and policies should be established at the national level.

CONFLICT OF INTEREST

The author declares no potential conflicts of interests.

ORCID

Inkyung Baik: https://orcid.org/0000-0002-9524-4344 REFERENCES

1. Ministry of Health and Welfare, Korea Centers for Disease Control and Prevention. Korea Health Statistics 2015: Korea National Health and Nutrition Examination Survey (KNHANES VI-3). Cheongju: Korea Centers for Disease Control and Prevention; 2016.

2. Lee SM, Yoon Y, Baek J, Hyun K, Gang H. Socio-economic Impacts of Major Health Risk Factors and Evaluation on Effects of Regulatory Policy. Seoul: Health Insurance Policy Institute of National Health Insurance Service; 2015.

3. Egger G, Swinburn B. An “ecological” approach to the obesity pandemic. BMJ 1997;315:477-80.

4. Reidpath DD, Burns C, Garrard J, Mahoney M, Townsend M. An ecological study of the relationship between social and environ- mental determinants of obesity. Health Place 2002;8:141-5.

5. Finkelstein EA, Khavjou OA, Thompson H, Trogdon JG, Pan L, Sherry B, Dietz W. Obesity and severe obesity forecasts through 2030. Am J Prev Med 2012;42:563-70.

6. Wang Y, Beydoun MA, Liang L, Caballero B, Kumanyika SK. Will all Americans become overweight or obese? Estimating the progression and cost of the US obesity epidemic. Obesity (Silver Spring) 2008;16:

2323-30.

7. Nacul LC, Soljak M, Meade T. Model for estimting the population prevalence of chronic obstructive pulmonary disease: cross sectional

data from the Health Survey for England. Popul Health Metr 2007;5:8.

8. Statistics Korea. Population projections for Korea: 2010-2060 [Internet]. Daejeon: Statistics Korea; 2011 [cited 2014 October 28].

Available from: http://kostat.go.kr/portal/eng/pressReleases/8/8/index.

board.

9. Pan L, Freedman DS, Gillespie C, Park S, Sherry B. Incidences of obesity and extreme obesity among US adults: findings from the 2009 Behavioral Risk Factor Surveillance System. Popul Health Metr 2011;9:56.

10. Bonauto DK, Lu D, Fan ZJ. Obesity prevalence by occupation in Washington State, Behavioral Risk Factor Surveillance System. Prev Chronic Dis 2014;11:130219.

11. Baik I, Shin C. Prospective study of alcohol consumption and metabolic syndrome. Am J Clin Nutr 2008;87:1455-63.

12. Gangwisch JE, Malaspina D, Boden-Albala B, Heymsfield SB.

Inadequate sleep as a risk factor for obesity: analyses of the NHANES I. Sleep 2005;28:1289-96.

13. Zhao G, Ford ES, Li C, Strine TW, Dhingra S, Berry JT, Mokdad AH.

Serious psychological distress and its associations with body mass index: findings from the 2007 Behavioral Risk Factor Surveillance System. Int J Public Health 2009;54 Suppl 1:30-6.

14. Shimokata H, Muller DC, Andres R. Studies in the distribution of body fat. III. Effects of cigarette smoking. JAMA 1989;261:1169-73.

15. Seidell JC, Cigolini M, Deslypere JP, Charzewska J, Ellsinger BM, Cruz A. Body fat distribution in relation to physical activity and smoking habits in 38-year-old European men. The European Fat Distribution Study. Am J Epidemiol 1991;133:257-65.

16. Yun JE, Kimm H, Choi YJ, Jee SH, Huh KB. Smoking is associated with abdominal obesity, not overall obesity, in men with type 2 diabetes. J Prev Med Public Health 2012;45:316-22.

17. Gilbert DG, Meliska CJ, Williams CL, Jensen RA. Subjective correlates of cigarette-smoking-induced elevations of peripheral beta-endorphin and cortisol. Psychopharmacology (Berl) 1992;106:275-81.

18. Björntorp P. Metabolic implications of body fat distribution. Diabetes Care 1991;14:1132-43.

19. Dai WS, Gutai JP, Kuller LH, Cauley JA. Cigarette smoking and serum sex hormones in men. Am J Epidemiol 1988;128:796-805.

20. Barrett-Connor E, Khaw KT. Cigarette smoking and increased endogenous estrogen levels in men. Am J Epidemiol 1987;126:

187-92.

수치

Table 1. Potential factors contributing to obesity selected from literature reviews and comparative variables selected from the KNHANES data and national statistical data
Table 3. Results of stepwise logistic regression analysis for the prevalence of obesity
Table 4. Results of stepwise logistic regression analysis for the prevalence of abdominal obesity

참조

관련 문서

Prevalence of Undiagnosed Diabetes and Related Factors in Korean Postmenopausal Women:.. The 2011-2012 Korean National Health and

Current Status and Prospect of Industrial Biotechnology Current Status and Prospect Current Status and Prospect.. of Industrial Biotechnology

As a result of multiple regression analysis, the statistically associated factors with burnout were social support, GDS, marital state, self­rated health

This study analyzed the characteristics of smokers in term of structure of household, socioeconomic status and smoking behavior and investigated whether

We find the correlation between marital status and current smoking, including interaction with marriage, occupation level, and Year.. Methods : We used the Korea National

Second, the difference of satisfaction of appearance by marital status showed significant difference in body strength among sub - factors of

™ Visualize the buckling analysis results by listing critical factors and plotting buckling modes. critical factors and

In detail, economic activity and income level in socio-demographic factors showed statistic significance, preparation for the old age in personal factors showed