A Study on the Application Technique of 3-D Spatial Information by integration of Aerial photos and Laser data
항공사진과 레이져 데이터의 통합에 의한 3차원 공간정보 활용기술연구
Yeon, Sang Ho
1) 연상호Abstract
A LiDAR technique has the merits that survey engineers can get a large number of measurements with high preci- sion quickly. Aerial photos and satellite sensor images are used for generating 3D spatial images which are matched with the map coordinates and elevation data from digital topographic files. Also, those images are used for matching with 3D spatial image contents through perspective view condition composed along to the designated roads until arriv- ing at the corresponding location. Recently, 3D aviation image could be generated by various digital data. The advanced geographical methods for guidance of the destination road are experimented under the GIS environments.
More information and access designated are guided by the multimedia contents on internet or from the public tour information desk using the simulation images. The height data based on LiDAR is transformed into DEM, and the real time unification of the vector via digital image mapping and raster via extract evaluation are transformed to trace the generated model of 3-dimensional downtown building along to the long distance for 3D tract model generation.
Keywords : Ubiquitous, 3D Spatial Image, LiDAR, DEM, GIS
1) Regular member· Associate Professor, Department of Civil Engineering in Semyung University.
1. Introduction
The practical use of 3D Perspective image map in construc- tion fields is on an increasing trend after going through many changes in creating method and technology, and ever since the composition of a various geographic information became possible by ortho projection technique using digital map and satellite images (Yeon, 2004; Kim, 2002). The construction planning and designing through the composition of pictures, image data and three-dimensional presentation of digital topo- graphic map are possibly carried out. The application of spa- tial information system to the construction field is being con- sidered as a great solution for a new construction planning technique. Because high resolution images can substitute for the existing digital topographic map and thematic map, the detailed topographic information about the routes of express-
way and local road under construction can be collected and stereo terrain analysis of planned construction routes can be carried out to provide basic spatial information for searching the most reasonable route selection (Yeon et al., 2007). To get local environmental information about the chosen districts, researcher have collected topographic map, air-photo and satellite image data and created 3D perspective image map.
To explain the steps that took in this study briefly; An Ortho-
Image of Yangsan is firstly created using satellite images
from Kompsat-1, LANDSAT TM, SPOT and topographic
map made by National Geographic Information
Institute(NGII) and other information about the target district
and then a 3D perspective image map is created using the
ortho image and DEM. Also digital map data having a
1/5,000-reduced size was made by National Geographic
Information Center in Korea to construct the three dimension-
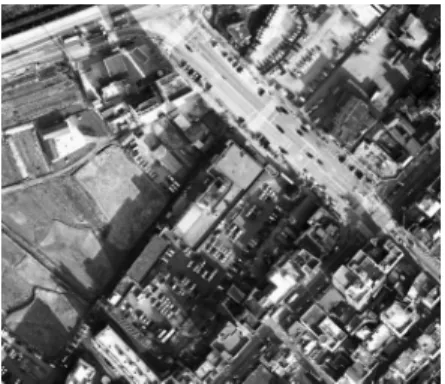
al image using DEM trans formation. This research aims to convert the contour lines on a digital map into the altitudes on the 3D map, and to describe our rigorous tests in various aspects, for example, with virtual navigation on the digital solid map which can be used to provide the useful information for the purpose of touring virtual sites in the cyber space with reality. Fig. 1-2 shows the Aerial photos 2D, 3D perspective view in the study area.
2. Spatial Image
There are several kinds of instruments and methodologies to acquire Images from the terrain surface, which we can cate- gorize into three types; terrestrial image, airborne image, and satellite image.
2.1 Terrestrial Image
As a common type of image acquisition on the ground, digital camera, ground LiDAR(Terrestrial Light Detection and Ranging) can be considered. The image acquired by using ground payload has advantage that the image established can provide spatial information similar to the sight information of human. For terrestrial LiDAR, this sends laser with wave-
length range of visual or near infrared spectrum, receives returning laser by reflecting from the spatial feature, with which measures the distance and accurate horizontal and ver- tical angle of laser beam, and converts the data into 3D coor- dinate. There are time of flight method and triangulation method for distance measuring method of 3D laser scanning.
While triangulation method is to discharge laser to the target, and then determine the position by the inverse calculation with trigonometry for the reflecting beam formed on photo- electronic device(CCD), time of flight method is to discharge laser to the target, and then determine the position by calculat- ing the time difference of reflected and retuning laser(Kim, 2008).
2.2. Airborne Image
Most of the platform acquiring Airborne Image are aircraft and satellite. However, oblique image can get much more information, as it acquires side image of building, tree, or oth- ers, whereas ortho image can acquire only top surface infor- mation of object when look at the building or tree from the air.
For representative instance, Pictometry company takes images with system and generates and offers 3D space modeling data (Kim et al., 2010).
This system consists of Laser Scanner, GPS, and INS.
Among them, Laser Scanner is divided into distance measur- ing part and scanning part, which are integrated, operated, and controled through control part. Its principle is that INS mea- sures the posture of sensor, GPS does for the location of sen- sor, and laser scanner does for the distance between ground surface and the sensor, and eventually determine 3D coordi- nate for the altitude on the ground.
2.3 Satellite Image
Meanwhile the spatial resolution of commercial satellite image is much inferior than that of aviation photo, thus it has been limited for science research areas including climate and environment, but with recent distribution of spatial resolution image which has sub meter level, KOMPSAT-2 is in opera- tion in our country as well extensive high resolution images cross over the country have been acquired continuously. To improve user's visual interpretation and information providing service, many kinds of systems also provide 3D realistic Fig. 1. 3D Aerial photos of 2D perspective view in study area.
Fig. 2. Aerial photos of 3D perspective view in study area.
screen by blending satellite image and DEM data using the stereo matching method of satellite image, LiDAR, and digital map.
With the improvement of spatial resolution satellite image, the hyperspectral satellite image that has hundreds of band, SAR image that can overcome some limitations of impact by cloud and rain. In the situation that the input/output interface of service systems provided in U-City and their utilizability as a core information have been increased according to advanced satellite image, we intend to examine the functions that can support the analysis of high resolution satellite image from U- City service system.
3. Spatial Height
Spatial height consist of contours, spot height, EDM and etc. Recently, DEM is preferred to others, because of integra- tion with other geographic data and automation. In this paper, 3 major techniques of DEM generation are reviewed; Aerial photogrammetry, LiDAR and conversion of digital maps.
3.1 Aerial Photogrammetric Heights
The present procedures with up-to-date photogrammetric systems are as follows. The DEM generation using pho- togrammetric technique should start from scratch and a new DEM will be derived by means of at least two images, each one in several levels of resolution. The method and results with it are described in the literature, for example in Heipke (1995). Professional photogrammetric workstations contain elaborated software packages, and the photogrammetric prac- tice uses the automated photogrammetric generation of DEMs on a routine basis with digitized images taken by analogue cameras or digital aerial photos. If a DEM already exists, its accuracy and completeness may also be improved. The exist- ing heights are used as approximations in the generation of the DEM. The corrections to an existing DEM can also be derived from horizontal parallaxes between two overlapping image pairs. The process can be carried out automatically.
This approach was first presented in Norvelle (1994) and fur- ther refined and tested by other authors. Both approaches have the following steps of production: Acquisition of images, aeri- al triangulation of images, DEM generation or DEM improve-
ment, editing, and quality control.
3.2 LiDAR Heights
Principles of ranging with laser is using pulse and using phase difference. With phase difference, LiDAR measures round trip time and distance using CW(continuous wave) laser system which emit continuous light(Elaksher, 2008).
With pulse, LiDAR measures round trip time and distance using higher energy than CW laser.
For the present, aerial laser mapping systems usually use pulse system. Aerial laser mapping system produces precision DEM by gathering 3 dimensional information of high resolu- tion irregular point for earth’s surface and its reflectance in digital form. The procedures of aerial laser mapping are divid- ed in three parts. First step is convert aerial laser scanning data into 3D data, here position and attitude of laser sensor are determined by IMU (Inertial Measurement Unit), GPS, and point data with horizontal coordinate and vertical height are derived from post-processing. Second step contains convert- ing the height of point data from ellipsoidal height to normal height, checking the errors, eliminating noises, and classifying points into earth surface, building and forest with filtering.
Then, at last point data is interpolated to rasterized DEM and DSM (Digital Surface Model) (NGI, 2002).
Aerial laser mapping data is used as basic information for adding the height to building in construction of 3D city model. In legacy city model 2D building polygons are extrud- ed to the building height. By adopting LiDAR, not only sim- ple building model but also minute structures in rooftop can be modeled, precision and automation of 3D surface model is improved dramatically. By this reason large amount of 3D city model can be produced effectively (Jeong et al., 2005).
3.3 Converted Height of Digital Maps
Generating DEM from contour lines is still one of the major methods to get grid DEM because of its low cost and the convenience to get contour maps. One of the most impor- tant parts of DEM building is interpolation. Watson (1992), Wood and Fisher (1993), Wood (1994), Li (1994) and Carrara et al. (1997) compared different algorithms of interpolation.
Generally, generating DEM from contour lines are two dis-
tinct methods; One is DEM is generated directly from contour lines and the other is DEM is generated from TIN(Triangular Irregular Network).
In direct method, during generating DEM from contour lines, the vector contour lines generally need to be converted into raster model data before local interpolation methods can be used. In the implementation of GIS software, usually the elevation of a cell with only one contour line is simply assigned with the contour line elevation. We call this kind of cells single-value cell (SVC). Another kind of cell is the one with more than one contour line through it. We call this kind of cells multi-value cell (MVC). An effective method to deal with such kind of cells was given by Kunqing Xie et al., (2003). And the elevations of the cells without any contour lines through, which are called no-value cell (NVC), are inter- polated according to nearby SVCs and MVCs.
Using TIN method, TIN can be generated based on the geometry of the thiessen polygons. Thiessen polygons are generated from mass points in polyline of contours, points of spot heights and points in break-lines, then DEM is interpolat- ed from TIN.
4. Spatial Data Integration
4.1 Data Preparation
For the 3D Terrain Analysis of satellite images, collect satellite images of target district according to the purpose and property of objects and use them after color-composite.
Differentiate Road network files from Contour Line files of Digital Topographic Map, which was made to get DEM (Digital Elevation Model) of target district and use the suit- able software for processing of collected topographic informa- tion. The three requisites, which should be primarily prepared for this study, are as follows: The initial file of the HDF for- matted satellite image of target district captured by EOC sen- sor of Kompsat 1 and the IMG formatted satellite image of the same district captured by TM sensor of LANDSAT. The files of 1:5,000 topographic map made by NGI in Korea as a digital map and road's planned route data, the CAD files of road's planned route of the target district. Then survey the
suitable s/w solution for integration of the vector and raster.
4.2 Procedure for Integration
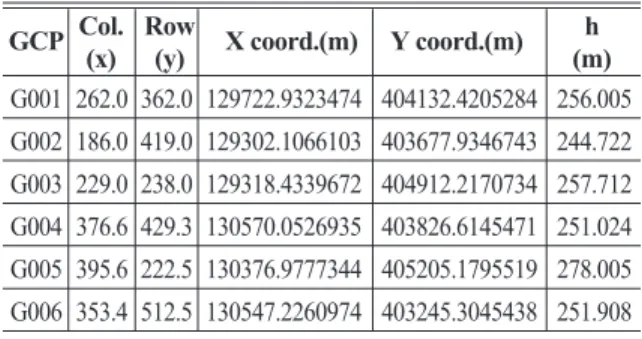
After preparation of images and data, which is suitable for the purpose of this study, I got to find the precise geographic coordinate of target district on the images. For this reason, it carried out geometric correction using to make three images, which are different from each other in resolution, fit into geo- graphic coordinate and after that, carried out close orthodox correction using TM coordinate, a geographic coordinate especially used for the current construction design. The basic map projection method for ortho correction image mapping is TM E002 Projection. And that is the map projection method being used by National geographic institute for mapping. For data Input, The primary satellite image used in this study is the image from Kompsat 1. The HDF formatted panchromatic Band 1 captured by EOC sensor, and calculate the orbit infor- mation of the moving satellite. And then, for DEM creation, the convert DXF formatted file of 1/5,000 topographic map to raster image file. After format conversion, you can create DEM. For ortho-projection correction image mapping, it processed of collecting GCP. To get precise ortho-correction image, it collected coordinate values of GCP corresponding to specific points of satellite image using files of 1/5,000 topo- graphic map and DEM files. In this study, once it found the location of a fixed construction such as a building roof, end point of a bridge and a corner of road, it could get TM coordi- nate and the altitude of the construction on digital map. And the correction estimation was to create ortho-projection image, it carried out the following two corrections use of BAM(Bundle Adjustment Method) for estimation of exterior orientation using GCP.
Table 1. Matching point of image and map for GCP GCP Col. Row X coord.(m) Y coord.(m) h
(x) (y) (m)
G001 262.0 362.0 129722.9323474 404132.4205284 256.005
G002 186.0 419.0 129302.1066103 403677.9346743 244.722
G003 229.0 238.0 129318.4339672 404912.2170734 257.712
G004 376.6 429.3 130570.0526935 403826.6145471 251.024
G005 395.6 222.5 130376.9777344 405205.1795519 278.005
G006 353.4 512.5 130547.2260974 403245.3045438 251.908
4.3 Perspective Image Mapping by Projection View
In this study, Perspective Image Mapping model was made through the composition of various files to express in perspec- tive mapping programs. To describe it briefly, the process is as follows; Inputting RGB channel, DEM channel and vector layer through program module creating projected image through Image Projection Algorithm of perspective module showing the results on the computer screen through view module creating the files of 3-D perspective image map (Yeon et al., 2007).
Perspective Image Map that is supposed to be made through this study is a 3D Image viewed from 45 angles in the four cardinal directions.
4.4 The integration and application test result of urban spatial aerial photo, the laser data
When the high resolution digital camera was mounted in an aircraft and the aerial photograph was performed in the sec- ond ten days of a month in April 2008 and the exact map image was prepared through the minute investigation correc- tion work in order to take a photograph the topographical space information of the urban space in which it go on living most precisely.
The spatial resolution of a terrestrial was done by 1m and it synthesized in RGB, that is the 3 channel of the light, and the color photo was produced. The Laser measurement about this region was conducted in the public and the slant distance
Fig. 3. Perspective image (EOC-1) from the east.
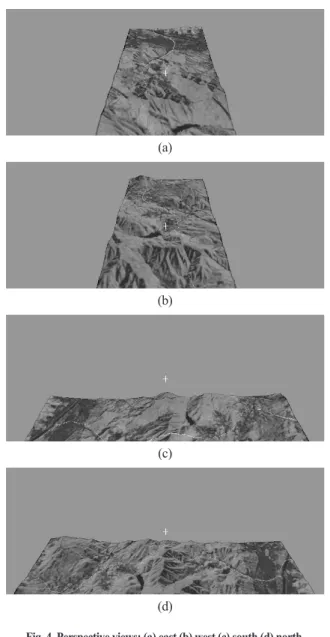
(a)
(b)
(c)
(d)
Fig. 4. Perspective views; (a) east (b) west (c) south (d) north.
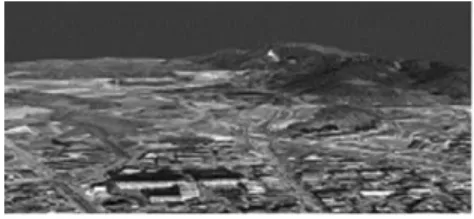
Fig. 5. 3D Perspective view from the east.
10m and it converted to the vertical gap and it produced at DEM.
The elevation value of DEM in which it is vertically con- verted on the hardness at the aerial photo of the orthogonal view, and the horizontal coordinates of the latitude with the point-to-point mapping value was connected and 3D topo- graphical space was produced and the seeing through air view after the aerial photo of the test objects region and DEM matching were freely reflected in the angular orientation (Fig.6 and 7).
which it can produce the perspective view analysis, the seeing through birds eye view, and the earth-volume estimate for the three-dimensional terrain analysis of the test objects region, and then the plan cross-sectional view was produced from the aerial photo (Fig.8, Fig.9, Fig.10).
5. Conclusions
Recently in the local government, it is interested in the U- city business of construction. The U-city business, that is the kernel of the digital age, is promoted to establish the goal of the U-city construction in which many local governments can improve the quality of life of a citizen. Firstly existing data, including the topographical elements, are collected to apply a lot of 3D spatial information for the corresponding U-city applications. From such collected data, the unnecessary archa- ic investigation and work load can be reduced. In case of Korea across the country 3D spatial information having been used for building the wire/wireless communication facilities and sensor network using the completed digital topographical map and data of the aerial photo. Especially, in 3D U-city, since 3D graphic model is minute about a part of the specific area, it is reconstructed and can be provided for a Ubiquitous Sensor Network (USN) if necessary (Wilson, 1989). Since there are many cases that fuse the various raw spatial informa- tion with other information, it is required to provide a service for the modeling work of the delicate topographical space. In case of that, it is usable for an enterprise of intelligent national land information from many sides.
Accordingly, it is determined as the most optimal informa- tion gathered. In addition, it means that collects the spatial information of the high density with high precision like the Fig. 6. Aerial photo (1m).
Fig. 7. Perspective image.
Fig. 8. Laser scanning with aerial photo(10m grid).
Fig. 9. Perspective image after matching aerial photo and digital elevation maps
Fig. 10. Terrain Cross Section volume from
3D perspective integration result image.
aerial LiDAR for a production and that utilizes more efficient of a 3D U-city and it is one of the most ideal method for serv- ing the recent 3D space cities (Yeon, 2009). Because of the topography simulation technique, general analysis modeling of three dimensional spaces is able to feel the stereoscopic perception in the moving picture of a real time basis rather than the plane landform analysis. Various graphics and the region scenes are suitable for establishment and design of the community development plan. 3D method for simulation of this kind for the topographical space changes under the given condition provides more reality of movement feeling and 3D simulation of such topographical space shows the quick simu- lating method to process an image. In addition, it will be expanded to our construction over whole industries and it let us lead the real life freely in three dimensions.
Acknowledgement
This work was supported by the Semyung University for Science Research Support Program in 2008. (위 연구는 2008년도 세명대학교의 교내학술연구과제 지원사업에 의하여 수행되었습니다.)
References
A. Elaksher. (2008), Fusion of hyper spectral images and lidar-based dems for coastal mapping, Optics and lasers in engineering, Vol. 46, No. 7, pp. 493-498.
B.C. Wilson (1989), Modeling and Measurements of Light Propagation in Tissue for Diagnostic and Therapeutic Applications, Laser Systems for Photobiology and Photomedicine, Plenum Press, N.Y. and London, pp. 13- 27.
Carrara, A., Bitelli, G., Carla, R. (1997), Comparision of tech- niques for generating digital terrain models from contour lines, International Journal of Geographical Information Science, Vol. 11, No. 5, pp. 451-473.
Heipke, C. (1995), State-of-the-art of digital photogrammetric workstations for topographic applications, Photogrammetric Engineering & Remote Sensing, Vol. 61, No. 1, pp. 49-56.
Hyungtae Kim (2002), Implementation of Digital Orthophoto
using LIDAR Data, Journal of Korea Society for Survey and Mapping, Vol. 20, No. 2, pp. 137-143.
Hyung Tae Kim, Sang Bong Kim, Jong Sik Go, Yang Dam Eo, Byoung Kil Lee (2010), Building 3D Geospatial Information using Airborne Multi-Looking Digital Camera System, Journal of Convergence Information Technology, Volume 5, Number 1, pp. 15-22.
J.W. Jeong, H.J. Jang, Y.S. Kim, W.S. Cho (2005), Automatic Building Extraction Using LIDAR and Aerial Image, The Journal of Korean Geo-Spatial Information System, Vol. 13, No. 3, pp. 59-67.
Kim, S. H. (2008), DEM Fusion of Airborne and Terrestrial LiDAR Data, Graduate School of Kwandong Univ., Master's Thesis, pp. 6-8.
Kunqing Xie, Yongqiu Wu, Xiujun Ma, Yu Liu, Baoyuan Liu, R.Hessel (2003), Using contour lines to generate digi- tal elevation models for steep slope areas: a case study of the Loess Plateau in North China, Catena, Vol. 54, pp. 161- 171.
Li, Z. (1994), A comparative study of the accuracy of digital terrain models (DTMs) based on various data models, Journal of Photogrammetry and Remote Sensing, vol 49, pp. 2-11.
Norvelle, F.R. (1994), Using interactive orthophoto refine- ments to generate and correct digital elevation models (DEMs), Proceedings of Mapping and Remote Sensing Tools for the 21st Century, American Society for Photogrammetry and Remote Sensing, Bethesda, Maryland, pp. 134-142.
NGI (2002), Regulations for DEM Operation, Regulation for Operation, No. 2002-107.
S.H. Yeon (2000), Experimental studies on the extraction technique for Digital orth-ophoto complete and the DEM generation, Proceeding of KAGIS’s spring convention, pp.
159-166.
Sangho Yeon (2004), A Study on the 3-D Perspective Image Generation and Terrain Simulation for Land Survey and Design, Journal of Korea Society for Cadastral, Vol. 20, No. 2, pp. 61-68.
Sangho Yeon (2009), Application Methods for Terrain
Modeling of Local Industry Complex area Construction,
journal of the research of Industrial Science and
Technology of Semyung University, Vol. 16, pp. 41-47.
Sangho, Yeon Youngdae Lee (2007), 3-D Railway track gen- eration and application based on LIDAR Data for Railway Route Management, Proceeding of Fall Convention of Korea Society Railway, pp. 70-75.
S. Rastegar, M. Motamedi, et al. (1990), A Theoretical Analysis of Dynamic Variation of Temperature Dependent Optical Properties in the Response of Laser Irradiated Tissue, SPIE Laser-Tissue Interaction, 1202, pp. 253-259.
Wood, J. (1994), Visualizing contour interpolation accuracy in digital elevation models, Hearnshaw, H.M., Unwin, D.J.
(Eds.), Visualization in Geographical Information Systems.
Wiley, Chichester, pp. 168-180.
Wood, J.D., Fisher, P.F. (1993), Assessing interpolation accu- racy in elevation models, IEEE Computer Graphics and Applications, pp. 48-56.
(접수일 2010. 06. 11, 심사일 2010. 06. 18, 심사완료일 2010. 06. 22)