Introduction
The coastal areas generally support different fish species, a greater diversity and abundance of fish, and larger numbers of juveniles on a world- wide scale. Many fish species use coastal areas as feeding and nursery grounds, including many economically important fishes (Jenkins and Wheatley, 1998; Lazzari et al., 1999; Guidetti, 2000; Paperno et al., 2001; Kwak and Klumpp, 2004). Recent studies of fish assemblages on coastal areas in Korea have reported seasonal variation in species composition and abundance of fishes with using small trawl (Lee, 1989; Cha an Park, 1997; Huh and Kwak, 1998a; Lee and
Gil, 1998; Huh and Chung, 1999; Huh and An, 2000; Oh, 2003), gill net (Kim and Kang, 1991;
Hwang et al., 1997; Cha, 1999; Han et al., 2002), and set nets (Lee and Seok, 1984; Go and Shin, 1988; Huh and Kwak, 1998b; Lee, 1998; Hwang, 1998; Hwang et al., 1998; Huh and An, 2002).
Masan Bay have been known one of heavily polluted area in the southern part of Korea.
Environmental disturbances such as red tide and pollutant load have occurred every year due to industrial complex around coastal areas since 1980’s, however, improving of water quality with construction of sewage treatment plant were in Masan Bay nowadays (Kim, 2003; Oh et al., 2005).
To date the study in Masan Bay has been con- fined to sustainable management for target water quality (Ju et al., 2000; Lee and Park, 2003; Oh et al., 2005), and far less is known about the
Temporal Variation in Species Composition and Abundance of Fish Assemblages in Masan Bay
Seok Nam Kwak* and Sung-Hoi Huh
1Marine Eco-Technology Institute Co., Ltd., 485-1 Yongdang-dong, Namgu, Busan 608-830, Korea,
1Department of Oceanography, Pukyong National University, 599-1 Daeyeon-Dong, Namgu, Busan 608-737, Korea
A total of 27 fish species were collected by a gill net in Masan Bay. The dominant fish species were Konosirus punctatus, Mugil cephalus, Engraulis japonicus, Psenop- sis anomala, Lateolabrax japonicus, Leiognathus nuchalis, Chelon affinis, Trachurus japonicus, and these accounted for 87.6% of the total numbers. The numerically dom- inant fish species made up 95.4% of biomass. These were primarily juvenile species or early larger species. Temporal variation in both species composition and abun- dance was large: the peak number of fishes occurred in March 2005 and July 2005, whilst biomass of fishes was the highest in September 2005 and November 2005. Fish numbers as well as biomass was lowest in November 2005. Temporal changes in the abundance of fishes corresponded with temperature. A gill net can be used as an alternative fishing gear to collect pelagic fishes commercially, although a gill net has a strong selectivity for the target fish species or for size.
Key words : Konosirus punctatus, Mugil cephalus, Engraulis japonicus, Psenopsis anomala, Lateolabrax japonicus, Leiognathus nuchalis, gill net, fish assemblage, Masan Bay
*Corresponding author: [email protected]
─
─ 132 ──
studies on fish assemblages compared with other regions of Korea except the report was communi- ty patterns of demersal fishes by the baited traps and bottom gill nets (Youm, 1997). Few studies have been conducted on fish assemblages with using gill nets. These were included studies on the seasonal variation in species composition and abundances of fishes in the coastal off Shinsudo, Samchonpo (Kim and Kang, 1991), Heunghae (Hwang et al., 1997), Geoje Island (Cha, 1999), and Gadeok-do (An and Huh, 2003).
The objective of this study was to examine the temporal variation in species composition and abundance of fishes inhabiting in Masan Bay, Korea and to determine the relationships bet- ween environmental factors and fish abundance.
Methods
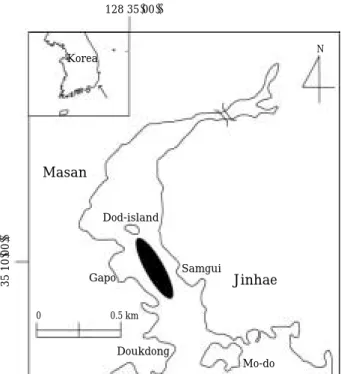
Masan Bay was a semi-closed bay and were located several small islands (Fig. 1). Fish sam- ples were collected by drift gill net (multi-fila- ment, 22~150 mm stretched mesh size) with 2~
3 months intervals from September 2004 to January 2006. Nets were set at 06:00 h and fish retrieved at 19:00 h at night.
Specimens were preserved immediately in 10%
formalin after capture and later transferred to 70% isopropanol. These samples were identified according to Masuda et al. (1984), Yoon (2002), and Kim et al. (2005), and weighed to the nearest gram in wet weight. Specimens were measured to the nearest mm (standard length SL). Water temperature (by thermometer) and salinity (by salinometer) were monitored on each sampling occasion.
The fish data was analysed to obtain the fol- lowing community variables. Diversity H
′(Shan- non and Weaver, 1949) was calculated as:
H′ = =-Σ(ni/N) log (ni/N),
where n is the number of individuals of each i species in a sample and N is the total number of individuals. Association of fish species, Pianka’s similarity index (Pianka, 1973), A
ijwas calculat- ed as:
A
ij= =[
Σp
ihp
jh]/[
Σ2ihΣp
2jh]
where A
ijis the similarity of species j on spec- ies i p
ihis the proportion of individuals of Ai in a particular month h p
jhis the proportion of indi- viduals of Aj in a particular month h. Values for
the similarity index may vary between 0, if no similarity occurs, and 1 for complete similarity.
The Pianka’s similarity index was subjected to an average linkage cluster analysis.
A one-way ANOVA with orthogonal design was used to analyse variations in fish abundance and environmental factors with month. The rela- tionships between fish abundance and environ- mental factors were analysed using Pearson’s correlation coefficient.
Results
Temperature and salinity
Temperature at the study site ranged from 9.6
� C to 26.5� C and varied significantly with months (one way ANOVA, F= =16.8, p⁄0.05). The peak of temperature was around July 2005, a decline in September 2005 and a minimum during winter (January 2006) (Fig. 2). Salinity ranged from 23.4‰ to 32.9‰ and did not vary significantly between months (one way ANOVA, F= =4.31, p¤
0.05) with display a similar pattern except in July 2005 when it dropped (about 23.4‰) (Fig.
2).
Fish species composition
A total of 2,346 fish belonging to 27 species
Fig. 1. Map showing the sampling site (the black area).
128 35′00′′
Masan
Dod-island Korea
Samgui Gapo
Doukdong
0 0.5 km
Mo-do
Jinhae
N
35 10′00′′
were collected from Masan Bay (Table 1). Nu- merically dominant fish were Konosirus punc- tatus (23.1%), Mugil cephalus (18.9%), Engraulis japonicus (15.2%), Psenopsis anomala (7.4%), Lateolabrax japonicus (6.2%), Leiognathus nu- chalis (6.1%), Chelon affinis (5.4%), and Trach- urus japonicus (5.3%), together accounting for 87.6% of the catch. The numerically dominant fish species made up 95.4% of biomass because of the presence of large M. cephalus (57.9% of bio- mass) which were high in biomass.
Temporal variation in abundance of fish
The number of fish species (13~22 species) varied with months (one-way ANOVA, F= =10.8, p⁄0.05). Fish species was abundant in Septem- ber 2004 and May 2005 (Fig. 3-a). Number of in- dividuals varied significantly with months (one- way ANOVA, F= =13.4, p⁄0.05, Fig. 3-b). Fish were abundant March 2005 and July 2005 when K. puntatus, M. cephalus, L. japonicus and C.
affinis were dominant. Fish numbers was the lowest in January 2006 (Appendix 1). The fish biomass differed substantially between different seasons (one-way ANOVA, F= =9.77, p⁄0.05, Fig.
3-c). Highest biomass was in September 2005 and November 2005 when many large M. cepha- lus and K. punctatus were present (Appendix 1).
The range of diversity index was 1.69~22.5, and higher value was in March 2005 and May 2005 (Fig. 3-d).
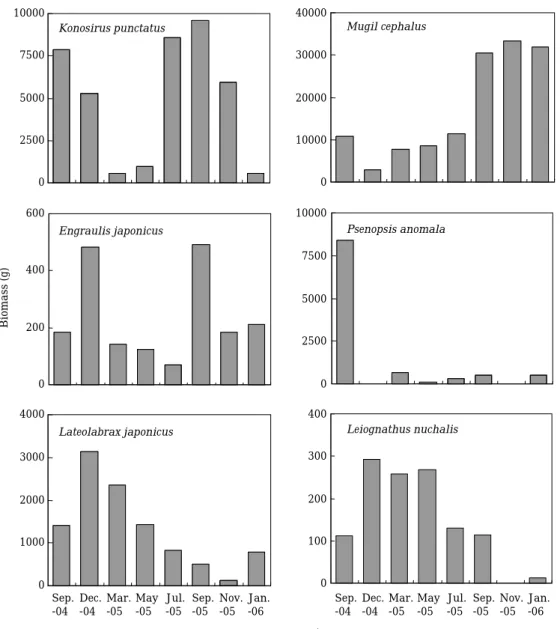
Abundance of common fish species varied with months, and were distinct patterns with each fish species (Figs. 4, 5). For example, peak num- bers of K. punctatus were in July 2005 (140 ind.),
and biomass was peaked in July 2005 (8,582.0 g) and September 2005 (9,590.4 g) due to many lar- ger individuals in these periods. Number of in- dividuals of M. cephalus was highest in July 2005 (79 ind.), however, biomass was peaked in Sep- tember 2005, November 2005, and January 2006.
Peak abundances of E. japonicus were in Novem- ber 2004 and September 2005. Abundances of P.
anomala were peaked in September 2004 (117 ind., 8,404.3 g), however, few abundances were in other periods. Number of individuals of L. japo- nicus and L. nuchalis were higher in May 2005 (43 ind., 42 ind.), however, higher biomass was in November 2005 (1,411.4 g, 293.0 g).
The dendrogram shows five clusters which iden- tify the fish species (Fig. 6). The first group was composed of K. punctatus, E. japonicus, M. cepha- lus, L. japonicus, L. nuchalis, C. affinis, Repomu- cenus valenciennei, Hexagrammos otakii, and
0 5 10 15 20 25 30
Sep.
-04 Dec.
-04 Mar.
-05 May -05
Jul.
-05 Sep.
-05 Nov.
-05 Jan.
-06 Month (2004~2006)
0 5 10 15 20 25 30 35
Salinity(‰)
Temperature Salinity
Temperature(�C)
0 5 10 15 20 25
Number of species
0 100 200 300 400 500
Number of individuals
0 10 20 30 40 50
Biomass(kg)
0 10 20 30 40 50
Diversity index(H′)
Sep.
-04 Dec.
-04 Mar.
-05 May -05
Jul.
-05 Sep.
-05 Nov.
-05 Jan.
-06 Month (2004~2006)
(A)
(B)
(C)
(D) Fig. 2. Temporal variations of temperature and salinity
in Masan Bay.
Fig. 3. Temporal variations in (A) Number of species, (B) number of individuals (C) biomass, and (D) diver- sity index of fish species in Masan Bay.
Limanda yokohamae with occurring predomi- nantly over study periods. This group can be fur- ther divided into three subgroups: subgroup A contains K. punctatus, E. japonicus, and M. ce- phalus with higher numbers during study peri- ods, subgroup B composed of L. japonicus, L.
nuchalis, and C. affinis with peak numbers in May 2005, and subgroups C was consisted of R.
valenciennei, H. otakii, and L. yokohamae which were highr numbers in March 2005 and May 2005. The second group was composed of Sardi- nella zunasi, Acanthogobius flavimanus, Sebastes inermis, S. longipinnis, and Thryssa kammalen- sis. This group was high numbers May 2005 and July 2005, while number of individuals were few in other periods. The third group was composed of P. anomala, Acanthopagrus schlegeli, R. luna- tus and Platycephalus indicus which were peak numbers in September 2004 and September 2005.
The fourth group was consisted of T. japonicus and Ditremma temmincki with occurrence in July 2005. The fifth group was composed of Kareius bicoloratus and Hypodytes rubrippinis with high- er numbers in March 2005.
Discussion
Gill net, the name of the net employed, illus- trates the method used to snare target fish. They try to swim through deliberately sized mesh openings but are unable to squeeze through swi- mming forward. Once in this position, they are prevented from backing out due to the tendency for their gills to become caught. This effectively traps them. These methods were classified by sink gill net (e.g. bottom gill net, and trammel net) and drift gill net. In general, pelagic fishes were collected by drift gill net, whereas demersal fishes were in sink gill net.
A total of 27 fish species was recorded from Masan Bay and Konosirus punctatus, Mugil cep- halus, Engraulis japonicus, Psenopsis anomala, Lateolabrax japonicus, Leiognathus nuchalis, Chelon affinis and Trachurus japonicus were numerically dominant. Most of fish species are of commercial and recreational importance. For example Hexagrammos otakii, K. punctatus, M.
cephalus, L. japonicus, and C. affinis are va-lued as live fish in the Southern area, Korea, and P.
anomala, and T. japonicus harvested as a food fish (Kim and Kang 1993; Yoon, 2002). Compared with studies of fish assemblages in the coastal area off Gadeok-do nearby the study area, non- commerical fishes such as Repomucenus valen- ciennei, Thrissa kammalensis, L. nuchalis, Zoar- ces gillis, Sillago japonicus were dominated by small trawl, whereas commercial fish species (e.g. Limanda yokohamae, Cynoglossus abbrevi- atus, Ditremma temmincki, Hexagrammos oatkii etc.) were abundant with using bottom gill net (An and Huh, 2003). These results indicated that higher numbers of commercial fish species were collected with gill nets. Such conclusions are in general agreement with other studies of fish as- semblages in the coastal area, Korea. Hexagra- mmos otakii, H. agrammus, and S. inermis were common fish species in the coastal water off Shin- sudo, Samchunpo, and Heunghae (Kim and Kang, 1991; Hwang et al., 1997), Stephanolepis cirrhi- fer, D. temmincki and L. yokohamae were abun- dant around Geoje Island (Cha, 1999).
Table 1. Total number of individuals and biomass of fish species in Masan Bay
Species Total
N % W %
Konosirus punctatus 542 23.0 39,387.7 16.7 Mugil cephalus 443 18.8 136,696.8 57.9 Engraulis japonicus 356 15.1 1,886.0 0.8 Psenopsis anomala 174 7.4 10,483.7 4.4 Lateolabrax japonicus 145 6.2 10,578.5 4.5 Leiognathus nuchalis 144 6.1 1,187.1 0.5 Chelon affinis 127 5.4 16,671.6 7.1 Trachurus japonicus 125 5.3 8,161.8 3.5 Sardinella zunasi 63 2.7 1,106.1 0.5 Ditremma temmincki 41 1.7 1,615.4 0.7 Repomucenus valenciennei 29 1.2 644.2 0.3 Hexagrammos otakii 28 1.2 2,427.7 1.0 Acanthogobius flavimanus 25 1.1 545.2 0.2
Limanda yokohamae 20 0.8 970.8 0.4
Sebastes inermis 19 0.8 318.1 0.1
Acanthopagrus schlegeli 14 0.6 1,703.6 0.7 Thryssa kammalensis 12 0.5 295.9 0.1 Kareius bicoloratus 10 0.4 304.4 0.1 Hypodytes rubrippinnis 8 0.3 151.1 0.1 Sebastes longispinis 6 0.3 143.4 0.1
Repomucenus lunatus 5 0.2 119.5 0.1
Platycephalus indicus 3 0.1 314.2 0.1 Argyrosomus argentatus 2 0.1 154.4 0.1
Trichiurus lepturus 1 0.0 22.6 0.0
Clupea pallassi 1 0.0 19.5 0.0
Sebastes schlegeli 1 0.0 31.2 0.0
Sillago jaonicus 1 0.0 25.4 0.0
Oplegnathus fasciatus 1 0.0 53.1 0.0
Total 2,346 100 236,019.0 100
N : Number of individuals, W : biomass (g)
Each dominant fish species exhibited their own distinct seasonal occurrence pattern and differ- ent time of peak abundance. Peak numbers of K.
punctatus in August 2004, those of E. japonicus were in November 2004 and October 2005, M.
cephalus were in August 2005 and January 2006, P. anomala were in September 2004, L. japoni- cus and L. nuchalis were in April 2005. This re- sults indicate that peak abundance was closely related with rapid increase of larval recruitment.
Peak larval recruitment and abundance of one species was separated several months from other
species, with some overlap with another species.
After one fish population increased rapidly, it sustained peak abundance for several months and then decreased sharply. Subsequently, ano- ther fish population increased and reached peak abundance. Hence the coastal area in Masan Bay were partitioned temporally by dominant fish species in this ways. Other studies have shown similar patterns of variable in fish assemblages of coastal areas, Korea (Lee, 1989; Huh and Kwak, 1997, 1998a, b; Huh and Chung, 1999; An and Huh 2002, 2003).
0 40 80 120 160
0 30 60 90
0 25 50 75 100
0 20 40 60 80 100 120 140
0 10 20 30 40 50
0 10 20 30 40 50
Konosirus punctatus Mugil cephalus
Engraulis japonicus Psenopsis anomala
Lateolabrax japonicus Leiognathus nuchalis
Number of individuals
Sep.
-04 Dec.
-04 Mar.
-05 May -05
Jul.
-05 Sep.
-05 Nov.
-05 Jan.
-06
Sep.
-04 Dec.
-04 Mar.
-05 May -05
Jul.
-05 Sep.
-05 Nov.
-05 Jan.
-06 Month (2004~2006)
Fig. 4. Temporal vaiations in number of individuals of common fish species in Masan Bay.
Temporal variation in both species composition and abundance of fish species appear to be con- siderable for fish assemblages. In Masan Bay, number of individuals was highest in May 2005, and July 2005 when higher temperature was in temperate area. Several other studies have de- monstrated a positive correlation between tem- perature and fish abundances (Lee and Seok, 1984; Edgar and Shaw, 1995; Huh and Kwak, 1998b; Lazzari et al., 1999; Paperno et al., 2001;
Huh and An, 2002; Oh, 2003).
Konosirus punctatus, M. cephalus, and E. japo- nicus, among common fish species, were com- prising 57.2% of total number of individuals and 75.4% of total biomass, and this paralleled the
high dominance of L. yokohamae (53.3% of total numbers, and 42.2% of total biomass) were col- lected with bottom gill net in the coastal warer off Gadeok-do (An and Huh, 2003) and also this species were predominated in the study area (Youm, 1997). These results may be explained gear selectivity by sized mesh opening of gill net and then suitable fish size were caught. An and Huh (2003) also demonstrated that size distri- bution of most common fish species collected by bottom gill net did not varied with months. Drift gill net fishery developed rapidly in the late 2000s off Gyeongsang Namdo including Masan Bay. In particular, Masan Bay was a semi-closed bay, and higher water velocity give it for fisher-
0 2500 5000 7500 10000
0 10000 20000 30000 40000
0 200 400 600
0 2500 5000 7500 10000
0 1000 2000 3000 4000
0 100 200 300 400
Biomass (g)
Konosirus punctatus Mugil cephalus
Engraulis japonicus Psenopsis anomala
Lateolabrax japonicus Leiognathus nuchalis
Sep.
-04 Dec.
-04 Mar.
-05 May -05
Jul.
-05 Sep.
-05 Nov.
-05 Jan.
-06
Sep.
-04 Dec.
-04 Mar.
-05 May -05
Jul.
-05 Sep.
-05 Nov.
-05 Jan.
-06 Month (2004~2006)
Fig. 5. Temporal variations in biomass of common fish species in Masan Bay.
man to deploy the drift gill net and then the cat- ch of K. punctatus, M. cephalus, and E. japonicus were increasing. These fish species were coin- cided with common fish species in the study area. Hence we suggested that drift gill net was a reasonable gear for studies of pelagic fishes commercially in the coastal area although the gill net were strong the gear selectivity by mesh size.
Aknowledgement
We are grateful to Hwa Won Kim and Ju Myeon Park, Department of Oceanography, Pukyong National University for assistance with sampling and data analysis. We also thank Dr. David W Klumpp (AIMS) for his constructive comments in structure of English.
References
An, Y.R. and S.H. Huh. 2002. Species composition and seasonal variation of fish assemblage in the coastal water off Gadeok-do, Korea. 3. Fishes collected by crab
pots. J. Kor. Fish. Soc., 35 : 715~722.
An, Y.R. and S.H. Huh. 2003. Species composition and seasonal variation of fish assemblage in the coastal water off Gadeok-do, Korea. 4. Fishes collected by bot- tom gill nets. J. Kor. Fish Soc., 36 : 686~694.
Cha, B.Y. 1999. Species composition of fish in coastal water off Goeje Island. Kor. J. Ichthyol., 11 : 184~190.
Cha, S.S. and K.J. Park. 1997. Seasonal changes in species composition of fishes collected with a bottom trawl in Kwangyang Bay, Korea. Kor. J. Ichthyol., 9 : 235~243.
Edgar, G.J. and C. Shaw. 1995. The production and trophic ecology of shallow-water fish assemblages in southern Australia. I. Species richness, size-structure and pro- duction of fishes in Western Port Bay, Victoria. J. Exp.
Mar. Biol. Ecol., 194 : 53~82
Go, Y.B. and H.S. Shin. 1988. Species occurrence and food chain of fisheries resources, nekton, on the coast of Pukchon, Cheju Island. I. Species composition and diversity. Bull. Kor. Fish. Soc., 21 : 131~138.
Guidetti. P. 2000. Differences among fish assemblages associated with nearshore Posidonia oceanica seagrass beds, rocky-algal reefs and unvegetated sand habitats in the Adriatic Sea. Estuarine Coast. Shelf Sci., 50 : 515~529.
Han, K.H., J.C. Son, D.S. Hwang and S.H. Choi. 2002.
Species composition and quantitative fluctuation of fishes collected by trammel net in coastal waters of Seokbyeong, Pohang. Kor. J. Ichthyol., 14 : 109~120.
Huh, S.H. and S.G. Chung. 1999. Seasonal variation in species composition and abundance of fishes collected by an otter trawl in Nakdong River Estuary. Bull. Kor.
Soc. Fish. Tech. 35 : 178~195.
Huh, S.H. and S.N. Kwak. 1997. Species composition and seasonal variations of fishes in eelgrass (Zostera ma- rina) bed in Kwangyang Bay. Korean J. Ichthyol., 9 : 202~220.
Huh, S.H. and S.N. Kwak. 1998a. Seasonal variations in species composition of fishes collected by an otter trawl in the coastal water off Namhae Island. Kor. J. Ichth- yol., 10 : 11~23.
Huh, S.H. and S.N. Kwak. 1998b. Species composition and seasonal variations of fishes collected by winged stow nets on anchors off Namhae Island. Bull. Kor. Soc.
Fish. Tech., 34 : 309~319.
Huh, S.H. and Y.R. An. 2000. Species composition and sea- sonal variation of fish assemblage in the coastal water off Gadeok-do, Korea. 1. Fishes collected by a small otter trawl. J. Kor. Fish. Soc., 33 : 288~301.
Huh, S.H. and Y.R. An. 2002. Species composition and sea- sonal variation of fish assemblage in the coastal water off Gadeok-do, Korea. 2. Fishes collected by three sides fyke nets. J. Kor. Fish Soc., 35 : 366~379.
Hwang, S.D. 1998. Diel and seasonal variations in species composition of fishery resources collected by a bag net off Kogunsan-gundo. Kor. J. Ichthyol., 10 : 155~163.
Hwang, S.D., Y.J. Im, Y.C. Kim, H.K. Cha and S.H. Choi.
1998. Fishery resources off Youngkwang I. Species composition of catch by a stow net. J. Kor. Soc. Fish., 31 : 727~738.
Hwang, S.D., Y.J. Park, S.H. Choi and T.W. Lee. 1997.
1 0
Group I
Group II
Group III
Group IV
Group V 0.5
Sebastes inermis
Trachurus japonicus Ditremma temmincki Platycephalus indicus Acanthopagrus schlegeli Thryssa kammalensis Lateolabrax japonicus Leiognathus nuchalis Chelon affinis
Hypodytes rubrippinis Repomucenus lunatus
Kareius bicoloratus Psenopsis anomala Acanthogobius flavimanus
Sebastes longispinis Mugil cephalus Konosirus punctatus Engraulis japonicus
Repomucenus valenciennei Hexagrammos otakii Limanda yokohamae Sardinella zunasi
Fig. 6. Dendrogram illustrating the species associations of fishes in Masan Bay.
Species composition of fishes collected by trammel net off Heunghae, Korea. J. Kor. Soc. Fish., 30 : 105~113.
Jenkins. G.P. and M.J. Wheatley. 1998. The influence of habitat structure on nearshore fish assemblages in a southern Australian embayment: comparison of shal- low seagrass, reef-algal and unvegetated sand habitat, with emphasis on their importance to recruitment. J.
Exp. Mar. Biol. Ecol., 221 : 148~172.
Ju, J.K., B.G. Hwang and J.R. Lee. 2000. Water-quality prediction using a eutrophication model. Proceeding of J. of Kor. Soc. on Wat. Qual. 351~353.
Kim, C.K. and Y.J. Kang. 1991. Fish assemblage collected by gill net in the coastal shallow water off Shinsudo, Samchonpo. Bull. Kor. Fish. Soc., 24 : 99~110.
Kim, D.M. 2003. Ecological modeling for estimation of envi- ronmental characteristics in Masan Bay. J. of the Envi- ron. Sci., 12 : 841~846.
Kim, I.S. and Y.J. Kang. 1993. Coloured Fishes of Korea.
Academy Publishing Co, Seoul, 478pp.
Kim, I.S., Y. Choi, C.L. Lee, Y.J. Lee, B.J. Kim and J.H.
Lim. 2005. Illustrated book of Korean fish. Kyo-Hak Publishing, Seoul, pp. 1~615.
Kwak, S.N. and D.W. Klumpp. 2004. Temporal variation in species composition and abundance of fish and decapods in Cockle Bay, North Queensland, Australia. Aquat.
Bot., 78 : 119~134.
Lazzari, M.A., S. Sherman, C.S. Brown, J. King, B.J. Joule, S.B. Chenoweth and R.W. Langton. 1999. Seasonal and annual variations in abundance and species composi- tion of two nearshore fish communities in Maine. Estu- aries, 22 : 636~647.
Lee, D.I. and C.G. Park. 2003. The Ecological modeling for estimation of total allowable pollutant loading capacity in Masan Bay. J. of Kor. Soc. on Wat. Qual. 19 : 575~
583.
Lee, T.W. 1989. Seasonal fluctuations in abundances and species composition of demersal fishes in Cheonsu Bay of the Yellow Sea, Korea. Bull. Kor. Fish. Soc., 22 :
1~8.
Lee, T.W. 1998. Change in species composition of fish in Chonsu Bay 3. Pelagic fish. J. Kor. Fish. Soc., 31 : 654~664.
Lee, T.W. and J.W. Gil. 1998. Seasonal variation in species composition of demersal fish off Youngkwang in 1986~
87. Kor. J. Ichthyol., 10 : 241~249.
Lee, T.W. and K.J. Seok. 1984. Seasonal fluctuations in abundance and species composition of fishes in Cheon- su Bay using trap net catches. J. Oceanol. Soc. Korea.
19 : 217~227.
Masuda, H., K. Amaoka, C. Arago, T. Ueno and T. Yoshino.
1984. The Fishes of the Japanese Archipelago. Tokai Univ. Press, Tokyo, Text and Plates. 437pp++370 plates.
Oh, H.T., J.H. Goo, S.E. Park, Y.S. Choi, R.H. Jung, W.J.
Choi, W.C. Lee and J.S. Park. 2005. Analysis of water quality caused by improvement of sewage treatment plant in Masan Bay. J. of the Environ. Sci., 14 : 777~
783.
Oh, S.H. 2003. Species composition and community struc- ture of fishes in Kwangyang Bay, Korea. Ph.D. Thesis.
Yeosu National University. 220pp.
Paperno, R, K.J. Mille and E. Kadison. 2001. Patterns in species composition of fish and selected invertebrate assemblages in estuarine subregions near Ponce de Leon Inlet, Florida. Estuar. Coast. Shelf Sci., 52 : 117~
130.
Pianka, E.R. 1973. The structure of lizard communities.
Ann. Rev. Ecol. Syst., 4 : 53~74.
Shannon, C.E. and W. Weaver. 1949. The Mathematical Theory of Communication. Illinois Univ. Press, Urbana, 117pp.
Yoon, C.H. 2002. Fishes of Korea with Pictorial Key and Systematic List. Academy Publ. Co. Seoul, 747pp.
Youm, M.G. 1997. Community patterns of demersal fishes by the baited traps and bottom gillnets in the Masan Bay, heavily polluted area. Bull. Kor. Soc. Fish. Tech.
33 : 298~310.
Received : April 30, 2007 Accepted : May 18, 2007
마산만 해역에서 서식하는 어류군집의 종조성 및 출현량 변동 곽 석 남*∙허 성 회1
(주)해양생태기술연구소 및1부경대학교 해양학과
마산만 해역에서 유자망을 이용하여 어류군집의 종조성 및 출현량 변동을 조사하였다. 조사기 간 동안 총 27종이 출현하였으며, 우점종은 전어(Konosirus punctatus), 숭어(Mugil cephalus), 멸 치(Engraulis japonicus), 샛돔(Psenopsis anomala), 농어(Lateolabrax japonicus), 주둥치 (Leiognathus nuchalis), 등줄숭어(Chelon affinis), 전갱이(Trachurus japonicus)였는데, 이들 어종 은 전체 개체수의87.6%와 총 생체량의95.4%를 차지하였다. 어류군집의 종조성 및 출현량 변동 이 뚜렷하였는데, 출현 개체수는 2005년 3월과 7월, 생체량은2005년 9월과 11월에 높게 나타났 다. 한편 출현개체수 및 생체량은 모두 2005년 11월에 가장 낮게 나타났다. 수온이 어류군집의 종조성 및 출현량 변동에 가장 큰 영향을 주는 요인이었다. 유자망은 어획대상 어종이나 어획 체 장에 강한 선택성을 가지고 있었지만, 상업성어종의 채집에 효율적이었다.
Appendix 1.Number of individuals and biomass of fish species in Masan Bay from 2004 to 2006 SpeciesSep.-04Nov.-04Jan.-05May-05Jul.-05Sep.-05Nov.-05Jan.-06 NWNWNWNWNWNWNWNW Konosirus punctatus817,889.4 635,298.3 22539.0 32969.6 1408,582.0 969,590.4 945,940.8 14578.2 Mugil cephalus2410,727.7 102,842.5 527,691.2 738,509.2 7911,330.0 4830,441.0 7333,340.7 8431,814.5 Engraulis japonicus28184.8 92481.4 25140.5 37123.4 1670.0 79490.8 39184.0 40211.1 Psenopsis anomala1178,404.3 14676.1 11109.7 7290.8 9518.6 16484.2 Lateolabrax japonicus121,411.4 193,136.8 312,348.4 431,436.2 8829.2 6511.1 13116.9 13788.5 Leiognathus nuchalis9110.9 27293.1 38258.4 42268.8 15130.3 11112.8 212.8 Chelon affinis3581.8 41,421.5 424,577.5 495,357.0 212,370.3 2281.7 41,410.4 2671.4 Trachurus japonicus181,368.7 12695.1 118.2 735,601.3 11282.9 9175.5 120.1 Sardinella zunasi354.9 234.2 36523.8 7226.3 7132.7 8134.2 Ditremma temmincki139.2 139.7 379.5 9128.0 241,212.6 135.9 280.5 Repomucenus valenciennei145.7 142.1 577.0 989.1 370.8 140.8 395.3 6183.4 Hexagrammos otakii2122.5 3324.2 8904.6 6486.2 162.3 3201.5 3198.2 2128.2 Acanthogobius flavimanus484.4 12190.4 9270.4 Limanda yokohamae119.7 125.8 7418.0 8427.7 248.9 130.7 Sebastes inermis239.4 15230.6 248.1 Acanthopagrus schlegeli91,135.1 5568.5 Thryssa kammalensis368.4 246.8 369.3 4111.4 Kareius bicoloratus117.8 127.5 5162.0 263.2 133.9 Hypodytes rubrippinnis7131.4 119.7 Sebastes longispinis117.9 372.9 252.6 Repomucenus lunatus122.3 122.7 117.7 256.8 Platycephalus indicus1116.5 2197.7 Argyrosomus argentatus2154.4 Trichiurus lepturus122.6 Clupea pallassi119.5 Sebastes schlegeli131.2 Sillago jaonicus125.4 Oplegnathus fasciatus153.1 Total318 32,493.7 238 14,709.0 266 18,146.9 395 19,171.9 405 31,059.6 283 43,477.2 252 41,797.9 189 35,162.8 N : Number of individuals, W : biomass(g)