Supervised classification for greenhouse detection by using sharpened SWIR bands of Sentinel-2A satellite imagery
Lim, Heechang1)·Park, Honglyun2)
Abstract
Sentinel-2A satellite imagery provides VNIR (Visible Near InfraRed) and SWIR (ShortWave InfraRed) wavelength bands, and it is known to be effective for land cover classification, cloud detection, and environmental monitoring. Greenhouse is one of the middle classification classes for land cover map provided by the Ministry of Environment of the Republic of Korea. Since greenhouse is a class that has a lot of changes due to natural disasters such as storm and flood damage, there is a limit to updating the greenhouse at a rapid cycle in the land cover map. In the present study, we utilized Sentinel-2A satellite images that provide both VNIR and SWIR bands for the detection of greenhouse. To utilize Sentinel-2A satellite images for the detection of greenhouse, we produced high-resolution SWIR bands applying to the fusion technique performed in two stages and carried out the detection of greenhouse using SVM (Support Vector Machine) supervised classification technique. In order to analyze the applicability of SWIR bands to greenhouse detection, comparative evaluation was performed using the detection results applying only VNIR bands. As a results of quantitative and qualitative evaluation, the result of detection by additionally applying SWIR bands was found to be superior to the result of applying only VNIR bands.
Keywords : Image Fusion, Sentinel-2A, SWIR (ShortWave InfraRed), Supervised Classification, SVM (Support Vector Machine)
1. Introduction
Recently, with the development of sensor technology, it is possible to acquire satellite images in a wide spectral wavelength bands, and the utility of satellite images has increased. In particular, the images from the satellites such as Worldview-3 and Sentinel-2A provide SWIR (ShortWave InfraRed) bands, which are known to be effective for land cover classification, cloud detection, mineral detection, and environment monitoring (Lefebvre et al., 2016).
Though Sentinel-2A satellite images provide wide spectral wavelength bands, these images have limitations in that the spatial resolutions should be matched to effectively utilize all
the bands as 14 VNIR (Visible Near InfraRed) and SWIR bands with 3 different types of spatial resolution, 10-, 20- and 60-m, are provided. Greenhouse is one of the middle classification classes of the land cover map provided by the Korean Ministry of Environment and is widely utilized all over the country for cultivation of crops in Korea which has distinct four seasons. However, as there are many location changes every year due to the natural disaster such as storm and flood damage, it is difficult to renew the land cover map reflecting the changes at a rapid interval. Also, as imprudent use of plastic may pollute soil, studies related to greenhouse cultivation plot mapping are conducted to grasp the locations and numbers of greenhouse (Koc-San. 2013).
Received 2020. 09. 22, Revised 2020. 10. 13, Accepted 2020. 10. 19
1) School of Civil Engineering, Ph.D. student, Chungbuk National University (E-mail: [email protected])
2) Corresponding Author, Member, School of Drone & Transportation Engineering, Professor, Youngsan University (E-mail: [email protected])
https://doi.org/10.7848/ksgpc.2020.38.5.435 Original article
This is an Open Access article distributed under the terms of the Creative Commons Attribution Non-Commercial License (http://
creativecommons.org/licenses/by-nc/3.0) which permits unrestricted non-commercial use, distribution, and reproduction in any
Carvajal et al. (2006) carried out detection of greenhouse applying an artificial neural network to QuickBird satellite images, and Aguera et al. (2008) carried out pixel-based supervised classification utilizing the satellite images of IKONOS. Recently, as the studies that performed object- based classification for high-resolution images showed superior classification accuracy, techniques that was applied an object-based classification technique were proposed also for detection of greenhouse, and Aguilar et al. (2015) carried out greenhouse cultivation plot mapping applying the object- based decision tree classification technique to Worldview-2 satellite images. Nemmaoui et al. (2018) carried out detection of greenhouse using VNIR and SWIR bands of Sentinel- 2A satellite images together. However, as the bands having 20- and 60-m spatial resolution and the bands having 10-m spatial resolution were utilized after being resampled using the same pixel number, 14 bands were not utilized effectively.
Accordingly, in the present study, the bands with the 20- and 60-m spatial resolution were sharpened to have 10-m spatial resolution applying the fusion technique applicable to Sentinel-2A that was proposed by Park et al. (2017). And we conducted detection of greenhouse utilizing the VNIR and SWIR bands of Sentinel-2A satellite images having 10-m spatial resolution. For detection of greenhouse, we carried out classification applying SVM (Support Vector Machine) which is one of the machine learning techniques, and urban area, vegetation, paddy field, bare soil, fresh water, and sea water were selected as the classes for classification in addition to greenhouse. Training data and ground truth data were acquired from the images and, to analyze the effect of SWIR bands on the detection of greenhouse, the result was comparatively evaluated with the case where only the VNIR bands were utilized.
2. Methodology
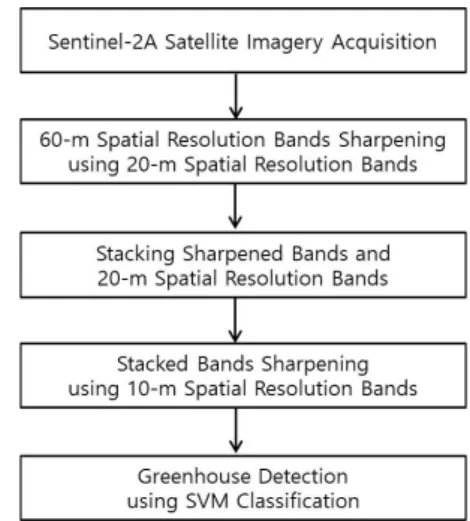
In the present study, VNIR and SWIR bands of Sentinel- 2A satellite imagery were used in the SVM classification to detect greenhouse. For this, the bands with 20- and 60-m spatial resolution were sharpened utilizing the bands with 10-m spatial resolution. As a sharpening method, a two stage sharpening method proposed by Park et al. (2017) was applied
using the selected band scheme and GS2 (Gram-schmidt2) technique. The flowchart of the study is as shown in Fig. 1.
Fig. 1. Flowchart of the study
2.1 GS2 sharpening
Sharpening technique is the technique of producing multi-spectral image of high spatial resolution by injecting high frequency information extracted from panchromatic image into low-resolution multi-spectral image in general (Rahmani et al., 2010). The general sharpening technique is defined as shown in Eq. (1).
(1)
is the fused high-resolution multi-spectral image,
is the multi-spectral image interpolated using the scale of the image, is the injection gain, is the panchromatic image, is the low-resolution synthetic intensity image, and
means the number of multi-spectral bands. Sharpening technique is divided into CS (Component Substitution) and MRA (MultiResolution Analysis) depending on the method of producing (Kim and Choi, 2015). The GS2 technique used in the this study is one of the MRA based fusion techniques, which applies the images produced by decomposing the panchromatic images using the scale of the low-resolution multi-spectral image to and calculates
using the relation of the covariance between and low- resolution multi-spectral images and the variance of
(Garzelli, 2015).
2.2 Selected band scheme
Sentinel-2A satellite images do not provide panchromatic images differently from general high-resolution satellite images. Four VNIR bands among the Sentinel-2A satellite bands are of 10-m which is the highest spatial resolution and these 4 bands should be utilized to fuse Sentinel-2A satellite images into 10-m. Selected band scheme is a method of selecting the bands which show the highest correlation by carrying out a correlation analysis between a number of bands having high spatial resolution and a low-resolution multi-spectral image of which the spatial resolution is to be improved (Selva et al., 2015). Among the results of conducting a correlation analysis, the high-resolution image which shows the highest correlation with the low-resolution multi-spectral image is utilized as of Eq. (1). Correlation analysis is as shown in Eq. (2).
(2)
is the high-resolution image converted using the scale of the low-resolution image, is the low-resolution image, is the covariance of the two images, and and mean the standard deviations of the two images respectively. The correlation analysis result has a value between -1 and 1, and the band which shows the highest correlation is selected.
The process of selecting the high-resolution image through a correlation analysis is shown in Eqs. (3) and (4).
arg
(3)
(4)
in Eq. (3) means the th high-resolution image converted to have the number of pixels of low-resolution image, is the th low-resolution image, and of Eq. (4) means the th high-resolution band which shows the highest correlation with the th low-resolution band.
2.3 Support vector machine
In the this study, supervised classification was carried out applying SVM which is one of the representative machine
learning techniques to the sharpened Sentinel-2A satellite images. SVM technique is a classification technique based on a statistical theory and performs classification using the statistic values of training to set a margin between two classes and using the kernel function to calculate to which boundary the data points belong (Mountrakis et al. 2011).
SVM is an algorithm that classifies two sets by finding an arbitary nonlinear boundary in a vector space, and one hyperplane is completed by successively connecting the space that become the boundary of the two sets. There are many hyperplanes that ideally divide two sets, but only one hyperplane with the largest boundary width dividing the two sets is mathematically determined to fine the optimal hyperplane.
When SVM is applied to nonlinear data such as satellite imagery, it is difficult to create an appropriate hyperplanes.
In order to perform nonlinear classification, the input space is mapped into a high dimensional feature space to find the separation surface, and the inner product of the input space is calculated using a kernel function. In addition, a kernel function is applied to map the input space into a high dimensional feature space, and the shape of the hyperplane changes according to the kernel function (Choi et al., 2006).
3. Results and Analysis
3.1 Study area and materials
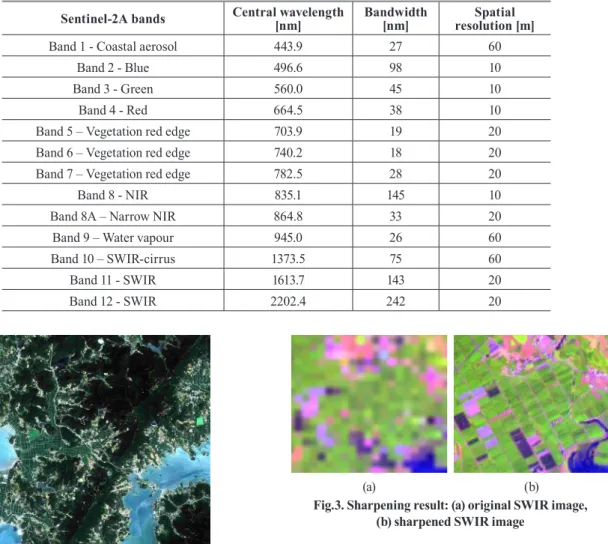
In the this study, for detection of greenhouse, we acquired Sentinel-2A satellite images of the area of Haenam-gun, Jeollanam-do, taken on Aug. 6, 2016. Sentinel-2A satellite images provide four 10-m spatial resolution bands, six 20-m spatial resolution bands, and three 60-m spatial resolution bands. Table 1 is information on each band of Sentinel-2A satellite imagery, and bands 1 to 9 are the VNIR spectral wavelength bands, and 10 to 12 are SWIR spectral wavelength bands. The acquired Sentinel-2A imagery was a Level-1C data, SNAP (Sentinel Application Platform) for Sentinel-2A was used to carry out radiometric and geometric correction on the acquired imagery. For the size of the image used in the study, the areas corresponding to 1800 × 1800 pixels were selected based on the band with 10-m spatial resolution. Fig.
2 shows the Sentinel-2A satellite images of the study area.
Fig. 2. Study area
3.2 Experimental result
Greenhouse detection was performed using the VNIR and SWIR bands of Sentinel-2A satellite imagery sharpened into 10-m spatial resolution. For this, the sharpening carried out in two stages which was proposed by Park et al. (2017) was utilized. At the first stage of the sharpening, 9 bands were produced by sharpening the bands with 60-m spatial resolution into 20-m spatial resolution utilizing the selected band scheme and GS2. And, at the second stage, 13 bands with 10-m spatial resolution were finally produced by sharpening the 9 bands with the 20-m spatial resolution using the same method as the first stage. The Sentinel-2A satellite images sharpened into 10-m are as shown in Fig. 3.
Sentinel-2A bands Central wavelength
[nm] Bandwidth
[nm] Spatial
resolution [m]
Band 1 - Coastal aerosol 443.9 27 60
Band 2 - Blue 496.6 98 10
Band 3 - Green 560.0 45 10
Band 4 - Red 664.5 38 10
Band 5 – Vegetation red edge 703.9 19 20
Band 6 – Vegetation red edge 740.2 18 20
Band 7 – Vegetation red edge 782.5 28 20
Band 8 - NIR 835.1 145 10
Band 8A – Narrow NIR 864.8 33 20
Band 9 – Water vapour 945.0 26 60
Band 10 – SWIR-cirrus 1373.5 75 60
Band 11 - SWIR 1613.7 143 20
Band 12 - SWIR 2202.4 242 20
Table 1. Information of Sentinel-2A bands
(a) (b)
Fig.3. Sharpening result: (a) original SWIR image, (b) sharpened SWIR image
Supervised classification was carried out applying SVM to the sharpened Sentinel-2A satellite images. As to the classification classes, total 7 classes which were greenhouse, urban area, vegetation, paddy field, bare soil, fresh water, and sea water were selected, and training data were acquired for each class. Also, ground truth data for accuracy evaluation were acquired by selecting the pixels that did not overlap with those of the training data. The classes and number of pixels of the selected training data and ground truth data are as shown in Table 2.
Table 2. Number of pixel of the selected training data and ground truth data
Class Pixel number of training data
Pixel number of ground truth
Greenhouse 376 data458
Urban area 401 455
Vegetation 425 476
Paddy field 416 403
Bare soil 435 425
Fresh water 415 402
Sea water 413 442
In this study, the applicability of the sharpened bands of Sentinel-2A for greenhouse detection was analyzed.
Accordingly, to analyze the effect of additional utilization of sharpened SWIR bands on greenhouse detection, we carried out detection of greenhouse utilizing only the 4 bands of Sentinel-2A with 10-m spatial resolution. In addition, quantitative and qualitative evaluations were performed to analyze the accuracy of the classification results. Fig. 4 and 5 shows the result of classifying the data utilizing only the 4 bands with 10-m spatial resolution and the result of classifying the data utilizing the 13 sharpened bands. And Table 3 shows the result of quantitatively carrying out accuracy evaluation using a confusion matrix.
(a) (b)
Fig. 4. Classification results: (a) result using 4 bands, (b) result using sharpened 13 bands
(a)
(d)
(g)
(b)
(e)
(h)
(c)
(f)
(i)
Fig. 5. Zoomed image of classification results:(a) RGB image, (b) result using 4 bands, (c) result using sharpened 13 bands, (d) RGB image, (e) result using 4 bands, (f) result
using sharpened 13 bands, (g) RGB image, (h) result using 4 bands, (i) result using sharpened 13 bands Table 3. Result of quantitative evaluation (unit:%)
Class 4 Bands 13 Bands
User’s
accuracyProducer’s accuracy User’s
accuracyProducer’s accuracy
Greenhouse 63.37 69.76 96.63 90.52
Urban area 73.14 64.67 88.43 93.53
Vegetation 96.26 99.55 97.14 100.00 Paddy field 98.74 95.53 99.79 97.54
Bare soil 96.00 96.70 97.25 96.05
Fresh water 98.82 99.21 99.76 99.76
Sea water 94.78 99.74 98.51 100.00
Overall
accuracy 88.78 96.73
Kappa
coefficient 86.90 96.19
As a result of carrying out qualitative evaluation of the classification result through visual inspection, it was verified that the salt and pepper noise reduced when 13 fused bands were used in comparison to that when only the 4 bands were used. In particular, it was confirmed that the classification accuracy of urban areas and greenhouse that are artificial structures was improved than that of other natural classes.
The result of quantitative evaluation had a trend similar to that of the qualitative evaluation. As a result of the quantitative evaluation, the classification accuracy when only the 4 bands were utilized was 88.78 % and that when the 13 fused bands were utilized was calculated to be 96.73
%. It could be confirmed that the classification accuracy of greenhouse and urban areas was greatly improved as the case of the qualitative evaluation.
4. Conclusion
In this study, greenhouse detection was performed using sharpened Sentinel-2A imagery. To this end, 13 bands sharpened with 10-m spatial resolution were produced using the selected band scheme and GS2 method on Sentinel-2A, and supervised classification was performed by applying the SVM. Classes were selected as greenhouse, urban area, vegetation, bare soil, paddy field, fresh water, and sea water.
In order to analyze the utilization of the sharpened Sentinel- 2A imagery to detect greenhouse, the result of classification on the sharpened Sentinel-2A imagery was compared with the result of classification using only original VNIR bands with 10-m spatial resolution. As a result of the experiment, it was found that the classification accuracy was improved qualitatively and quantitatively when using 13 sharpened bands. In particular, it was confirmed that the classification accuracy of classes in greenhouse and urban areas was greatly improved. Through this, it was proved that it is effective to perform greenhouse detection by additionally utilizing SWIR bands.
Acknowledgment
This work was supported by Youngsan University Research Fund of 2020.
References
Aguera, F., Aguilar, F.J., and Aguilar M.A. (2008), Using texture analysis to improve per-pixel classification of very high resolution images for mapping plastic greenhouse, ISPRS Journal of Photogrammetry and Remote Sensing,
Vol. 63, No. 6, pp. 635-646.
Aguilar, M.A., Vallario, A., Aguilar, F.J., Lorca A.G., and Parente C. (2015), Object-based greenhouse horticultural crop identification from multi-temporal satellite imagery:
a case study in Almeria, Spain, Remote Sensing, Vol. 7, No. 6, pp. 7378-7401.
Carvajal, F., Crisanto, E., Aguilar, F.J., Aguera, F., and Aguilar, M.A. (2006), Greenhouse detection using artificial neural network with a very high resolution satellite image, ISPRS Technical Commission Ⅱ Symposium, 12-14 July, Vienna, Austria, pp. 37-42.
Choi, J., Byun, Y., Kim, Y., and Yu, K. (2006), Support vector machine classification of hyperspectral image using spectral similarity kernel, Journal of Korean Society for Geospatial Information System, Vol. 14, No. 4, pp. 71-77.
(in Korean with English abstract)
Garzelli, A. (2015), Pansharpening of multispectral images based on nonlocal parameter optimization, IEEE Transactions on Geoscience and Remote Sensing, Vol. 53, No. 4, pp. 2096-2107.
Kim, Y. and Choi, J. (2015), Evaluation of block-based sharpening algorithms for fusion of Hyperion and ALI imagery, Journal of the Korean Society of Surveying, Geodesy, Photogrammetry and Cartography, Vol. 33, No.
1, pp. 63-70. (in Korean with English abstract)
Koc-San, D. (2013), Evaluation of different classification techniques for the detection of glass and plastic greenhouses from Worldview-2 satellite imagery, Journal of Applied Remote Science, Vol. 7, No. 1, pp. 073553-1- 073553-20.
Lefebvre, A., Sannier, C., Corpetti, T. (2016), Monitoring urban areas with Sentinel-2A data: application to the update of the Copernicus high resolution layer imperviousness degree, Remote Sensing, Vol. 8, No. 7, pp. 606-626.
Mountrakis, G., Im J., and Ogole, C. (2011), Support vector machines in remote sensing: a review, ISPRS Journal of Photogrammetry and Remote Sensing, Vol. 66, No. 3, pp.
247-259.
Nemmaoui, A., Aguilar, M.A., Aguilar, F.J., Novelli, A., and Lorca, A.G. (2018), Greenhouse crop identification from multi-temporal multi-sensor satellite imagery using object-based approach: a case study from Almeria (Spain),
Remote Sensing, Vol. 10, No. 11, pp. 1751-1775.
Park, H., Choi, J., Park, N., and Choi, S. (2017), Sharpening the VNIR and SWIR bands of Sentinel-2A imagery through modified selected and synthesized band schemes, Remote Sensing, Vol. 9, No. 10, pp. 1080-1099.
Rahmani, S., Strait, M., Merkurjev, D., Moeller, M., and, Wittman, T. (2010), An adaptive IHS pan-sharpening method. IEEE Geoscience and Remote Sensing Letters, Vol. 7, No. 4, pp. 746-750.
Selva, M., Aiazzi, B., Butera, F., Chiarantini, L., and Baronti, S. (2015), Hyper-sharpening: a first appoach on SIM-GA data, IEEE Journal of Selected Topics in Applied Earth Observation and Remote Sensing, Vol. 8, No. 6, pp. 3008- 3024.