Manuscript received August 24, 2015, revised September 11, 2015, accepted December 21, 2015
Study on Application of Reinforcement Device to Provide Greater Dynamic Stability for Power Transmission Towers and its Effect
Kyeong-hyeon Yang†, Choon-hee Bae, Nam-geun Jeong, Doo-young Kim, Sung-min Kim, Yong-hee Jang KEPCO Research Institute, Korea Electric Power Corporation, 105 Munji-Ro, Yusung-Gu, Daejeon, 34056, Korea
† [email protected]
Abstract
To verify that the friction damper used to high buildings as a kind of control technology of wind vibration can reduce dynamic behaviors of PTTs effectively, slip dampers in this paper are proposed to absorb the energy through relatively frictional movement of slip dampers applied to main post of a PTT (Power Transmission Tower) when dynamic displacement of a PTT occurs. The result of dynamic analysis is presented to determine the capacity of the damper system by controlling damping ratio on the resonance condition.
It is observed that by installing slip dampers at a PTT the strain amplitudes of the main post caused by wind load are effectively reduced.
Therefore it is shown that the proposed damper satisfies the strengthened wind-load design standards, and its efficacy was also validated experimentally by field testing.
Keywords: Power transmission tower, wind load, slip damper, dynamic analysis, vibration
I. INTRODUCTION
Because of its high slenderness ratio and low damping ratio, a power transmission tower (PTT) is vulnerable to the compressive load supplied by an external kinetic energy source such as the wind. In Korea (Rep.), regionally differentiated wind load standards established in June 1987 on the basis of a “study of design wind speeds for power transmission towers” carried out in 1986 have been applied to the design and construction of steel PTTs [1]. However, PTTs built in coastal or mountainous areas are exposed to the risk of collapse from the topographic wind speed-up effects and unstable air currents caused by typhoons and storms hitting coastal areas and inland with increased intensity and frequency as a result of the global warming-induced climate change [2]. The PTTs collapsed by Typhoon Maemi, which hit Korea in 2003, and the subsequent power service interruption caused severe inconveniences and economic losses to the local residents and industries. In response to this disaster and looming collapse risks, the PTT design standards were strengthened in 2010 to enhance their stability under excessive wind loads by raising the standard instantaneous wind speeds [3]. Although the steel PTTs built under the new design standards are reported to be safe against extreme wind loads, the pre-2010 PTTs are still exposed to collapse risks, and their retrofitting is urgently needed.
PTTs built before 2010 can be reinforced using one of three retrofitting methods. First, static behavior-based retrofitting aims at base reinforcement and cross-section enlargement using methods involving replacement, transverse reinforcement, beam retrofitting, column retrofitting, external-post tensioning, and high-strength bolt fastening of the reinforced plate, or a reduction of longitudinal buckling by reinforcing members [4]. Most examples of this retrofitting method are cost-intensive, time- consuming, and difficult to implement. The second retrofitting method aims to enhance the strength of the existing structure itself by applying a coating or joining with a dissimilar material.
This type of retrofitting is also cost-intensive because it involves
state-of-the-art coating technologies, costly dissimilar materials, or high-level joining technologies. The third type of PTT retrofitting uses the mechanism of energy dissipation by viscoelasticity or a friction force. This method is known to be cost-effective and time-saving because it utilizes simple devices and is easy to install in the field. Studies have shown that the application of a mechanism for increasing the damping in a large building was highly efficacious [5].
The studies conducted thus far to ensure PTT stability under a wind load include the following. Xu, Qu, and other researchers numerically proved the anti-seismic performance of friction dampers applied to truss-type TV towers to reduce wind-induced vibrations and demonstrated the advantage of semi-active friction dampers in adapting to loads over passive dampers [6][7]. Kilroe proposed a method that was more cost-effective than conventional reinforcement methods to consolidate the anti-seismic performance of steel towers by installing anti-seismic devices on corresponding members to reduce the fatigue effects by enabling the wind- induced vibration control of a PTT’s cross-arm members [8].
Battista et al. analyzed the dynamic characteristics of PTT structures, including overhead lines, and proposed an anti- vibration analytical model by installing earthquake-resistant dampers to reduce the magnitude of the dynamic responses to wind loads [9]. Albermani et al. presented a diaphragm-type reinforcement method that constrains the out-of-plane behavior by replacing the bracing system to retrofit existing steel towers, and experimentally validated its efficacy [10]. Moon et al.
performed cyclic loading experiments on a half-scale model with a friction-type reinforcing device to analyze the hysteretic behavior of a partial PTT model [11].
In this study, we examined a method that is more cost
effective and easier to install than conventional methods for
reinforcing the main posts and base structure in order to reduce
the vulnerability to vibrations ascribable to the low damping ratio
arising from the use of steel members with a high slenderness
ratio in the existing unreinforced steel towers. Then, we predicted
its efficacy using an analytical model, and performed PTT prototype testing to validate its dynamic stability under excessive wind loads.
II. SURVEY OF POWER TRANSMISSION TOWER (PTT) DAMAGE CASES
There are three types of structural damages that can occur to PTTs: i) the collapse or partial damage directly caused by high- speed winds such as a wind gust, ii) falling or collapse due to an unbalanced shear force, and iii) overturning failure due to changes in the soil pressure distribution. This study focused on the wind-induced damages. Specifically, actual cases of PTT damage caused by excessive wind loads were investigated to identify the primary causes of accidents and thus present the practical data needed for establishing future response policies.
Typhoon Maemi, which was the strongest of the typhoons that hit Korea in 2003, destroyed nine PTTs and partially damaged three others (involving a partial breakdown of the tower body or deformation and breakdown of the tower cross-arms) [2].
All of these PTTs toppled or damaged by Typhoon Maemi were old PTTs constructed under the design standards of 1987. Most of them were located in mountainous areas, which allows the assumption that they collapsed as a result of the excessive wind loads exerted by wind gusts generated by high-speed slopes and valley winds or topographic changes in the air currents.
A large number of high-pressure PTTs are installed in mountainous areas, and thus have higher risks of being exposed to wind gusts due to wind speed-up effects compared to those in lowland areas. Additionally, the old design standards for PTTs, which used steel members with high slenderness ratios, considered only static wind loads, without sufficiently reflecting their dynamic behavior, resulting in intrinsically low damping ratios. This makes them vulnerable to wind-induced deformation and failure. Thus, it can be inferred that the PTTs damaged by Typhoon Maemi would have resisted the wind gusts if they had been constructed under the new design standards, applying the design specifications to resist the increased wind loads and dynamic loads exerted by wind gusts.
Therefore, pre-2010 PTTs should be retrofitted, and reinforcements will have to take into account dynamically exerted wind loads to reduce the dynamic response behavior instead of merely considering the static behavior, such as by reducing the
buckling length by enlarging the cross-sections of members.
III. DYNAMIC ANALYSIS OF PTTS
This study had the goal of solving the problems of the collapse or damage risks of unreinforced PTTs due to their insufficient dynamic stability against typhoon-level excessive wind loads, by enhancing their damping performance to ensure appropriate dynamic responses. To achieve this end, we established an accurate dynamic analysis model for analyzing the test PTT. We then analyzed the dynamic characteristics of the test steel tower using this analysis model and performed testing to validate its efficacy in deriving measures for ensuring the structural stability of PTTs.
A. Establishment of PTT dynamic analysis model 1) Overview of test steel tower
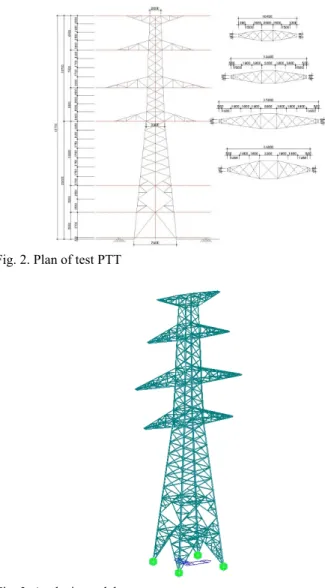
As the test PTT, we used a 345k-grade B-type PTT. Fig. 2 illustrates its plan. The total height is 41.7 m, and the height from the ground to its lowest cross-arms is 22 m. Overhead ground wires are installed parallel to the conductor wires from the top cross-arms at a height of 41.7 m, and the power transmission lines run bilaterally from the three lower cross-arms at heights of 22 m, Fig. 1. Collapse of a 154 kV transmission tower in the Geoje Island Fig. 2. Plan of test PTT
Fig. 3. Analysis model
28.3 m, and 35.3 m from the ground. Insulators are embedded in each of the four pairs of rectangular cross-arms. As shown in Fig.
2, a total of 12 insulators were used as insulator devices, consisting of six sets of double-string insulators. All of the members of the test PTT are made of L-shaped steel sections, with SS540 used for the main posts, and SS400 used for all the other members (web and diagonal members).
2) Analysis model creation
Fig. 3 presents the 3D finite element analysis (FEA) model configured using the structural analysis program MIDAS Gen in order to identify the PTT’s dynamic characteristics and dynamic responses to wind loads. The FEA model has a total of 302 nodes, and the lattice system of all the members was configured with beam and truss elements substituting for 968 frame elements with real-world member cross-sections. The bolt joint connections of the main posts and web members were assumed to be rigid, and a fixed point was used as the support footing under the assumption that the tower support (concrete structure) responds in sync with the subgrade.
3) Mode analysis
When analyzing the eigenvalues to determine the PTT dynamic characteristics, it was important to consider the mass and tension of the overhead power lines and the mass of the insulators.
Based on the results reported in the relevant literature, the mass of a power line or insulator was defined to be the mass concentrated on the cross-arm node holding the transmission line.
The tensions of the transmission lines were not taken into account because they are bilaterally balanced under normal conditions.
The total mass of the test PTT thus modeled amounted to 20.8 tons. Given that a PTT is a truss-type structure with a very high slenderness ratio, the damping matrix for each mode was configured to have a damping ratio of 1%, which was lower than that commonly used for steel structures (2%). Additionally, using the commercial computer program Matlab, we extracted responses that satisfied the state equations for a nonlinear hysteretic structure, including the mass, hardness, and viscosity matrices derived from the results of eigenvalue and static analyses performed using commercial programs.
Table 1 presents the natural periods and mass participations of the test PTT obtained from the mode analysis. Unlike general structures, the dynamic responses do not depend on a very limited
number of lower modes, but a relatively large number of modes contribute to a PTT’s dynamic behavior. As listed in the table, the 1st and 13th modes influence the behavior in the direction perpendicular to the transmission line, whereas the 2nd and 15th modes influence the behavior in the direction of the transmission line, and the 6th and 7th modes influence the rotational behavior of the steel tower. As shown in the 3rd and 4th mode shapes, the remaining low modes show local mode shapes. Fig. 4 depicts the 1st, 2nd, 13th, and 15th modes of the test PTT.
B. Results of conceptual damper application in relation to wind responses
As load data, the input values for the analysis model were calculated using 36 m/s as the estimated wind speed for the 50- year return period in the Busan area, as specified in the power transmission tower design standards in accordance with the results of a wind tunnel experiment, and the final time-history wind load was calculated in consideration of the topographic wind speed-up factor. As the mean component, the load concentrated on any given node was used, along with the fluctuation, to analyze the time history with the time-history loads.
In order to increase the magnitude of the energy dissipation, the yield load should be decreased, with an increase in the stiffness and decrease in the resisting force. Given the inverse relationships between the stiffness or the resisting force and magnitude of the energy dissipation, it is crucial to determine the optimal yield load for the reinforcement device design. The yield strength of the damper can be configured by tracking the response changes, which are dependent on the yield strength of the damper, using Eq. (1), after inducing resonance in the steel structure. In order to induce resonance in the test PTT, we applied a harmonic load with a 2.3464 Hz component identical to the natural frequency of the steel tower in the x-axis direction of the tower.
The analysis was performed by varying the yield strength of the damper in the order of 1%, 3%, 5%, 10%, and 20% of 700 kN, which is the maximum compressive load exerted on the main posts of existing PTTs.
+ + = +
(1) where M = mass of the structure
C = damping of the structure K = stiffness of the structure f
w= wind load
f
d= capacity of the damper Table 1. Natural periods of test steel PTT and mass participations
Mode
Natural frequency
(Hz)
Natural period
(sec)
Mass participation
by mode (%) Cumulative mass participation (%) x
axis y axis
z axis
x axis
y axis
z axis
1 2.3464 0.4262 56.36 - - 56.36 - -
2 2.3753 0.4210 - 58.67 - 56.36 58.67 - 3 2.5989 0.3848 0.02 0.02 0.21 56.38 58.69 0.21 4 2.5997 0.3847 0.09 0.09 - 56.46 58.78 0.21 5 2.6004 0.3846 0.02 0.02 0.01 56.49 58.80 0.22 6 2.7539 0.3631 0.03 0.05 14.40 56.51 58.85 14.62 7 2.7596 0.3624 0.01 0.01 66.63 56.52 58.85 81.25
… … … …
13 6.5189 0.1534 25.78 - - 82.57 59.09 81.26 14 6.8963 0.1450 - 0.25 5.14 82.57 59.34 86.40 15 6.9666 0.1435 -
… … … …24.21
…0.06
…82.57 83.55 86.46
… … …(a) (b) (c) (d)
Fig. 4. Mode shapes with natural periods of test steel PTT. (a) 1st
mode, (b) 2nd mode, (c) 13th mode, (d) 15th mode
A hysteretic system, which consists of six independent components showing uniaxial plastic deformation features, is used for modeling the energy dissipation device based on the hysteretic behavior. The component force–deformation response of the hysteretic system is expressed by Eq. (2), as suggested by Park, Wen and Ang (1986) [12].
= + (1 − ) (2)
where k = baseline stiffness F
y= yield strength
γ = post-yield stiffness reduction rate d = deformation between two nodes
z = endogenous variable of hysteretic behavior Variable z is defined using the following differential equation suggested by Wen (1976) [13].
́ = 1 − | | + (3)
Here, α and β are constants determining the shape of a hysteresis curve, s is the constant determining the creep area of a yield point, and d˙ denotes the gradient of deformation between two nodes.
Fig. 5 and Table 2 provide the cumulative time-history hysteresis curve and the maximum compressive force exerted on the main post, respectively, for each damper capacity under the resonance condition of the analysis model. The results verify that the installation of a friction damper and larger capacity of this damper helps to reduce the response to the compressive force.
According to Fig. 5 at the 10% yield strength for the damper, the maximum displacement was reduced to 42% of the response level of existing PTTs, and substantial damping effects were verified.
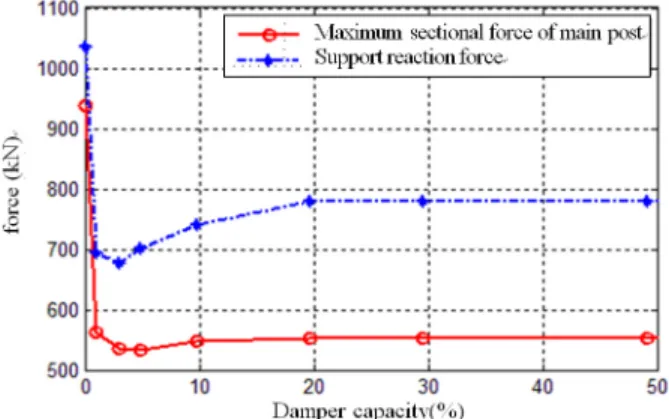
Fig. 6 shows the maximum sectional force of the main post and reaction force of the support for each damper capacity by inputing nodal force data obtained from wind tunnel test. The greatest effect of force reduction is observed when the yield strength of the damper is 3-5% (21-35 kN) of the compressive force exerted on the main post.
Therefore it is observed that using the friction damper or the slip damper is very effective to minimize dynamic behavior for PTTs.
IV. APPLICATION OF FRICTION DAMPER AND EFFICACY VALIDATION
A. Overview of friction damper
In order to ensure the dynamic stability of PTTs under wind
loads, we developed a friction damper based on a mechanism for absorbing the wind load as friction energy, and its dissipation.
Cost- and time-savings as well as easy installation were achieved by locally installing the dampers in adequate places on the PTT without resorting to partial replacement or support retrofitting.
1) Slot-type friction damper
A slot-type friction damper was designed to be attached to each leg of the PTT, as shown in Fig. 7, using members with an identical shape and made from the same material as the main Table 2. Maximum compressive force on main post for each test damper
capacity
Damper capacity Existing PTT Damping ratio
1% Damping ratio 3%
Compressive force on
the main post (kN) 763.10 376.83 349.59
Damper capacity Damping ratio 5%
Damping ratio 10%
Damping ratio 20%
Compressive force on
the main post (kN) 328.48 317.61 327.82
Fig. 5. Time-history curves of compressive force on main post for each test damper capacity
Fig. 6. Maximum sectional force of main post and support reaction depending on damper capacity
Fig. 7. Slot-type friction damper
members. A friction material was added between the double-layer members to allow the relative displacement energy generated by the main post behavior to be absorbed as frictional energy, with the amount controlled by the compressive load received by the bolts of the respective slots.
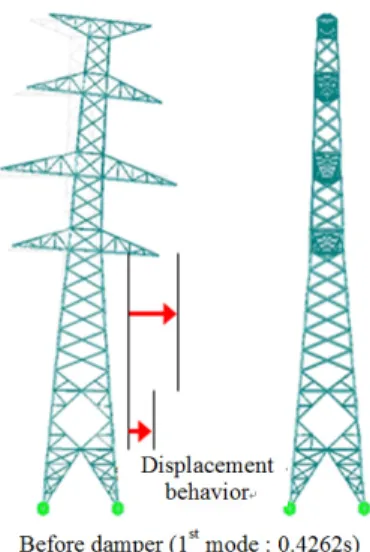
The slot-type friction damper was applied to the previously developed FEA model. As a result, the optimal height for the maximum absorption of displacement relative to the 1st natural vibration mode (Fig. 8) was found to be 12 m from the support footing (Fig. 9). The 5-10% damping capacity of the maximum compressive load on the main post (700 kN) was verified to be the optimal damper capacity, as shown in Fig. 10.
2) Toggle-type friction damper for displacement amplification The analysis results revealed that the hysteresis curves of the slot-type friction damper moved within a 1 mm range. However, considering the errors that occurred while producing and
installing the dampers, the hysteresis loop area shown in Fig. 10 was assumed to be reduced. Therefore, we added the toggle bracing displacement amplification friction damper shown in Fig.
11 to enhance the energy dissipation capacity of the slot-type friction damper.
The toggle-type displacement amplification friction damper is designed to change the displacement in the vertical direction if the displacement increases or decreases in the horizontal direction along the two links, as shown in Fig. 12. Its operation mechanism is the dissipation of energy induced by a vertical friction force. Eq. (4) expresses the amplification ratio in relation to the vertical displacement ratio (
1/ ) yielded by the toggle bracing, and it can vary according to the degree of the included angle (θ ) in relation to the length of two connection devices.
∆
2L + sin θ
2 + ∆
L + cos θ
2 = 1 (4) Fig. 8. 1st natural vibration mode and displacement behavior
Fig. 9. Optimal placement of dampers
Fig. 10. Analytical load distribution by slot displacement behavior
Fig. 11. Toggle-type friction damper
Fig. 12. Schematic representing displacement amplification by toggle bracing
Fig. 13. Optimal placement of dampers
Fig. 14. Analytical load distribution by slot displacement behavior
Dampers were applied to the FEA model, with various installment locations. Optimal outcomes were obtained when the bottom of the damper was placed at a height of 12 m from the support footing, as shown in Fig. 13. As shown in Fig. 14, the optimal damper capacity for the application to the steel tower was found to be 35 kN, or 5% of the maximum compressive load bearing capacity of the main post.
B. Field application
Both slot-type friction dampers and toggle-type displacement amplification friction dampers were installed on the test PTT as shown in Fig. 15 and 16, respectively. The slot friction dampers were installed at heights up to 12 m from the support footing, and the toggle-type friction dampers were installed above the slot friction dampers.
C. Efficacy validation using field measurements 1) Field measurement setup
As presented in Fig. 17, the following three variables were
measured in the PTT test under a wind load or its increase as parameters for the efficacy evaluation of the friction dampers.
• Wind speed and direction
• Strain (16 spots: 4 spots on each of the 4 main posts) • Vibration (3 directions)
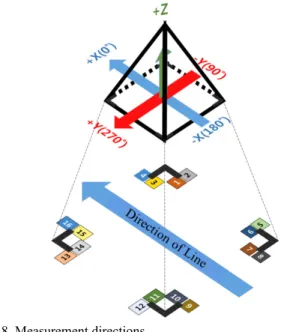
The measurement directions for the vibration and strain gauge sensors were designated as X for the direction running along the transmission line, Y for the direction perpendicular to the transmission line, and Z for the direction running along the PTT length, as illustrated in Fig. 18.
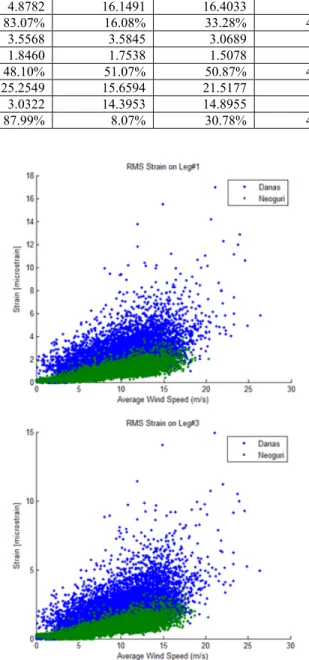
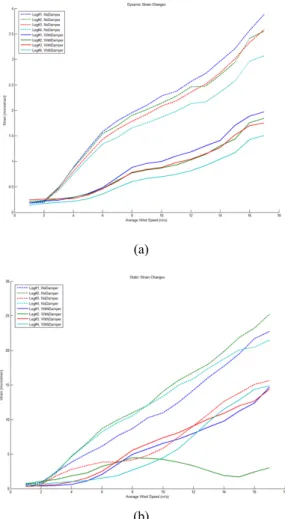
For comparison purposes, two field measurements were made on the test PTT to obtain two sets of data for the pre- and post-retrofit metrics. Specifically, we measured the vibration and strain changes according to mean wind speed during Typhoon Danas in 2013 before the installment of dampers and during Typhoon Neoguri in 2014 after the installment of dampers.
2) Measurement results
To verify the effects of the friction dampers, the dynamic characteristics of the test PTT were compared using the two sets of data obtained from the vibration sensor installed atop the PTT at the condition before (2013) and after (2014) the installation of the dampers during typhoon events.
Fig. 19 shows the frequency curves of the vibrations induced by a wind gust (mean wind speed: 10 m/s) measured at the peak of the test PTT in three directions for 10 min. For the frequency analysis, frequency conversion was performed on 10-s portions of each randomly selected 10-min section up to 100 Hz in consideration of the continuously changing wind speed during 10 min. The frequency signals were processed to find the linear average. In general, structures influenced by wind speed tend to amplify vibrations in the resonance component, while natural vibration components show dynamic behaviors. Looking at the frequency curves yielded by the measurement results, areas with elevated amplitudes are observed in some frequency sections. As verified in earlier field measurements, where the 1st natural Fig. 15. Installment of slot-type friction dampers
Fig. 16. Installation of toggle-type friction dampers
Fig. 17. Gauge sensor placement and measurement configuration
Fig. 18. Measurement directions
vibration mode of the test PTT was in the range of 2-2.5 Hz, the acceleration rate here also showed an upward tendency near 2 Hz.
Moreover, a blast of wind hitting an overhead transmission line
in a nearly perpendicular direction swirls the surrounding air, causing the wire to vibrate vertically as a result of the alternating force in the vertical direction of the wire. If its vibration frequency coincides with the natural frequency of vibration, whose magnitude is determined by the span length and mass per unit length, strong vibrations can occur as a result of resonance.
Thus, if a blast of wind passes a PTT in a direction perpendicular to the direction of the power transmission line, with the wind speed exceeding a certain critical value, the wake flow of the current gives rise to the vortex shedding frequency, which causes strong vibrations and radiating noise. The vortex shedding frequency is known to range between 3 Hz and 86 Hz. In the present measurements, when the instantaneous wind speed rose as the typhoon was approaching, a component frequency of about 70 Hz was observed to surge in the X and Z directions, with accompanying noise.
(a)
(b)
(c)
Fig. 19. Frequency curves of vibrations induced by wind gust (mean wind speed: 10 m/s) measured at peak of test PTT in three directions for 10 min. The second data item presented is the strain generated under wind loads as an indirect effect of typhoon events. Two sets of measurement data, one from the test PTT without dampers and the other with dampers, are presented to compare the magnitudes of the strain.
(a) X direction, (b) Y direction, (c) Z direction
0 20 40 60 80 100
1E-3 0.01 0.1
At wind speed 10m/s to Y dir.
DANAS (Without Damper) NURGURI(With Damper)
Acceleration (m/s2)
Frequency (Hz)
0 20 40 60 80 100
1E-3 0.01 0.1
At wind speed 10m/s to X dir.
DANAS (Without Damper) NURGURI(With Damper)
Acceleration (m/s2)
Frequency (Hz)
0 20 40 60 80 100
1E-3 0.01 0.1
At wind speed 10m/s to Z dir.
DANAS (Without Damper) NURGURI(With Damper)
Acceleration (m/s2)
Frequency (Hz)