http://dx.doi.org/10.5228/KSTP.2015.24.1.52
열가소성 섬유금속적층판의 온도를 고려한 유동응력 예측에 대한 연구
박으뜸1 · 이병언1 · 강동식2 · 김 정1 · 강범수1 · 송우진#
Evaluation of the Temperature Dependent Flow Stress Model for Thermoplastic Fiber Metal Laminates
E. T. Park, B. E. Lee, D. S. Kang, J. Kim, B. S. Kang, W. J. Song
(Received September 23, 2014/ Revised November 25, 2014 / Accepted December 3, 2014)
Abstract
Evaluation of the elevated temperature flow stress for thermoplastic fiber metal laminates(TFMLs) sheet, comprised of two aluminum sheets in the exterior layers and a self-reinforced polypropylene(SRPP) in the interior layer, was conducted.
The flow stress as a function of temperature should be evaluated prior to the actual forming of these materials. The flow stress can be obtained experimentally by uniaxial tensile tests or analytically by deriving a flow stress model. However, the flow stress curve of TFMLs cannot be predicted properly by existing flow stress models because the deformation with temperature of these types of materials is different from that of a generic pure metallic material. Therefore, the flow stress model, which includes the effect of the temperature, should be carefully identified. In the current study, the flow stress of TFMLs were first predicted by using existing flow stress models such as Hollomon, Ludwik, and Johnson-Cook models. It is noted that these existing models could not effectively predict the flow stress. Flow stress models such as the modified Hollomon and modified Ludwik model were proposed with respect to temperatures of 23℃, 60℃, 90℃, 120℃. Then the stress-strain curves, which were predicted using the proposed flow stress models, were compared to the stress-strain curves obtained from experiments. It is confirmed that the proposed flow stress models can predict properly the temperature dependent flow stress of TFMLs.
Key Words : Fiber Metal Laminates, Flow Stress, Temperature-dependency, Modified Hollomon Model, Modified Ludwik Model
1. 서 론
섬유금속적층판(fiber metal laminates, FMLs)은 외부 의 금속 판재와 내부의 복합재료로 구성된 하이브 리드 소재다. 기존의 복합재료가 가지고 있는 단점 인 충격 하중에 대한 취약성, 파손 시 수리의 어려 움, 수분 흡수에 의한 성능 저하 등을 극복할 수 있
고[1], 적층 재료에 따라 사용자의 목적에 부합하는 재료를 선정할 수 있는 장점을 가지고 있다. 현재 항공기 외피나 구조물로써 적용되고 있는 섬유금속 적층판은 유리섬유(glass fiber)나 아라미드섬유(aramid fiber)가 포함된 열경화성 섬유금속적층판으로[2, 3], 재활용이 불가능하며, 성형공정이 까다로운 단점을 지니고 있다. 이를 극복하기 위해 열가소성 수지를 1. 부산대학교 항공우주공학과
2. 부산대학교 첨단정밀공학협동과정
# Corresponding Author : Industrial Liaison Innovation Center, Pusan National University, E-mail:[email protected]
0.00 0.04 0.08 0.12 0.16 0
50 100 150 200
True strain [mm/mm]
TFMLs 0o
23oC 60oC 90oC 120oC
Flow stress [MPa]
0.00 0.04 0.08 0.12 0.16
0 50 100 150 200
TFMLs 45o
23oC 60oC 90oC 120oC
Flow stress [MPa]
True strain [mm/mm]
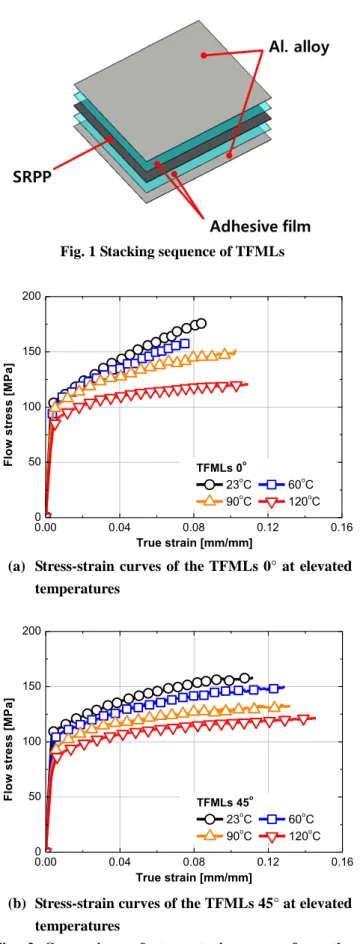
Fig. 1 Stacking sequence of TFMLs
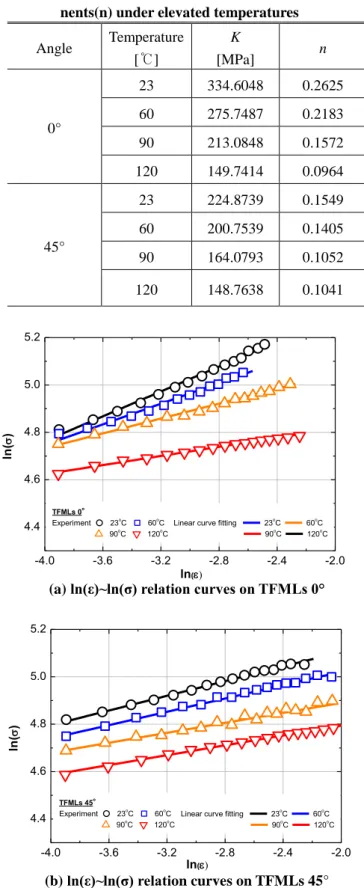
(a) Stress-strain curves of the TFMLs 0° at elevated temperatures
(b) Stress-strain curves of the TFMLs 45° at elevated temperatures
Fig. 2 Comparison of stress-strain curves from the tensile test at elevated temperature
사용한 섬유금속적층판에 대한 연구가 활발히 진행 중이며, 섬유금속적층판의 기계적 물성치 획득 및 성형공정을 모사한 연구 사례가 보고되고 있다[4~5].
일반적으로 쓰이고 있는 금속 판재의 성형성 평 가는 주로 판재의 국부적인 파괴(fracture)나 넥킹 (necking) 현상의 발생 여부로 판단이 된다[6]. 하지 만 온도 및 변형속도에 따라 성형 한계가 달라지기 때문에 실험을 통한 성형성 평가보다 이론적인 방 법으로 성형성을 평가하기도 한다[7]. 이론적으로 판 재의 성형성을 예측하기 위해서는 판재 재료의 유 동응력(flow stress) 모델을 정의하는 것이 매우 중요 하며, 온도 혹은 변형속도에 민감한 재료는 그에 따 른 변형특성을 효율적으로 예측할 수 있는 유동응 력 모델로 정의되어야만 실질적인 성형성 판단이 가능하다[8].
본 연구에서는 알루미늄 판재와 자기 강화형 폴 리프로필렌(self-reinforced polypropylene, SRPP)을 적층 한 열가소성 섬유금속적층판의 온도에 따른 유동응 력선도를 도출하기 위해 23℃, 60℃, 90℃, 120℃에 서 단축 인장시험을 수행하였고, 도출한 유동응력 선도를 사용하여 기존의 유동응력 모델인 Hollomon, Ludwik 및 Johnson-Cook 모델의 적용가능성을 검토 하였다. 또한, 기존의 유동응력 모델의 적용 한계 를 개선하기 위해 Hollomon, Ludwik 모델의 재료상 수를 온도에 관한 1차식으로 선형 곡선접합(linear curve fitting)하여 유동응력 모델을 제안하였으며, 실 제 실험으로 도출된 유동응력 값과 비교를 통하여 제안된 유동응력의 타당성을 검증하였다.
2. 섬유금속적층판의 온도 환경을 고려한 단축 인장시험
본 연구에서는 수적층법(hand lay-up method)으로 두께 1mm의 직조(woven)형태인 자기 강화형 폴리프 로필렌과 두께 0.5mm의 알루미늄 5052계열, 그리고 폴리올레핀 계열의 접착필름을 Fig. 1과 같이 적층하 였다. 단축 인장시험에 사용된 시편은 ASTM D3039 를 참고하였으며, 알루미늄 판재의 압연 방향(rolling direction)을 기준으로 0˚, 45˚ 방향의 시편을 확보하 였다[9].
2.1 온도 환경을 고려한 단축 인장시험
상온(23℃)에서의 단축 인장시험은 ASTM D3039에
-4.0 -3.6 -3.2 -2.8 -2.4 -2.0 4.4
4.6 4.8 5.0 5.2
Linear curve fitting 23oC 60oC 90oC 120oC TFMLs 0o
Experiment 23oC 60oC 90oC 120oC
ln()
ln(
-4.0 -3.6 -3.2 -2.8 -2.4 -2.0
4.4 4.6 4.8 5.0 5.2
Linear curve fitting 23oC 60oC 90oC 120oC
ln()
TFMLs 45o
Experiment 23oC 60oC 90oC 120oC
ln(
제시된 절차로 수행되었으며[9], 추가적으로 온도 환 경을 변화시키기 위해 만능시험기 MTS에 챔버 (chamber)를 설치하여 실험을 수행하였다. 인장 하중 조건은 2mm/min이며, 접착필름의 녹는점인 120℃를 고려하여, 60℃, 90℃, 120℃에서의 단축 인장시험을 수행하였다. 시험을 수행하기 전, 시편의 온도가 균 일하게 유지되어야 하기 때문에 ASTM E21을 참고 하여 약 30분의 예열시간 이후에 시험을 수행하였 다[10].
섬유금속적층판의 온도에 따른 단축 인장시험결 과는 Fig. 2와 같으며, 온도가 섬유금속적층판의 유 동거동에 큰 영향을 끼치는 것을 알 수 있다.
3. 섬유금속적층판의 유동응력 예측
3.1 기존 유동응력 모델에 대한 분석
섬유금속적층판의 온도에 따른 유동응력선도는 실험적 방법 이외에 이론적 방법으로도 규명할 수 있다. 기존의 유동응력 모델 중 Hollomon 모델과 Ludwik 모델, Johnson-Cook 모델 등이 보편적으로 적 용되며[11], 본 연구에서는 먼저 기존의 모델이 온도 환경을 고려한 섬유금속적층판의 유동응력선도 예 측에 적용이 가능한지를 분석하였다.
3.1.1 Hollomon 모델
Hollomon 모델은 유동응력과 변형률의 관계를 간 단히 나타내는 유동응력 모델로 식(1)과 같이 표현 할 수 있다.
K
n (1)
ln lnln
K n
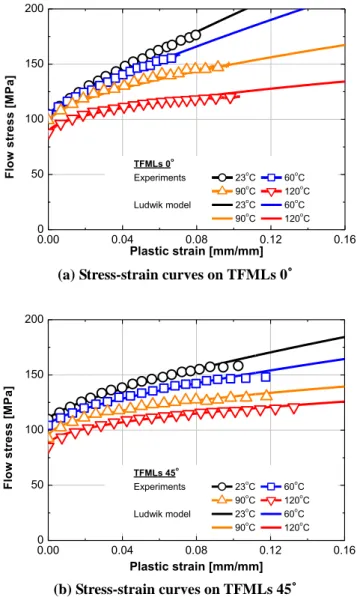
(2)K와 n은 각각 강도계수(strength coefficient), 가공경 화지수(work hardening exponent)이다. 재료상수들을 구하기 위해서는 먼저, 식(1)을 식(2)와 같이 로그 스케일로 치환하여야 한다. 이후, Fig. 3과 같이 선형 곡선접합 방법을 사용하여 재료상수를 추출할 수 있다. 추출한 재료상수 값은 Table 1과 같으며, 실험 을 통하여 도출된 유동응력선도와 비교한 그래프는 Fig. 4와 같다. Fig. 4를 통하여 실제 실험에서의 유동 응력선도와 유사함을 알 수 있으나, 각 온도마다 재 료상수 값들을 구해야 하는 단점을 가지고 있어,
Table 1 Strength coefficients(K) and work hardening expo- nents(n) under elevated temperatures
Angle Temperature [℃]
K
[MPa] n
0°
23 334.6048 0.2625 60 275.7487 0.2183 90 213.0848 0.1572 120 149.7414 0.0964
45°
23 224.8739 0.1549 60 200.7539 0.1405 90 164.0793 0.1052 120 148.7638 0.1041
(a) ln(ε)~ln(σ) relation curves on TFMLs 0°
(b) ln(ε)~ln(σ) relation curves on TFMLs 45°
Fig. 3 Relationships between effective stress and strain at the elevated temperatures
n p
K
A
) ln lnln(
n
K
pA
0.00 0.04 0.08 0.12 0.16
0 50 100 150 200
True strain [mm/mm]
TFMLs 0o
Experiments 23oC 60oC 90oC 120oC Hollomon model 23oC 60oC 90oC 120oC
Flow stress [MPa]
0.00 0.04 0.08 0.12 0.16
0 50 100 150 200
TFMLs 45o
Experiments 23oC 60oC 90oC 120oC Hollomon model 23oC 60oC 90oC 120oC
Flow stress [MPa]
True strain [mm/mm]
-6 -5 -4 -3 -2
0 1 2 3 4 5
ln(p)
ln()
TFMLs 0o
Experiment 23oC 60oC 90oC 120oC
Linear curve fitting 23oC 60oC 90oC 120oC
-6 -5 -4 -3 -2
0 1 2 3 4 5
ln()
ln(p)
TFMLs 45o
Experiment 23oC 60oC 90oC 120oC
Linear curve fitting 23oC 60oC 90oC 120oC
(a) Stress-strain curves on TFMLs 0°
(b) Stress-strain curves on TFMLs 45°
Fig. 4 Comparison between the experimentally obtained stress-strain curves and the flow stress curves from the Hollomon model
Hollomon 모델은 온도에 따른 섬유금속적층판의 유동 거동을 나타내기에 비효율적이다. 이러한 단점을 해결 하려면 기존의 Hollomon 식에 온도에 대한 효과를 고 려하는 온도에 관한 식을 추가하여야 함을 알 수 있다.
3.1.2 Ludwik 모델
Ludwik 모델은 식(3)과 같이 Hollomon 모델에서 항복응력 항을 추가하였으며, 소성변형률에 대한 유 동응력의 관계를 나타낸 식이다.
(3) (4)
A와 K, n은 재료상수이며,
p는 소성변형률이다.Table 2 Yield strength(A) and material constants(K, n) at the elevated temperatures
Angle Temperature [℃]
A [MPa]
K
[MPa] n
0°
23 104.5549 648.5895 0.8556 60 104.6800 481.9787 0.8162 90 99.0457 212.4061 0.6191 120 87.9530 122.0462 0.5285
45°
23 109.8039 277.8552 0.7180 60 104.1852 200.3048 0.6558 90 92.5462 107.1093 0.4505 120 85.0126 91.9431 0.4434
(a) ln(ε)~ln(σ-A) relation curves on TFMLs 0°
(b) ln(ε)~ln(σ-A) relation curves on TFMLs 45°
Fig. 5 Relationships between plastic stress and strain under elevated temperatures
0.00 0.04 0.08 0.12 0.16 0
50 100 150 200
TFMLs 0o
Experiments 23oC 60oC 90oC 120oC Ludwik model 23oC 60oC 90oC 120oC
Flow stress [MPa]
Plastic strain [mm/mm]
0.00 0.04 0.08 0.12 0.16
0 50 100 150 200
TFMLs 45o
Experiments 23oC 60oC 90oC 120oC Ludwik model 23oC 60oC 90oC 120oC
Flow stress [MPa]
Plastic strain [mm/mm]
(a) Stress-strain curves on TFMLs 0°
(b) Stress-strain curves on TFMLs 45°
Fig. 6 Comparison between the experimentally obtained stress-strain curves and the flow stress curves from the Ludwik model
각 재료상수 값들은 식(3)을 로그화한 식(4)에 대 한 응력변형률선도에서 Fig. 5와 같은 선형 곡선 접합을 사용하여 추출할 수 있다. 추출한 재료상 수 값은 Table 2와 같으며, 실험을 통하여 도출된 유동응력선도와 비교한 그래프는 Fig. 6과 같다.
Ludwik 모델은 Hollomon 모델처럼 실제 실험에서 의 유동응력선도와 유사한 결과를 얻을 수 있지 만, 각 온도 조건에 따른 실험을 수행해야 하는 단점을 가지고 있다. 이러한 단점을 극복하고자 기존의 Ludwik 모델에 온도와 변형률 속도를 고 려한 Johnson-Cook 모델이 보편적으로 사용되고 있다.
Table 3 Material constant(m) at the melting temperatures
Specimen angle
Melting temperature
[℃]
Material constant, m
0°
175
1.9448 628.5
45°
175
1.4429 628.5
3.1.3 Johnson-Cook 모델
Johnson-Cook 모델은 온도와 변형률 속도 변화를 고려하여 재료의 유동응력을 예측하기 위한 식으로, 식(5)와 같이 유동응력과 변형률의 관계에 관한 Ludwik 모델(첫 번째 항)에 변형률 속도에 의한 경 화(두 번째 항)와 온도에 의한 연화(세 번째 항)를 고려하는 항으로 구성되어 있다.
m
r m n r
p T T
T C T
B
A 1 ln 1 ( )
0
(5)
p 와
는 소성변형률과 변형률 속도,
0는 기준변형률 속도, T는 실험 환경 온도, Tm은 용융점, Tr은 기준 온도다.A, B, C, n, m은 각각 재료상수이다.
Johnson-Cook 모델에서 재료상수 A, B와 n은 각각 항복강도, 강도계수 그리고 가공경화지수이며, 이 값들은 23℃에서의 Ludwik 모델에서 도출한 값과 동일하다. 또한, 본 연구에서는 변형률 속도에 의한 가공경화를 고려하지 않기 때문에, 변형률 속도 항 은 1의 값을 가지게 되므로 재료상수 C는 추출하지 않는다. 재료상수 m은 Fig. 7과 같이 유동응력과 소 성변형률, 온도와의 상관관계를 통해 구할 수 있다.
이때, 섬유금속적층판은 이종소재간 접합소재로 용 융점 선정에 있어 어려움이 있으며, 구성소재인 알 루미늄 5052, 자기 강화형 폴리프로필렌의 용융점을 각각 대입하였다. 추출한 재료상수 값은 Table 3과 같으며, 재료의 녹는점에 관계없이 재료상수 m은 동 일한 것을 알 수 있다. 도출한 Johnson-Cook 모델과 실험을 통해 도출된 유동응력선도를 비교하는 그래 프는 Fig. 8과 같으며, 실험을 통해 도출된 유동응력 값과 Johnson-Cook 모델에 의해 도출된 값이 현저히
Fig. 8 Comparison between the experimentally obtained stress-strain curves and the flow stress curves from the Johnson-Cook model
Fig. 7 Relationships between stress-strain and the temperatures
-3.2 -2.4 -1.6 -0.8 0.0 0.8
-5 -4 -3 -2 -1
ln[(T-Tr)/(Tm-Tr)]
ln[1-/A+Bn )]
TFMLs 0o
Experiments Tm=175.0oC Tm=628.5oC Linear Curve fitting Tm=175.0oC Tm=628.5oC
-3.2 -2.4 -1.6 -0.8 0.0 0.8
-5 -4 -3 -2 -1
ln[(T-Tr)/(Tm-Tr)]
ln[1-/A+Bn )]
TFMLs 45o
Experiments Tm=175.0oC Tm=628.5oC Linear Curve fitting Tm=175.0oC Tm=628.5oC
(a) ln[1-σ/(A+Bεn)~ln[(T-Tr)/(Tm-Tr)] relation curves on TFML 0˚
(b) ln[1-σ/(A+Bεn)~ln[(T-Tr)/(Tm-Tr)] relation curves on TFML 45˚
(a) TFMLs 0˚, Tm=175℃
0.00 0.04 0.08 0.12 0.16
0 50 100 150 200
Experiments 23oC 60oC 90oC 120oC Johnson-Cook model 23oC 60oC 90oC 120oC
Flow stress [MPa]
Plastic strain [mm/mm]
(b) TFMLs 0˚, Tm=628.5℃
0.00 0.04 0.08 0.12 0.16
0 50 100 150 200
Experiments 23oC 60oC 90oC 120oC Johnson-Cook model 23oC 60oC 90oC 120oC
Flow stress [MPa]
Plastic strain [mm/mm]
(d) TFMLs 45˚, Tm=628.5℃
0.00 0.04 0.08 0.12 0.16
0 50 100 150 200
Experiments 23oC 60oC 90oC 120oC Johnson-Cook model 23oC 60oC 90oC 120oC
Flow stress [MPa]
Plastic strain [mm/mm]
(c) TFMLs 45˚, Tm=175℃
0.00 0.04 0.08 0.12 0.16
0 50 100 150 200
Experiments 23oC 60oC 90oC 120oC Johnson-Cook model 23oC 60oC 90oC 120oC
Flow stress [MPa]
Plastic strain [mm/mm]
20 40 60 80 100 120 140 0.08
0.12 0.16 0.20 0.24 0.28
TFMLs 0o Experiment Curve fitting TFMLs 45o Experiment Curve fitting
n
Temperature [oC]
20 40 60 80 100 120 140
100 150 200 250 300
350 TFMLs 0o
Experiment Curve fitting TFMLs 45o Experiment Curve fitting
K [MPa]
Temperature [oC]
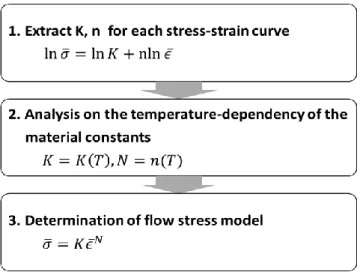
Fig. 9 Procedure to determine the modified Hollomon model
(a) Parameter K and temperature relation curves
(b) Parameter n and temperature relation curves Fig.10 Relationship between K, n and temperature
차이가 나는 것을 알 수 있다. 이는 Johnson-Cook 모델에 포함된 Ludwik 모델과 온도가 서로 독립적 이지 않기 때문으로 판단된다. 따라서, 변형률 항과 온도와의 상관관계를 확인하는 것이 중요함을 알 수 있다.
3.2 온도를 고려한 유동응력 모델 제안
기존의 Hollomon 모델과 Ludwik 모델, Johnson- Cook 모델을 분석한 결과, 이종 재료간 접합으로 제 작된 섬유금속적층판의 경우, 기존의 유동응력 모델 에 온도에 관한 항을 단순히 추가하는 것으로 실제 유동거동을 효과적으로 예측할 수 없으며, 변형률 항과 온도 변수는 서로 상관관계가 있는 것을 알 수 있었다. 본 연구에서는 수정된 Hollomon, Ludwik 모델을 제안하고 실제 실험 값과 비교 분석하였다.
3.2.1 수정된 Hollomon 모델
수정된 Hollomon 모델은 기존의 Hollomon 모델에 서의 재료상수인 K와 n을 식(6)과 같이 온도에 관한 함수로 정의하였다.
) (T K
K , N n(T) (6)
수정된 Hollomon 모델은 Fig. 9와 같은 절차를 통 하여 유동응력선도를 예측하였다. 먼저, 각 온도 조 건에서의 재료상수 K와 n을 추출하였고, 도출된 재 료상수들과 온도와의 연관관계를 분석하였다. 도출 된 재료상수들은 Fig. 10과 같이 온도와 선형에 근접 한 관계를 가지는 것을 알 수 있으며, 선형 곡선접 합 방법을 통하여 K와 N을 추출할 수 있다. 수정된 Hollomon 모델은 Fig. 11과 같이 온도에 따라 효과적 으로 섬유금속적층판의 유동거동을 예측할 수 있음 을 알 수 있다. 제안한 수정된 Hollomon 모델의 식 은 아래와 같다.
0.0015 0.31440 1.954T387.430
T
(7)
0.0006 0.168945 0.824T244.960 T
(8)
3.2.2 수정된 Ludwik 모델
수정된 Ludwik 모델은 Ludwik 모델에서의 재료상 수인 A, K, n을 온도에 관한 함수로 보정하였다. 수 정된 Ludwik 모델에 대한 정의는 Fig. 12와 같은
0.00 0.04 0.08 0.12 0.16 0
50 100 150 200
TFMLs 0o
Experiments 23oC 60oC 90oC 120oC Modified Hollomon model 23oC 60oC 90oC 120oC
True strain [mm/mm]
Flow stress [MPa]
0.00 0.04 0.08 0.12 0.16
0 50 100 150 200
TFMLs 45o
Experiments 23oC 60oC 90oC 120oC Modified Hollomon model 23oC 60oC 90oC 120oC
True strain [mm/mm]
Flow stress [MPa]
20 40 60 80 100 120 140
80 90 100 110 120
Temperature [oC]
TFMLs 0o Experiment Curve fitting TFMLs 45o Experiment Curve fitting
A [MPa]
20 40 60 80 100 120 140
0.4 0.5 0.6 0.7 0.8 0.9 1.0
Temperature [oC]
TFMLs 0o Experiment Curve fitting TFMLs 45o Experiment Curve fitting
n
20 40 60 80 100 120 140
100 200 300 400 500 600 700
Temperature [oC]
TFMLs 0o Experiment Curve fitting TFMLs 45o Experiment Curve fitting
K [MPa]
(a) Stress-strain curves on TFMLs 0°
(b) Stress-strain curves on TFMLs 45°
Fig.11 Comparison of experimental and predicted values by the modified Hollomon model
Fig.12 Procedure to determine the modified Ludwik model
(a) Parameter A and temperature relation curves
(b) Parameter K and temperature relation curves
(c) Parameter n and temperature relation curves Fig.13 Relationship between A, K, n and temperature
0.000 0.04 0.08 0.12 0.16 50
100 150 200
TFMLs 0o
Experiments 23oC 60oC 90oC 120oC Modified Ludwik model 23oC 60oC 90oC 120oC
Flow stress [MPa]
Plastic strain [mm/mm]
0.000 0.04 0.08 0.12 0.16
50 100 150 200
TFMLs 45o
Experiments 23oC 60oC 90oC 120oC Modified Ludwik model 23oC 60oC 90oC 120oC
Flow stress [MPa]
Plastic strain [mm/mm]
절차를 따른다. 먼저, 각 온도 조건에서의 A, K, n을 추출하였으며, 도출된 재료상수들과 온도와의 연관 관계를 분석하였다. Fig. 13과 같이 재료상수 A, K, n 은 온도와 선형적인 관계를 가진다고 가정하였으며, 선형 곡선접합 방법을 사용하여 온도에 관한 1차식 으로 추출하였다. 수정된 Ludwik 모델은 Fig. 14와 같이 효과적으로 섬유금속적층판의 유동거동을 예 측할 수 있음을 알 수 있다. 제안한 수정된 Ludwik 모델의 식은 아래와 같다.
(9)
(10)
(a) Stress-strain curves on TFMLs 0°
(b) Stress-strain curves on TFMLs 45°
Fig.14 Comparison of experimental and predicted values by the modified Ludwik model
4. 결 론
본 연구는 외부의 알루미늄과 내부의 자기 강화 형 폴리프로필렌으로 구성된 섬유금속적층판에 대 한 유동응력을 온도 환경에 따라 도출하였다. 유동 응력 모델을 후속 연구 수행에 적용하기 위하여, 본 연구에서는 기존 모델에서의 재료상수를 온도에 따 른 함수로 고려하였다.
기존의 Hollomon 모델과 Ludwik 모델에서의 각 온도에 따른 재료상수를 도출한 결과, 온도가 증가 할수록 선형적으로 감소하는 것을 알 수 있었다. 또 한 Johnson-Cook 모델을 적용한 결과, 기존의 유동 응력 모델에 단순히 온도에 의존하는 항을 추가해 서는 실험에서의 유동응력선도와 유사한 그래프를 얻을 수 없다는 것을 알 수 있었다. 따라서 본 연구 에서는 Hollomon 모델과 Ludwik 모델에서의 재료상 수를 온도에 의존하는 함수로 고려하였다.
Hollomon 모델의 재료상수는 온도에 따라 선형적 으로 감소하기 때문에 이 값들을 온도에 의존하는 1차식으로 간단히 나타내어 실제 실험에서 도출된 유동응력을 효과적으로 예측할 수 있음을 보였다.
Ludwik 모델의 재료상수는 온도에 따라 감소하지만, 선형 곡선접합에서 다소 오차가 있음을 알 수 있다.
이러한 차이에 의해 수정된 Hollomon 모델이 수정 된 Ludwik 모델보다 좀 더 효과적으로 유동거동을 예측할 수 있음을 보였다.
본 연구에서 제시된 유동응력 모델들은 변형률 속도가 고려되지 않았다. 하지만 기존의 Hollomon 모델과 Ludwik 모델에 변형률 속도에 의한 경화 효 과를 고려한 수정 모델이 연구된 사례가 있기 때문 에[12], 향후 섬유금속적층판의 온도 및 변형률 속도 를 고려한 유동응력 모델을 제시할 수 있는 여지가 충분하며, 이 모델의 도출기법은 섬유금속적층판의 성형성에 대한 수치해석에 유용하게 적용할 수 있 을 것이라 판단된다.
후 기
이 논문은 2013 년도 정부(미래창조과학부)의 재원 으로 한국연구재단의 지원을 받아 수행된 연구임 (No. 2012R1A5A1048294). 또한 2012 년도 한국에너 지기술평가원(KETEP)의 에너지인력양성지원사업(No.
20124030200020)에 의해 수행되었습니다. 이에 관계
0.0036 0.97040 0.168T111.394 5.751T787.522 T
0.0027 0.748545 0.266T117.361 1.659T273.264 T
자 여러분께 감사드립니다.
REFERENCES
[1] H. S. Choi, H. S. Roh, G. H. Kang, M. S. Ha, 2004, Study on the Thermo-Mechanical Behaviors of Fiber Metal Laminates Using the Classical Lamination Theory, Trans. Kor. Soc. Mec. Eng., Vol. 28, No. 4, pp. 394~401.
[2] J. W. Gunnink, 1988, Damage Tolerance and Supportability Aspects of ARALL Laminates Aircraft Structures, Compos. Struct., Vol. 10, No. 1, pp.
83~104.
[3] L. B. Vohelesang, A. Vlot, 2000, Development of Fibre Metal Laminates for Advanced Aerospace Structures, J. Mater. Process. Technol., Vol. 103, No.
1, pp. 1~5.
[4] B. E. Lee, J. Kim, B. S. Kang, W. J. Song, 2013, Numerical Study of the Formability of Fiber Metal Laminates Based on Self-reinforced Polypropylene, Trans. Mater. Process., Vol. 22, No. 3, pp. 150~157.
[5] S. Kalyanasundaram, S. DharMalingam, S. Venkates - an, A. Sexton, 2013, Effect of Process Parameters during Forming of Self Reinforced-PP Based Fiber Metal Laminate, Compos. Struct., Vol. 97, pp.
332~337.
[6] F. Ozturk, D. Lee, 2004, Analysis of Forming Limits using Ductile Fracture Criteria, J. Mater. Process.
Technol., Vol. 147, No. 3, pp. 397~404.
[7] M. H. Lee, K. K. Kim, H. Y. Kim, S. I. Oh, 2008, Evaluation of the Formability of Warm Forming Simulation of Magnesium Alloy Sheet using FLD, Trans. Mater. Process., Vol. 17, No. 7, pp. 501~506.
[8] W. J. Song, S. C. Heo, T. W. Ku, B. S. Kang, J. Kim, 2011, Evaluation of Strain, Strain Rate and Temperature Dependent Flow Stress for Magnesium Alloy Sheets, Trans. Mater. Process., Vol. 20, No. 3, pp. 229~235.
[9] ASTM Standard D3039, 2011, Standard Test Method for Tensile Properties of Polymer Matrix Composite Materials, ASTM International, DOI: 10.1520/E0008 _E0008M-11.
[10] ASTM Standard E21, 2009, Standard Test Method for Elevated Temperature Tension Tests of Metallic Materials, ASTM International, DOI: 10.1520/E0021- 09.
[11] A. K. Maheshwari, K. K. Pathak, N. Ramakrishnan, S.
P. Narayan, 2010, Modified Johnson-Cook Material Flow Model for Hot Deformation Processing, J.
Mater. Sci., Vol. 45, No. 4, pp. 859~864.
[12] B. Tech., 2006, M. Thesis, The University of British Columbia, British Columbia, pp. 1~131.