Original Article
PET/CT 검사 시 CT 피폭선량 감소 방법들의 최적화 평가서울대학교병원 핵의학과
도용호·이홍재·김진의
Evaluation for Optimization of CT Dose Reduction Methods in PET/CT
Yong Ho Do, Hong Jae Lee and Jin Eui Kim
Department of Nuclear Medicine, Seoul National University Hospital, Seoul, Korea
Purpose Various methods for reducing radiation exposure have been continuously being developed. The aim of this study is to evaluate effectiveness of dose reduction, image quality and PET SUV changes by applying combination of automatic exposure dose(AEC), automated dose-optimized selection of X-ray tube voltage(CAREkV) and sinogram affirmed iterative reconstruction(SAFIRE) which can be controled by user.
Materials and Methods Torso, AAPM CT performance and IEC body phantom images were acquired using biograph mCT64, (Siemens, Germany) PET/CT scanner. Standard CT condition was 120 kV, 40 mAs. Radiation exposure and noise were evaluated by applying AEC, CAREkV(120 kV, 40 mAs) and SAFIRE(120 kV, 25 mAs) with torso phantom compare to standard CT condition. And torso, AAPM and IEC phantom images were acquired with combination of 3 methods in condition of 120 kV, 25 mAs to evaluate radiation exposure, noise, spatial resolution and SUV changes.
Results When applying AEC, CTDIvol and DLP were decreased by 50.52% and 50.62% compare to images which is not applying AEC. mAs was increased by 61.5% to compensate image quality according to decreasing 20 kV when applying CAREkV. However, CTDIvol and DLP were decreased by 6.2% and 5.5%. When reference mAs was the lower and strength was the higher, reduction of radiation exposure rate was the bigger. Mean SD and DLP were decreased by 2.2% and 38% when applying SAFIRE even though mAs was decreased by 37.5%(from 40 mAs to 25 mAs). Combination of 3 methods test, SD decreased by 5.17% and there was no significant differences in spatial resolution. And mean SD and DLP were decreased by 6.7% and 36.9%
compare to 120 kV, 40 mAs with AEC. For SUV test, there was no statistical differences(P>0.05).
Conclusion Combination of 3 methods shows dose reduction effect without degrading image quality and SUV changes. To reduce radiation exposure in PET/CT study, continuous effort is needed by optimizing various dose reduction methods.
Key Words Dose reduction, CAREdose4D, CAREkV, SAFIRE, SUV
1)
서 론
PET/CT 검사에서 CT는 상대적으로 부족한 PET의 해부 학적인 정보와 해상도를 극복하고 PET영상의 감쇄보정을 위하여 사용된다. 또한 외부 감마선원을 이용한 투과영상 획
∙Received: October 02. 2015 Accepted: October 13. 2015
∙Corresponding author: Yong Ho Do
∙Department of nuclear medicine, Seoul National University Hospital, 28 Yeongondong, Jongno-gu, Seoul, 110-744, Korea Tel.: +82-2-2072-3937, Fax.: +82-2-747-0208
E-mail: [email protected]
득을 CT 영상으로 대체함으로써 영상 획득 시간의 단축이
가능하게 되었다. 1) 그러나 이와 같은 많은 장점에도 불구하
고 방사선 피폭에 대한 우려가 증가되고 있으며 각 제조사 들
은 CT에 의한 피폭선량 감소를 위한 방법들의 개발을 위하
여 꾸준히 노력하고 있다. 다양한 CT 피폭선량 감소 방법 중
automatic exposure control(AEC) 는 각 환자의 형태에 따라
적정 선량을 조사함으로써 각 slice에서 적정 영상의 질의 획
득과 artifact, 피폭선량 감소가 가능하며 X-ray tube 부하의
감소로 인한 tube 사용 기간이 증가하게 된다. 2) Automated
dose-optimized selection of X-ray tube voltage(CAREkV) 는 환자의 체척 또는 contrast enhanced study에서 관전압의 최 적화를 통하여 100 kV 또는 80 kV 조사 시 AEC와 함께 적용 되어 저 관전압에 따른 영상의 질 저하를 보상함과 동시에 contrast enhanced study 에서 iodine signal 증가와 피폭선량 감소를 목적으로 하는 방법이다. 3-4) Sinogram affirmed iterative reconstruction(SAFIRE) 은 예측된 데이터와 측정된 데이터를 반복적으로 비교하는 iterative 재구성 방법을 이용 하여 raw data 영역에서는 artifact 감소, image 영역에서는 노 이즈 감소를 시행하며 저 선량을 조사하였을 때 증가하는 노 이즈를 억제함으로써 영상의 질을 개선시키고 피폭선량 감 소를 유도하는 방법이다. 5-8) 본 논문에서는 다양한 CT 피폭 선량 감소 방법 중 사용자에 의해 parameter 변경이 가능한 3 가지 방법인 AEC, CAREkV, SAFIRE 각 적용 시와 세 가지 방법의 조합에 따른 피폭선량 감소 효과와 영상의 질 변화유 무 그리고 세 가지 방법의 적용에 따른 PET SUV 변화 유무를 평가하였다.
실험재료 및 방법
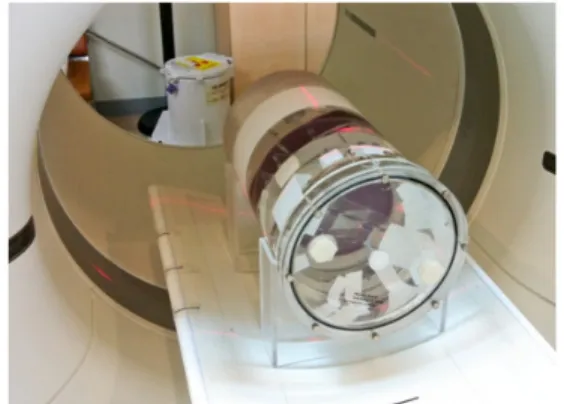
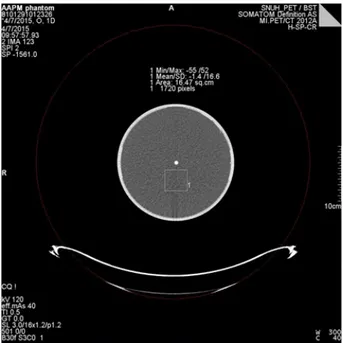
1. 실험 장비 및 재료실험에 이용된 장비는 Biograph mCT64 (Siemens medical system, Germany) 이며(Fig. 1) 실험에 사용된 phantom은 영 상의 질 평가를 위한 AAPM(the american association of physicists in medicine) CT performance phantom(Fig. 2) 과 피 폭선량 비교를 위하여 anthropomorphic head, chest, pelvis phantom(canadian scientific products, london, ontario, canada) 을 torso 모형으로 접합하여 사용하였으며(Fig. 3) PET SUV 변화 유무를 평가하기 위한 NEMA IEC body phantom(Fig. 4) 을 사용하였다.
Fig. 1. Siemens Biograph mCT64 PET/CT Scanner was used for acquisition
Fig. 2. AAPM CT performance phantom was used for evaluating image quality
Fig. 3. Anthropomorphic phantom was used for evaluating exposure dose comparison
Fig. 4. IEC body phantom was used for evaluating SUV changes
3. 실험 방법
절편 두께 3 mm, FOV(field of view) 500 mm, pitch 1.2 조건
은 AEC, CAREkV, SAFIRE 각 실험과 3가지 방법의 조합의
실험에서 동일하게 적용되었다. 피폭 선량 비교를 위하여
anthropomorphic head, chest, pelvis phantom 을 torso 모형으
로 접합하여 각 획득 영상에서의 DLP(dose length product)
mGycm 을 비교하였으며 torso phantom을 이용한 mAs 변화
와 노이즈 level 평가를 위하여 획득 영상의 모든 절편에서 spine region 을 따라 0.56 sq.cm의 ROI(region of interest)를 설 정하여 standard deviation의 변화를 평가하였다(Fig. 5).
Fig. 5. ROIs of 0.56 sq.cm were drawn in every slices for evaluating noise level
1) AEC
120 kV, 40 mAs 조건에서 AEC 적용, 미적용 시 torso phantom 에서 mAs 변화와 피폭선량이 비교 평가되었다.
2) CAREkV
(1) CAREkV 적용에 따른 피폭선량, noise level 평가 120 kV, 40 mAs 조건에서 CAREkV 적용, 미적용 시 torso phantom 에서 mAs 변화와 피폭선량, 노이즈 level이 비교 평 가 되었다.
(2) Reference mAs 별 CAREkV strength 변화에 따른 피폭선량 변화 평가
120 kV 조건에서 85 mAs부터 10 mAs까지 25 mAs씩 감소 시켜 각 mAs에서 strength 3, 5, 7, 11 조건으로 torso phantom 스캔 후 피폭선량 변화를 평가하였다. CAREkV strength(3:
non-contrast scan, 7: soft tissue with contrast scan, 11: vascular scan) 는 각 검사에서 최적화된 CNR(contrast to noise ratio)을 나타낼 수 있도록 설정되어 있다(Fig. 6).
Fig. 6. Strength of CAREkV displays optimised CNR in CT image
(3) Strength 3 기준 reference mAs 변화에 따른 피폭선량 변화 평가
120 kV, CAREkV strength 3 조건에서 210 mAs부터 10 mAs 까지 25 mAs씩 감소시켜 torso phantom 스캔 후 피폭선 량 변화를 평가하였으며 대부분의 PET/CT 검사에서는 non-contrast 로 검사가 진행되므로 strength 3이 채택된다.
3) SAFIRE
SAFIRE 적용 유무 시 유사한 노이즈 level을 나타내는 조 건인 9) 120 kV, 40 mAs SAFIRE 적용 시와 120 kV, 25 mAs 미 적용 시 torso phantom 스캔 후 피폭선량 변화와 노이즈 level 이 비교 평가 되었다.
4) AEC, CAREkV, SAFIRE 조합
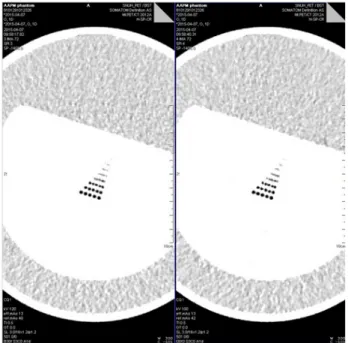
120 kV, 40 mAs AEC 적용시와, 120 kV, 25 mAs AEC, CAREkV, SAFIRE 적용 시 torso phantom scan 후 피폭 선량 과 노이즈 level이 평가 되었다. 동일 조건에서 AAPM CT performance phantom 을 이용하여 6시 방향 4분의 1지점에 16.47 sq.cm 의 사각형 ROI를 설정하여 노이즈 평가가 시행 되었으며(Fig. 7) window width: 300, level: -100으로 설정 후 공간 분해능 평가를 시행하였다(Fig. 8).
Fig. 7. Size of 16.47 sq.cm ROI was drawn in AAPM phantom image
for evaluating noise value
Fig. 8. Window width: 300, level: -100 was set in AAPM phantom image for evaluating spatial resolution
4) AEC, CAREkV, SAFIRE 적용에 따른 SUV 변화 평가 IEC body phantom 에 18 F-FDG 55.5 MBq 을 주입하여 background 와 hot lesion의 비율이 1:8이 되도록 제작 후 120 kV, 40 mAs 미적용 시, 120 kV, 40 mAs AEC 적용 시와 120 kV, 25 mAs AEC, CAEkV, SAFIRE 조합의 적용 시 SUV 변 화 유무를 평가하였으며 PSF(point spread fuction)+TOF (time of flight), iteration 2, subsets 21, matrix size 200, gaussian 5 mm filter 의 parameter가 PET 영상 재구성시 적용 되었다. 영상 재구성 후 동일한 slice에서 동일 VOI(volume of interest) 를 설정하여 SUV 측정 후 SPSS version 18.0 (SPSS Inc. USA) 을 이용하여 통계적으로 분석하였다.
결 과
1. AEC120 kV, 40 mAs AEC 를 적용하지 않았을 때 torso phantom 의 모든 슬라이스에서 동일한 mAs가 조사 되었지만 AEC 적 용 시 피폭선량 감소와 각 slice에서 적정 영상의 질을 나타낼 수 있도록 torso phantom 각 slice의 감쇄 정도에 따라 tube load 가 유동적으로 변화하였다(Fig. 9). AEC 미적용 시 대비 AEC 적용 시 mean mAs 52.50% 감소, CTDIvol 50.52% 감소 하였으며 DLP는 50.62% 감소하였다(Table 1).
Fig. 9. Tube load changed according to shape of phantom when applied AEC
Table 1. Mean mAs, CTDIvol and DLP were decreased when applied AEC compared to fixed mAs
AEC setting Mean mAs
CTDIvol (mGy)
DLP (mGycm)
AEC OFF 40.00 2.89 324
AEC ON 19.00 1.43 160
Rate of change(%) -52.50 -50.52 -50.62
2. CAREkV
1) CAREkV 적용에 따른 피폭선량, 노이즈 level 평가 120 kV 가 조사된 CAREkV 미적용 시 대비 CAREkV 적용 시 phantom의 체적이 고려되어 100 kV가 조사되었으며 저 하된 kV에 의한 영상의 질을 보상하기 위하여 mAs가 증가 되었으며(Fig. 10) mAs 보상에 따라 CAREkV 적용, 미적용 시 유사한 노이즈 level을 보였다.(Fig. 11) CAREkV 적용 시 mAs 보상에 따라 mean mAs는 61.5% 증가하였지만 20 kV 감소에 따라 CTDIvol 6.2%, DLP는 5.5% 감소하였다. 영상 의 질 보상에서 증가된 mAs에 의하여 mean SD는 10% 증가 하였다(Table 2).
Fig. 10. mAs increased for compensating low image quality by
100 kV
Fig. 11. Both of test(CAREkV on and off) shows similar noise level by mAs compensation
Table 2. When applied 100 kV, mean mAs and SD increased.
However, CTDIvol and DLP decreased contrastively
CAREkV setting MeanmAs
CTDIvol (mGy)
DLP (mGycm)
Mean SD
CAREkV OFF 13 0.97 109 35.14
CAREkV ON 21 0.91 103 38.69
Rate of change(%) 61.50 -6.20 -5.50 10.10
2) Reference mAs 별 CAREkV strength 변화에 따른 피폭선량 변화 평가
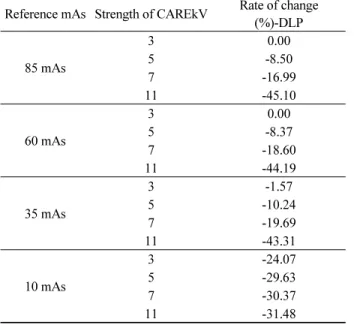
Reference mAs(ref.mAs) 별 CAREkV strength 변화에 따 른 DLP 변화에서 ref.mAs가 감소할수록 동일 ref.mAs에서 CAREkV off 대비 CAREkV의 strength가 증가할수록 DLP 감소율은 증가하였다(Table 3).
Table 3. DLP decreased when ref.mAs decreased and strength of CAREkV was increased
Reference mAs Strength of CAREkV Rate of change (%)-DLP
85 mAs
3 0.00
5 -8.50
7 -16.99
11 -45.10
60 mAs
3 0.00
5 -8.37
7 -18.60
11 -44.19
35 mAs
3 -1.57
5 -10.24
7 -19.69
11 -43.31
10 mAs
3 -24.07
5 -29.63
7 -30.37
11 -31.48
3) Strength 3 기준 reference mAs 변화에 따른 피폭선량 변화 평가
Non-contrast scan 에서 최적화된 CNR을 보이는 CAREkV strength3 에서 ref.mAs가 감소할수록 DLP 감소율은 증가하 였다(Fig. 12).
Fig. 12. DLP's rate of change increased when ref.mAs is lower
3. SAFIRE
120 kV, 40 mAs SAFIRE 미적용 시와 25 mAs 적용 시 유사 한 노이즈 level과 패턴을 보였으며(Fig. 13) SAFIRE 적용 시 미적용 대비 mean mAs 37.5%, CTDIvol 38.1%, DLP 38% 감 소하였으며 15 mAs가 감소되었음에도 불구하고 mean SD 는 2.2% 감소하였다(Table 4).
Fig. 13. Both of test(SAFIRE on and off) shows similar noise level in spite of decreasing 15 mAs
Table 4. When applied SAFIRE, mean mAs, CTDIvol, DLP and mean SD decreased
SAFIRE setting Mean mAs
CTDIvol (mGy)
DLP (mGycm)
Mean SD
SAFIRE OFF 40.00 2.89 324 23.49
SAFIRE ON 25.00 1.79 201 22.96
Rate of change(%) -37.50 -38.10 -38.00 -2.20
4. AEC, CAREkV, SAFIRE 조합
1) Torso phantom을 이용한 3가지 방법 조합에 따른 mAs 변화, 피폭선량, 노이즈 level 평가
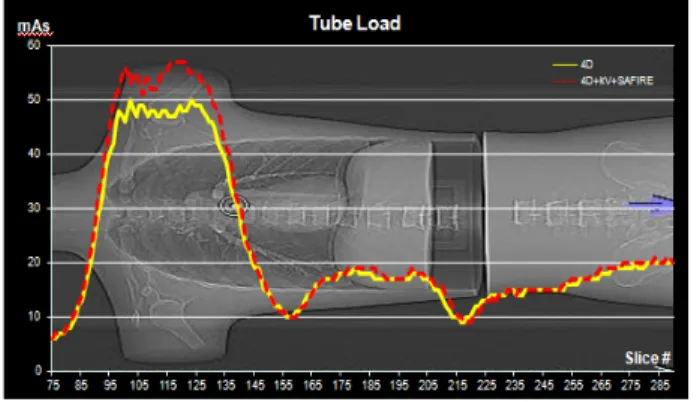
CAREkV 적용 시 low kV 적용에 대한 영상의 질 보상을 위 한 automatic mAs 증가를 위하여 AEC가 함께 적용되어야 한 다. 이를 고려할 때, 120 kV, 40 mAs AEC 적용 시와 120 kV, 25 mAs AEC, CAREkV, SAFIRE 조합의 적용 시 3가지 방법 의 조합에서 100 kV 조사에 따른 영상의 질 보상을 위하여 mAs 가 증가하였지만 SAFIRE 적용에 따른 영상의 질 향상 을 고려하여 15 mAs 를 감소시켜 조사하였음에도 불구하고 AEC 만 적용 시와 3가지 방법의 조합 시 유사한 tube load와 pattern 을 나타내었으며 shoulder 부분에서는 세 가지 조합에 서의 tube load가 증가하였다.(Fig. 14) 노이즈 level 평가에서 는 3가지 방법의 조합에서 AEC만 적용 시와 유사한 노이즈 level 과 패턴을 보였다.(Fig. 15) 3가지 방법의 조합 적용 시 AEC 만 적용 시 대비 kV 16.7% 감소, mean mAs 5.3% 증가, CTDIvol 37.1% 감소, DLP 36.9% 감소하였으며 mean SD는 6.7% 증가하였다(Table 5).
Fig. 14. Both of test(only AEC on and combination of 3 methods) shows similar tube load except for shoulder region
Fig. 15. Both of test(only AEC on and combination of 3 methods) shows similar noise level and pattern
Table 5. When applied combination of 3 methods, kV, CTDIvol and DLP decreased but mean mAs and mean SD increased
Methods setting kV Mean mAs
CTDIvol (mGy)
DLP (mGycm)
Mean SD
SAFIRE OFF 120 19 1.43 160 30.69
SAFIRE ON 100 20 0.90 101 32.73
Rate of change(%) -16.70 5.30 -37.10 -36.90 6.70
(2) AAPM CT performance phantom을 이용한 3가지 방법 조합에 따른 노이즈, 공간 분해능 평가
노이즈 평가 실험에서 SD는 120 kV, 40 mAs AEC 적용 시 와 120 kV, 25 mAs 3가지 방법의 조합에서 27.1, 25.7로 3가 지 방법의 조합에서 선량 감소에도 불구하고 SD가 낮게 측 정되어 영상의 질이 개선된 것으로 나타났다. 분해능 평가에 서는 두 가지 방법 모두에서 1.25 mm line의 구분이 가능하여 동일한 공간 분해능을 나타내었다.
5. AEC, CAREkV, SAFIRE 적용에 따른 SUV 변화 평가