을지대학교병원 핵의학과
김창현⋅이현국⋅송치옥⋅이기흔
Evaluation of Proper Image Acquisition Time by Change of Infusion dose in PET/CT
Chang Hyeon Kim, Hyun Kuk Lee, Chi Ok Song and Gi Heun Lee Department of Nuclear Medicine, Eulji University Hospital
Purpose There is the recent PET/CT scan in tendency that use low dose to reduce patient's exposure along with development of equipments. We diminished 18F-FDG dose of patient to reduce patient's exposure after setting up GE Discovery 690 PET/CT scanner (GE Healthcare, Milwaukee, USA) establishment at this hospital in 2011.
Accordingly, We evaluate acquisition time per proper bed by change of infusion dose to maintain quality of image of PET/CT scanner.
Materials and Methods We inserted Air, Teflon, hot cylinder in NEMA NU2-1994 phantom and maintained radioactivity concentration based on the ratio 4:1 of hot cylinder and back ground activity and increased hot cylinder's concentration to 3, 4.3, 5.5, 6.7 MBq/kg, after acquisition image as increase acquisition time per bed to 30 seconds, 1 minute, 1 minute 30 seconds, 2 minute, 2 minutes 30 seconds, 3 minutes, 3 minutes 30 seconds, 4 minutes, 4 minutes 30 seconds, 5 minutes, 5 minutes 30 seconds, 10 minutes, 20 minutes, and 30 minutes, ROI was set up on hot cylinder and back radioactivity region. We computated standard deviation of Signal to Noise Ratio (SNR) and BKG (Background), compared with hot cylinder's concentration and change by acquisition time per bed, after measured Standard Uptake Value maximum (SUVmax). Also, we compared each standard deviation of SUVmax, SNR, BKG following in change of inspection waiting time (15minutes and 1 hour) by using 4.3 MBq phantom.
Results The radioactive concentration per unit mass was increased to 3, 4.3, 5.5, 6.7 MBqs. And when we increased time/bed of each concentration from 1 minute 30 seconds to 30 minutes, we found that the SUVmax of hot cylinder acquisition time per bed changed seriously according to each radioactive concentration in up to 18.3 to at least 7.3 from 30 seconds to 2 minutes. On the other side, that displayed changelessly at least 5.6 in up to 8 from 2 minutes 30 seconds to 30 minutes. SNR by radioactive change per unit mass was fixed to up to 0.49 in at least 0.41 in 3 MBqs and accroding as acquisition time per bed increased, rose to up to 0.59, 0.54 in each at least 0.23, 0.39 in 4.3 MBqs and in 5.5 MBqs. It was high to up to 0.59 from 30 seconds in radioactivity concentration 6.7 MBqs, but kept fixed from 0.43 to 0.53. Standard deviation of BKG (Background) was low from 0.38 to 0.06 in 3 MBqs and from 2 minutes 30 seconds after, low from 0.38 to 0 in 4.3 MBqs and 5.5 MBqs from 1 minute 30 seconds after, low from 0.33 to 0.05 in 6.7 MBqs at all section from 30 seconds to 30 minutes. In result that was changed the inspection waiting time to 15 minutes and 1 hour by 4.3 MBq phantoms, SUVmax represented each other fixed values from 2 minutes 30 seconds of acquisition time per bed and SNR shown similar values from 1 minute 30 seconds.
Conclusion As shown in the above, when we increased radioactive concentration per unit mass by 3, 4.3, 5.5, 6.7 MBqs, the values of SUVmax and SNR was kept changelessly each other more than 2 minutes 30 seconds of acquisition time per bed. In the same way, in the change of inspection waiting time (15 minutes and 1 hour), we could find that the values of SUVmax and SNR was kept changelessly each other more than 2 minutes 30 seconds of acquisition time per bed. In the result of this NEMA NU2-1994 phantom experiment, we found that the minimum acquisition time per bed was 2 minutes 30 seconds for evaluating values of fixed SUVmax and SNR even in change of inserting radioactive concentration. However, this acquisition time can be different according to features and qualities of equipment.
Key Words NEMA NU2-1994 phantom, Standard Uptake Value maximum, SUVmax, Signal to Noise Ratio, SNR
4)
∙ Received: September 19, 2014. Accepted: October 21, 2014.
∙ Corresponding author: Chang Hyeon Kim
Department of Nuclear Medicine, Eulji University Hospital, 1306 Dunsandong, Seogu, Daejeon, 302-799, Korea
Tel: +82-42-611-3593, Fax: +82-42-259-1111 E-mail: [email protected]
서 론
최근 PET/CT검사는 장비의 발전과 더불어 환자의 피폭을
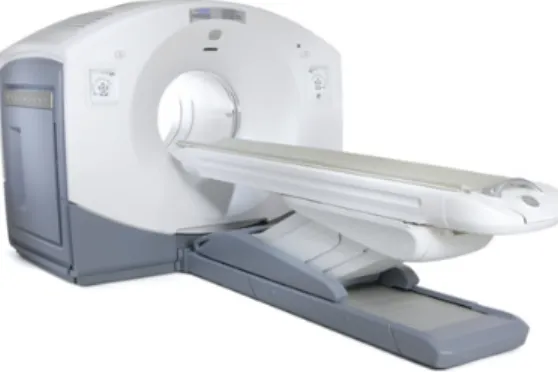
Fig. 1. GE Discovery 690 PET/CT scanner. Fig. 2. NEMA NU2-1994 PET phantom.
Table 1. Hot cylinder and background radioactivity
3 MBq/kg 4.3 MBq/kg 5.5 MBq/kg 6.7 MBq/kg Radioactive concentration per unit mass (mCi/kg) 0.083 0.116 0.15 0.18
Radioactivity of hot cylinder (MBq/kg) 0.78 1.12 1.43 1.74
Background (MBq/kg) 3.39 4.95 6.21 7.57
최소화하기 위하여 저 선량을 사용하는 추세에 있다.1,2) 본 병 원에서도 2011년 GE Discovery 690 PET/CT scanner (GE Healthcare, Milwaukee, USA) 설치 후 환자의 피폭을 줄이기 위하여 환자에게 주입하는 18F-FDG 선량을 현저하게 줄이게 되었다. 이러한 저 선량의 사용은 PET/CT 영상의 해상도와 질 을 감소시키게 되었고 이에 PET/CT scanner의 영상의 질을 유 지하기 위하여 주입선량의 변화에 따른 적정한 bed당 획득시 간을 평가하고자 한다.
실험재료 및 방법
1. 실험재료실험장비는 GE Discovery 690 PET/CT scanner (GE Healthcare, Milwaukee, USA)를 사용하였다(Fig. 1). 1 bed 당 47 slice의 영상을 획득할 수 있으며, 영상의 두께는 3.75 mm 이다. 축 방향시야는 bed 당 15.7 cm이며, 64 slice의 나선형 CT 를 사용했다.
실험모형은 NEMA NU2-1994 PET 모형을 사용하였다 (Fig. 2). 모형 내 삽입구 3개를 모두 삽입하였을 때의 체적은 4,520 mL이며 실린더 1개의 체적은 260 mL이다. 모형의 총 무 게는 7.64 kg이고 높이는 22.8 cm이다.
2. 실험방법
NEMA NU2-1994 PET 모형에서 Air, Teflon, hot cylinder 를 삽입하였고 열소(hot cylinder)와 배후방사능(Background) 의 비를 4:1의 상태로 유지하며 열소의 방사능을 3, 4.3, 5.5, 6.7 MBq/kg 으로 증가시키며 18F-FDG를 주입하였다(Table 1).
CT촬영 후 PET 영상은 Vip Mode를 Record로 설정 후 bed 당 30분의 3차원(3D) 모드로 획득하였다. 이 때 얻어진 데이터 에 적용된 재구성 프로토콜(protocol)은 matrix size 256×256, Z axis filter는 standard, Filter Cutoff 3.5 (mm), 반복횟수 (iterations) 2회와 부분 집합 수(subset) 32회이다.
첫 번째 실험은 각 방사능의 농도를 3, 4.3, 5.5, 6.7 MBq/kg 으로 변화 시키며 30분 영상을 Vip Mode로 기록한 후 이 영상 을 bed당 획득시간을 30 sec, 1 min, 1 min 30 sec, 2 min, 2 min 30 sec, 3 min, 3 min 30 sec, 4 min, 4 min 30 sec, 5 min, 5 min 30 sec 10 min, 20 min, 30 min으로 늘려가며 각 방사능의 농도 와 획득시간의 변화에 따른 재구성 영상을 만든 후 영상 면의 hot cylinder의 농도와 배후 방사능에 4개의 ROI (Region of Interest)의 최대 표준섭취계수(Standard Uptake Value maximum, SUVmax)를 측정 후 신호 대 잡음비(Signal to Noise Ratio, SNR), BKG (Background)의 표준편차를 계산하여 비 교하였다.
두 번째 실험은 4.3 MBq/kg의 농도 phantom을 이용하여 검
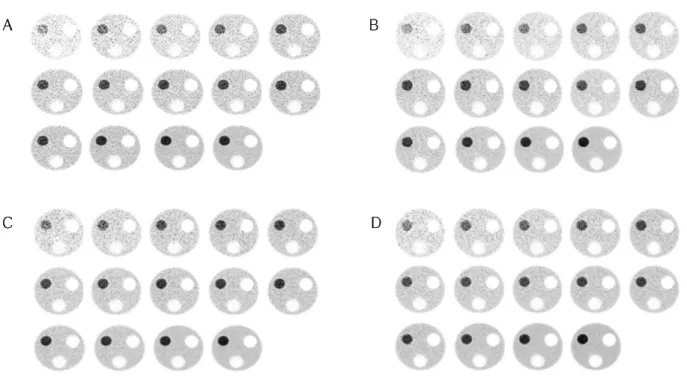
Fig. 4. Acquisition image as increase acquisition time per bed to 30 sec, 1 min, 1 min 30 sec, 2 min, 2 min 30 sec, 3 min, 3 min 30 sec, 4 min, 4 min 30 sec, 5 min, 5 min 30 sec, 10 min, 20 min, and 30 min (A : 3 MBq, B : 4.3 MBq, C : 5.5 MBq, D : 6.7 MBq).
1
2 3
Fig. 3. ROI of hot cylinder and background
사 대기시간을 15분후 검사와 1시간 후 검사를 각각 30분 Vip Mode로 기록한 후 저장하였다. 이 영상을 첫 번째 실험과 같이 bed당 획득시간을 30 sec, 1 min, 1 min 30 sec, 2 min, 2 min 30 sec, 3 min, 3 min 30 sec, 4 min, 4 min 30 sec, 5 min, 5 min 30 sec 10 min, 20 min, 30 min으로 늘려가며 각 방사능의 농도와 획득시간의 변화에 따른 재구성 영상을 만들고 각각의
SUVmax, SNR, BKG의 표준편차를 비교하였다.
Hot cylinder SUVmax -Background SUVmax
SNR =
Hot cylinder SUVmax +Background SUVmax
를 3, 4.3, 5.5, 6.7 MBq/kg 으로 증가시키고 bed당 획득시간을 30 sec, 1 min, 1 min 30 sec, 2 min, 2 min 30 sec, 3 min, 3 min 30 sec, 4 min, 4 min 30 sec, 5 min, 5 min 30 sec 10 min, 20 min, 30 min으로 늘려가며 각 방사능의 농도와 획득시간의 변화를 실험한 결과 아래와 같은 영상결과를 얻었다(Fig. 4). 이 영상 은 육안상 획득시간이 짧을수록 흐리고 균질도가 떨어지고 30 분에 가까울수록 대조도가 좋은 영상임을 확인할 수 있었다.
1. 영상의 특징적 차이
같은 시간대를 서로 비교해 본 결과 방사능의 농도가 적게 주입될수록 영상의 균질도가 떨어짐을 알 수 있었다(Fig. 5).
또한 bed당 획득시간이 짧을수록 영상의 외곽선이 불분명하 고 왜곡이 생기는 것을 알 수 있었다(Fig. 6).
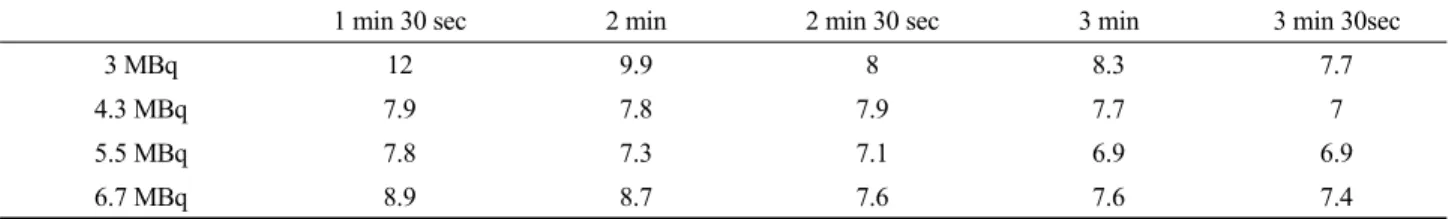
2. Bed 획득시간에 따른 SUVmax
단위 질량당 방사능의 농도를 3, 4.3, 5.5, 6.7 MBq으로 증가 시키고 또한 각 농도의 bed당 획득 시간을 30 sec 단위로 30 sec 에서 30 min 까지 늘렸을 때 hot cylinder의 SUVmax 값은 Table
A B
C D
Table 2. SUVmax according to changes in the activity concentration and the acquisition time per bed
1 min 30 sec 2 min 2 min 30 sec 3 min 3 min 30sec
3 MBq 12 9.9 8 8.3 7.7
4.3 MBq 7.9 7.8 7.9 7.7 7
5.5 MBq 7.8 7.3 7.1 6.9 6.9
6.7 MBq 8.9 8.7 7.6 7.6 7.4
Table 3. SNR due to changes in the activity concentration and the acquisition time per bed
1 min 30sec 2 min 2 min 30 sec 3 min 3 min 30sec
3 MBq 0.49 0.49 0.44 0.41 0.45
4.3 MBq 0.34 0.36 0.44 0.43 0.44
5.5 MBq 0.39 0.39 0.43 0.45 0.45
6.7 MBq 0.45 0.51 0.48 0.48 0.47
3 MBq 4.3 MBq 5.5 MBq 6.7 MBq 3 MBq 4.3 MBq 5.5 MBq 6.7 MBq Fig. 5. Image acquisition 2 min 30 sec. Fig. 6. Image acquisition 30 min.
Fig. 7. SUVmax of the hot cylinder graph according to the change of the activity concentration and the acquisition time per bed.
Fig. 8. SNR graph according to the change in the radioactivity concentration and the acquisition time per bed.
2.와 같이 측정되었다. bed당 획득시간이 각 방사능의 농도의 차이에 따라 30 sec, 1 min, 1min 30sec, 2 min 까지는 최대 18.3 에서 최소 7.3까지 변화의 폭이 컸으며 2 min 30 sec 에서 30 min까지는 최대 8에서 최소 5.6으로 서로 일정한 SUVmax 값을 나타내었다(Fig. 7).
3. Bed 획득시간에 따른 SNR
SNR은 3 MBq에서는 최소 0.41에서 최대 0.49까지 bed당 획득시간의 변화에 관계없이 일정하게 유지 되었고 4.3 MBq 과 5.5 MBq에서는 각각 최소 0.23, 0.39에서 최대 0.59, 0.54로 bed당 획득시간이 늘수록 상승하였다. 방사능 농도 6.7 MBq
에서는 30 sec에서 최대 0.59로 높았지만 이후 0.43에서 0.53 으로 일정하게 유지하였다(Fig. 8). 각 단위 질량당 방사능의 변화에 따른 SNR은 bed당 획득시간이 2 min 30 sec 이후로는 서로 일정한 값을 나타내었다.(Table 3.)
4. Bed 획득시간에 따른 BKG의 표준편차
각 농도당 배후 방사능에 4개의 ROI (Region of Interest)로 측정된 BKG (Background)의 표준편차는 3 MBq에서는 2 min 30 sec 후부터 0.38에서 0.06으로 낮아졌고 4.3 MBq과 5.5 MBq에서는 1 min 30 sec 후부터 0.38에서 0으로 낮아졌고 6.7
3 MBq 0.99 0.46 0.1 0.38
4.3 MBq 0.21 0.25 0.30 0.28
5.5 MBq 0.19 0.16 0.36 0.33
6.7 MBq 0.21 0.26 0.13 0.1
Fig. 9. BKG graph according to the change in the radioactivity concentration and the acquisition time per bed.
B
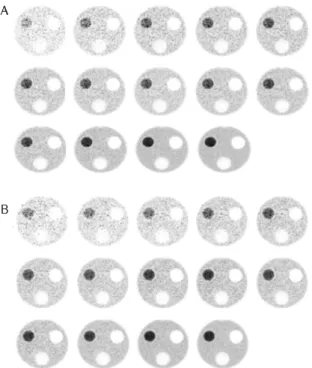
Fig. 10. 4.3 MBq phantom of 15 minutes (A) and one hour after the scan image (B).
Fig. 11. SUVmax of the phantom graph after 15 minutes and one hour 4.3 MBq
MBq에서는 30 sec 에서 30 min 전 구간에서 낮은 0.33에서 0.05이었다(Fig. 9).
5. 검사 대기시간 15분후와 1시간후의 비교
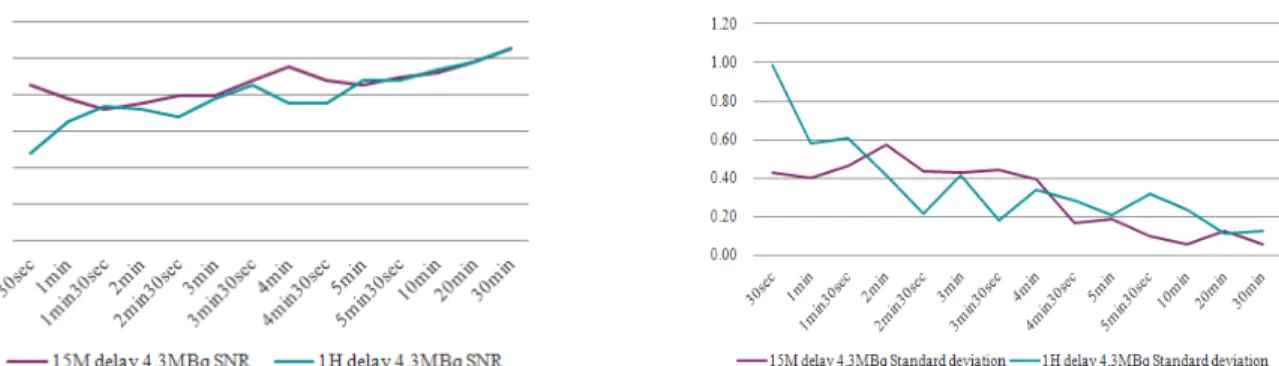
방사능 농도 4.3 MBq 팬텀으로 검사대기시간만 15분과 1 시간으로 변화시킨 결과에서는 bed당 획득시간이 2 min 30 sec부터 SUVmax값이 서로 일정한 값을 보였고(Fig. 11) SNR 과 BKG는 1 min 30 sec 부터 비슷한 값을 보였다(Fig. 12).
고 찰
팬텀을 이용한 모형 실험의 결과로 적정한 방사능의 농도와 bed당 획득시간을 알 수 있었으나 임상실험을 하지 못함으로 써 실제 검사 시 환자와 다소 차이가 있을 것으로 생각되며 팬 텀 제작 시 저 선량 측정의 어려움이 있었다.
결 론
위 실험의 결과와 같이 단위 질량당 주입된 방사능의 농도 를 3, 4.3, 5.5, 6.7 MBq으로 증가시켰을 때 bed당 획득시간이 2 min 30 sec 이상에서는 SUVmax 와 SNR의 값이 서로 일정하 게 유지되고 검사 대기시간의 변화(15분과 1시간)에서도 bed 당 획득시간이 2 min 30 sec 이상에서는 SUVmax 와 SNR의 값
이 일정하게 유지되는 것을 알 수 있었다. 이 NEMA NU2-1994 phantom 실험의 결과에서 주입되는 방사능의 농 도의 변화에도 일정한 SUVmax 와 SNR의 값을 구하기 위한 최 소 bed당 획득시간은 2 min 30 sec 라는 것을 알 수 있었다. 그 러나 이 획득시간은 장비의 사양과 특성에 따라 차이가 있을 수 있다.2,3)
요 약
PET/CT검사는 장비의 발전과 더불어 환자의 피폭을 줄이 기 위하여 저 선량을 사용하는 추세에 있다. 이에 PET/CT scanner의 영상의 질을 유지하기 위하여 주입선량의 변화에
Fig. 12. 4.3 MBq 15 minutes and one hour after the phantom SNR (A), BKG (B) graph.
따른 적정한 bed당 획득시간을 평가하고자 한다.
모형 실험은 NEMA NU2-1994 phantom으로 hot cylinder 의 농도를 3, 4.3, 5.5, 6.7 MBq/kg 으로 증가시키고 bed당 획득 시간을 30 sec, 1 min, 1 min 30 sec, 2 min, 2 min 30 sec, 3 min, 3 min 30 sec, 4 min, 4 min 30sec, 5 min, 5 min 30 sec 10 min, 20 min, 30 min로 늘려가며 영상을 획득 후 hot cylinder의 농도 와 배후 방사능에 4개의 ROI (Region of Interest)을 설정하고 hot cylinder의 농도 와 bed당 획득시간에 따른 변화를 최대 표 준섭취계수(Standard Uptake Value maximum, SUVmax)를 측 정 후 신호 대 잡음비(Signal to Noise Ratio, SNR), BKG (Background)의 표준편차를 계산하여 비교해 보았다. 또한 4.3 MBq phantom을 이용하여 검사 대기시간의 변화(15분과 1시간)에 따른 각각의 SUVmax, SNR, BKG의 표준편차를 비교 하였다.
단위 질량당 방사능의 농도가 3, 4.3, 5.5, 6.7 MBq으로 증가 하고 또한 각 농도의 time/bed을 1분30초에서 30분까지 늘렸 을 때 hot cylinder의 SUVmax 값은 bed당 획득시간이 각 방사능 의 농도에 따라 30초에서 2분까지는 최대 18.3에서 최소 7.3까 지 변화가 심했고 2분 30초에서 30분까지는 최대 8에서 최소 5.6으로 일정한 SUVmax 값을 나타내었다. 단위 질량당 방사능 의 변화에 따른 SNR은 3 MBq에서는 최소 0.41에서 최대 0.49 까지 일정하였고 4.3 MBq과 5.5 MBq에서는 각각 최소 0.23, 0.39에서 최대 0.59, 0.54로 bed당 획득시간이 늘수록 상승하 였다. 방사능 농도 6.7 MBq에서는 30초에서 최대 0.59로 높았 지만 이후 0.43에서 0.53으로 일정하게 유지하였다. BKG (Background)의 표준편차는 3 MBq에서 2분 30초 후부터 0.38 에서 0.06으로 낮아졌고 4.3 MBq과 5.5 MBq에서는 1분 30초
후부터 0.38에서 0으로 낮아졌고 6.7 MBq에서는 30초에서 30 분 전 구간에서 낮은 0.33에서 0.05이었다. 4.3 MBq 팬텀으로 검사대기시간을 15분과 1시간으로 변화시킨 결과에서는 bed 당 획득시간이 2분 30초부터 SUVmax값이 서로 일정한 값을 보 였고 SNR은 1분 30초부터 비슷한 값을 보였다.
위 결과와 같이 단위 질량당 주입된 방사능의 농도를 3, 4.3, 5.5, 6.7 MBq으로 증가시켰을 때 bed당 획득시간이 2분 30초 이상에서는 SUVmax 와 SNR의 값이 서로 일정하게 유지되고 검사 대기시간의 변화(15분과 1시간)에서도 bed당 획득시간 이 2분 30초 이상에서는 SUVmax 와 SNR의 값이 일정하게 유 지되는 것을 알 수 있었다. 이 NEMA NU2-1994 phantom 실험 의 결과에서 주입되는 방사능의 농도의 변화에도 일정한 SUVmax 와 SNR의 값을 구하기 위한 최소 bed당 획득시간은 2 분 30초이라는 것을 알 수 있었다. 하지만 이 획득시간은 장비 의 사양과 특성에 따라 차이가 있을 수 있다.
REFERENCES
1. 문일상, 이홍재, 김진의, 김현주. TOF 기법을 이용한 PET/CT 검사에서 적정 스캔시간에 대한 정량적 평가. 대한핵의학기술 학회지 2011;15:161.
2. 문아름, 이 혁, 곽인석, 최성욱, 석재동. PET/CT 검사에서 영상 의 질을 유지하기 위한 적정한 18F-FDG 투여량의 평가. 대한핵 의학기술학회지 2011;15:36-39.
3. Kim JS, Lee JS, Lee BI, Lee DS, Chun JK, Lee MC.
Performance Characteristics of 3D GSO PET/CT Scanner (Philips GEMINI PET/CT). Korean J Med 2004;38(4):
318-324.
4. 고창순 외. 제3판 핵의학. 고려의학. 2008.