Fire Sci. Eng., Vol. 31, No. 5, pp. 1-6, 2017 DOI: https://doi.org/10.7731/KIFSE.2017.31.5.001
ISSN : 2508-6804 (Online) ISSN : 1738-7167 (Print)
n-Pentanol과 p-Xylene 혼합물의 최소자연발화온도와 발화지연시간의 측정 및 예측
하동명
세명대학교 보건안전공학과
Measurement and Prediction of Autoignition Temperature (AIT) and Ignition Delay Time of n-Pentanol and p-Xylene Mixture
Dong-Myeong Ha
Department of Occupational Health and Safety Engineering, Semyung University (Received September 5, 2017; Revised September 28, 2017; Accepted October 1, 2017)
요 약
가연성물질의 화재 및 폭발 특성치는 안전한 취급, 저장, 수송, 처리 및 폐기하는데 반드시 필요하다. 공정 안전을 위한 대표적인 연소특성치로 최소자연발화온도(AIT)를 들 수 있다. 최소자연발화온도는 가연성 액체의 안전한 취급 을 위해서 중요한 지표가 된다. 최소자연발화온도는 가연성물질이 주위의 열에 의해 스스로 발화하는 최저온도이 다. 본 연구에서는 ASTM E659 장치를 이용하여 가연성 혼합물인 n-Pentanol과 p-Xylene 혼합물의 최소자연발화온 도와 발화지연시간을 측정하였다. 2성분계를 구성하는 순수물질인 n-Pentanol과 p-Xylene의 최소자연발화온도는 각 각 285 ℃, 557 ℃로 측정되었다. 그리고 측정된 n-Pentanol과 p-Xylene 혼합물의 최소자연발화온도와 AIT에서의 발 화지연시간의 실험값은 제시된 식에 의한 계산값과 적은 평균절대오차에서 일치하였다. 따라서 본 연구에서 제시 한 예측식들을 이용하여 n-Pentanol과 p-Xylene 혼합물의 다른 조성에서도 최소자연발화온도와 발화지연시간을 예측 이 가능하다.
ABSTRACT
The fire and explosion properties of combustible materials are necessary for the safe handling, storage, transportation and disposal. Typical combustion characteristics for process safety include auto ignition temperature(AIT). The AIT is an important index for the safe handling of combustible liquids. The AIT is the lowest temperature at which the material will spontaneously ignite. In this study, the AITs and ignition delay times of n-pentanol and p-xylene mixture were measured by using ASTM E659 apparatus. The AITs of n-pentanol and p-xylene which constituted binary system were 285 ℃ and 557 ℃, respectively.
The experimental AITs and ignition delay times of n-pentanol and p-xylene mixture were a good agreement with the calculated AITs and ignition delay times by the proposed equations with a few A.A.D. (average absolute deviation). Therefore, it is possible to estimate the AITs and ignition delay times in other compositions of n-pentanol and p-xylene mixture by using the predictive equations which presented in this study.
Keywords : Fire and Explosion Properties, AIT (Autoignition temperature), Ignition Delay Time, ASTM E659, n-Pentanol and p-Xylene Mixture
1 1)
1. 서 론
화학 사고를 보면 화학 및 반도체 산업을 비롯해 대학의 실험실 등에서 사용하는 물질에 대한 정확한 화재 및 폭발 특성치를 파악하지 못해서 재해가 발생되는 경우가 허다하 다. 따라서 산업현장에서 취급하는 가연성물질들의 정확한 연소특성치를 적용하는 하는 것은 사고 예방에서 가장 중
요한 부분이다. 가연성물질의 대표적인 연소특성으로 최소 자연발화온도(autoignition temperature, AIT)를 들 수 있다.(1,2) 연소이론에서 자연발화는 인화성액체가 높은 온도에서 증기로 발생되고 이 증기가 주위 공기와 혼합되어 주위에 열에너지가 주어졌을 때 스스로 타는 산화 현상이다. AIT 는 자연발화 가운데 스스로 점화할 수 있는 액체의 최저온 도로서, 동일한 물질에서도 실험조건에 따라 측정값이 달
Corresponding Author, E-Mail: [email protected], TEL: +82-43-649-1321, FAX: +82-43-649-1777
ⓒ 2017 Korean Institute of Fire Science & Engineering. All right reserved.
[Research Paper]
n-Pentanol과 p-Xylene 혼합물의 최소자연발화온도와 발화지연시간의 측정 및 예측
Fire Sci. Eng., Vol. 31, No. 5, 2017 3
(5)
(6)
2.4 혼합 조성에 의한 발화지연 시간의 관계
본 연구에서 얻은 측정값을 분석한 결과, 혼합 조성에서 AIT의 발화지연시간(ignition delay)은 서로 상관관계가 있 음을 알 수 있어, 조성 변화에 의한 발화지연시간을 예측 할 수 있는 모델 역시 다음과 같이 제시하였다.
or (7)
(8)
2.5 실험값과 계산값의 비교
AIT와 발화지연시간의 최적화 모델을 찾기 위해서 절대 평균오차(A.A.D.)와 결정계수(r2)를 사용하였다.(5,7,15,16)
∑
exp
(9) ∑
exp
(10)
(11)여기서 AITest.는 예측된 최소자연발화온도, AITexp.는 실 험의 최소자연발화온도, τest.는 예측된 발화지연시간, τexp.
는 실험의 발화지연시간이다. N은 자료수, 은 결정계수, SSR은 회귀에 의한 제곱합(sum of squares due to regression) 그리고 SST는 SSR과 잔차에 의한 제곱합(sum of squares due to residual error)의 합이다.(7,15)
3. 최소자연발화온도 실험 재료 및 방법
3.1 실험 재료
본 실험에 사용된 시약 가운데 n-Pentanol은 Acros (USA), p-Xylene은 Lancaster (USA)로서 각 각 순도는 99%이며, 5 개의 혼합 조성의 AIT를 측정하기 위해 각 순수물질을 다 른 몰비(mole fraction)로 혼합하여 시료로 사용하였다.
3.2 장치 및 측정 방법
n-Pentanol과 p-Xylene 계의 AIT뿐만 아니라 발화지연시 간에 의한 자연발화온도를 측정하기 위해서 ASTM E659 (Koehler 사)를 사용하였다. 본 장치는 온도조절기, 열전대, 플라스크, 거울 등으로 구성되어 있다. 실험방법은 혼합물 을 구성하는 물질들 가운데 가장 낮은 물질의 AIT를 근거 로 하였다.
설정 온도에 도달하면 플라스크 내부에 주사기로 시료
를 0.1 ml를 넣는다. 10분 동안 관찰 후 발화가 일어나지 않 으면 다시 온도를 설정하고 시료를 넣은 후 10분 내에 발 화가 일어나면, 측정된 발화온도 보다 30 ℃ 낮게 설정하 고, 1∼2 ℃씩 증가시키면서 AIT를 찾은 후 이를 근거로 5
∼10 ℃씩 증가시켜 발화온도와 시간을 기록한다.(6,7)
4. 결과 및 고찰
4.1 순수물질의 최소자연발화온도 4.1.1 n-Pentanol의 최소자연발화온도
n-Pentanol의 AIT는 대부분의 문헌에서 300 ℃로 제시되 고 있어 이를 근거로 하여 250 ℃에서 실험한 결과 비발화 되어 다시 30 ℃ 상승시켜 280 ℃에서 실험한 결과 역시 비 발화되었다. 다시 30 ℃ 상승시켜 310 ℃에서 측정한 결과 33.77 s에서 발화가 되어 온도를 1∼2 ℃ 계속 낮추어서 실 험한 결과 285 ℃, 187.95s에서 AIT를 찾았다.(9)발화지연시 간과 발화온도의 관계는 다음과 같이 최적화 되었다.
log
(12)
4.1.2 p-Xylene의 최소자연발화온도
본 실험에서는 p-Xylene의 AIT를 측정하기 위해 기존 문 헌들에 제시된 Xylene 이성질체의 AIT를 근거로 550 ℃에 서 실험한 결과 비발화되어, 다시 30 ℃상승시킨 580 ℃에 서 실험한 결과 20.99 s에서 발화되었다. AIT를 찾기 위해 20 ℃ 낮춘 560 ℃에서 측정하였을 때 29.86 s에서 발화되어 5 ℃도 낮춘 555 ℃에서 실험을 하였으나 비발화되어 1∼2
℃상승시킨 결과 557 ℃, 33.57 s에서 AIT를 찾았다.(10)발화 지연시간과 발화온도의 관계는 다음과 같이 최적화 되었다.
log
(13)
4.2 n-Pentanol과 p-Xylene 계의 자연발화온도와 발화 지연시간
4.2.1 n-Pentanol (0.9)+p-Xylene (0.1) 계의 자연발화온도 와 발화지연시간
실험에서 얻은 n-Pentanol의 AIT 285 ℃를 근거로(9) 250
℃에서 실험한 결과 비발화가 되어, 30 ℃ 상승시킨 280 ℃ 에서도 비발화되었다. 다시 30 ℃ 올린 310 ℃에서 실험한 결과 21.65 s에서 발화되어 10 ℃ 내린 300 ℃에서는 34.00 s에서 발화되었다. 다시 1∼2 ℃ 낮추면서 실험한 결과 295
℃, 37.88 s에서 AIT를 찾았다. AIT 295 ℃를 기준으로 5 ℃ 혹은 10 ℃씩 상승시켜 발화온도를 측정한 결과, 320 ℃에 서는 13.83 s, 330 ℃에서는 8.34 s, 350 ℃에서는 5.28 s, 360
Mole Fractions AITs (℃)
X1 X2 Exp. Eqn. (14) Eqn. (15) Eqn. (16)
1 0 285 286 293 285
0.9 0.1 295 288 283 296
0.7 0.3 306 308 299 300
0.5 0.5 326 353 353 340
0.3 0.7 446 421 431 433
0.1 0.9 520 514 519 532
0 1 557 569 561 552
A.A.D. - 11.79 11.41 7.82
Table 1. Experimental and Predicted AITs of n-Pentanol and p-Xylene System
℃에서는 4.37 s, 370 ℃에서는 3.03 s, 380 ℃에서는 2.82 s, 390 ℃에서는 2.19 s, 400 ℃에서는 2.00 s, 그리고 410 ℃에 서는 1.53 s에 발화하였다.
4.2.2 n-Pentanol (0.7)+p-Xylene (0.3) 계의 자연발화온도 와 발화지연시간
n-Pentanol (0.9)+p-Xylene (0.1) 계의 AIT 295 ℃를 근거 로, 290 ℃에서 실험한 결과 비발화되어, 10 ℃ 상승시킨 300 ℃에서도 비발화되었다. 다시 1∼2 ℃ 씩 상승시켜 실 험한 결과 306 ℃, 22.59 s에서 AIT를 찾았다. AIT 306 ℃를 기준으로 5 ℃ 혹은 10 ℃씩 상승시켜 발화온도를 측정한 결과, 310 ℃에서는 13.31 s, 320 ℃에서는 10.09 s, 330 ℃에 서는 8.49 s, 340 ℃에서는 7.91 s, 350 ℃에서는 5.93 s, 360
℃에서는 5.11 s, 370 ℃에서는 4.27 s, 380 ℃에서는 3.10 s, 390 ℃에서는 2.92 s, 400 ℃에서는 2.10 s 그리고 410 ℃에 서는 1.62 s에 발화하였다.
4.2.3 n-Pentanol (0.5)+p-Xylene (0.5) 계의 자연발화온도 와 발화지연시간
n-Pentanol (0.7)+p-Xylene (0.3) 계의 AIT 306 ℃를 근거 로, 310 ℃에서 실험한 결과 비발화되어, 10 ℃ 상승시킨 320 ℃에서도 비발화되었다. 다시 10 ℃ 상승시킨 330 ℃에 서는 13.11 s에 발화되어 1∼2 ℃ 씩 나추어서 실험한 결과 326 ℃, 15.84 s에서 AIT를 찾았다. AIT 326 ℃를 기준으로 5 ℃ 혹은 10 ℃씩 상승시켜 발화온도를 측정한 결과, 340
℃에서는 9.78 s, 350 ℃에서는 8.06 s, 360 ℃에서는 7.21 s, 370 ℃에서는 5.94 s, 380 ℃에서는 5.62 s, 390 ℃에서는 4.88 s, 400 ℃에서는 4.52 s, 420 ℃에서는 4.00 s, 440 ℃에 서는 3.19 s, 460 ℃에서는 2.75 s, 480 ℃에서는 2.53 s, 500
℃에서는 2.28 s 그리고 510 ℃에서는 1.62 s에 발화하였다.
4.2.4 n-Pentanol(0.3)+p-Xylene(0.7) 계의 자연발화온도와 발화지연시간
n-Pentanol(0.5)+p-Xylene(0.5) 계의 AIT 326 ℃를 근거로, 330 ℃에서 실험한 결과 비발화되어, 30 ℃ 상승시킨 360
℃에서도 비발화되었다. 다시 30 ℃ 상승시킨 390 ℃에서 도 비발화되어 계속 30 ℃ 상승시킨 결과 450 ℃에서 19.47
s에서 발화되어 1∼2 ℃ 씩 낮추어서 실험한 결과 446 ℃, 24.94 s에서 AIT를 찾았다. AIT 446 ℃를 기준으로 5 ℃ 혹 은 10 ℃씩 상승시켜 발화온도를 측정한 결과, 460 ℃에서 는 19.32 s, 470 ℃에서는 13.34 s, 480 ℃에서는 10.81 s, 490
℃에서는 8.22 s, 500 ℃에서는 7.11 s, 510 ℃에서는 4.94 s, 520 ℃에서는 4.12 s, 530 ℃에서는 3.38 s, 540 ℃에서는 2.74 s, 550 ℃에서는 2.18 s 그리고 560 ℃에서는 1.88 s에 발화하였다
4.2.5 n-Pentanol(0.1)+p-Xylene(0.9) 계의 자연발화온도와 발화지연시간
n-Pentanol(0.3)+p-Xylene(0.7) 계의 AIT 446 ℃를 근거로, 450 ℃에서 실험한 결과 비발화되어, 30 ℃ 상승시킨 480
℃에서도 비발화되었다. 다시 30 ℃ 상승시킨 510℃에서도 역시 비발화되어 다시 5 ℃ 상승시켜 실험하였으나 비발화 되었다. 1∼2 ℃ 씩 상승시켜 실험한 결과 520 ℃, 34.19 s 에서 AIT를 찾았다. AIT 520 ℃를 기준으로 5 ℃ 혹은 10
℃씩 상승시켜 발화온도를 측정한 결과, 540 ℃에서는 17.47 s, 560 ℃에서는 11.62 s, 580 ℃에서는 7.76 s, 600 ℃ 에서는 4.97 s, 620 ℃에서는 2.23 s 그리고 630 ℃에서는 1.73 s에 발화하였다
4.2.6 n-Pentanol과 p-Xylene 계의 AIT 예측
본 연구에서 얻은 혼합조성에서의 AIT를 고찰한 결과 p-Xylene의 조성이 클수록 AIT가 증가하는 경향을 나타내 고 있다. 따라서 n-Pentanol과 p-Xylene 계의 혼합 조성에 의한 AIT를 예측이 가능할 것으로 판단되어 앞서 제시한 식 (4)와 (6)의 모델을 회귀분석에 의해 최적화한 결과 다 음과 같은 예측식을 얻었다.
(14)
(15)
(16)
여기서 X1은 p-Xylene이다.
n-Pentanol과 p-Xylene 혼합물의 최소자연발화온도와 발화지연시간의 측정 및 예측
Fire Sci. Eng., Vol. 31, No. 5, 2017 5
Figure 1. Comparison of AIT prediction curves with experimental data for n-pentanol and p-xylene system.
Figure 2. Comparison between experimental and calculated ignition delay of n-pentanol and p-xylene system.
Mole Fractions Ignition Delay {s}
X1 X2 Exp. Eqn. (17) Eqn. (18)
1 0 - - -
0.9 0.1 37.88 37.37 38.02
0.7 0.3 22.59 22.95 21.23
0.5 0.5 15.84 17.81 17.81
0.3 0.7 24.94 21.95 23.62
0.1 0.9 34.19 35.34 34.52
0 1 - - -
A.A.D. - 1.40 1.05
Table 2. Experimental and Predicted Ignition Delay of n-Pentanol and p-Xylene System
n-Pentanol과 p-Xylene 계의 순수물질과 5개의 조성에서 얻 은 AIT의 실험값과 예측 모델에 의한 계산값을 비교하여 Ta ble 1과 Figure 1 나타내었다. 본 연구에서 제시한 식 (16)에 의한 실험값과 예측값의 평균오차는 7.82 s, 결정계수(r2)는 0.99로써 모사성이 크게 나타났다. 따라서 본 연구에서 제시 한 식을 이용하여 다른 조성에서의 AIT 예측도 가능해졌다.
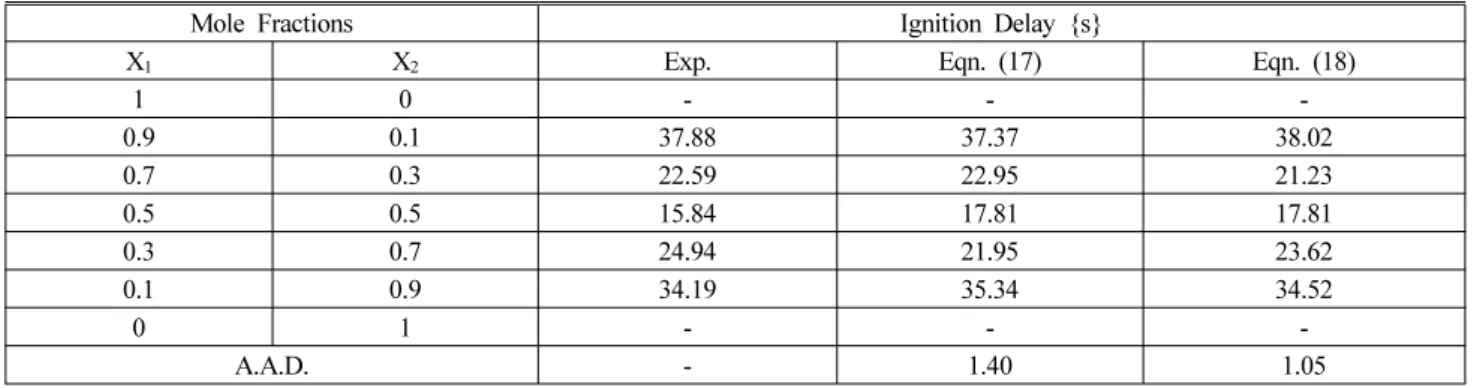
4.2.7 n-Pentanol과 p-Xylene 계의 조성과 발화지연시간의 관계
본 연구에서 얻은 혼합조성과 발화지연시간의 관계를 살 펴보기 위해 Plotting을 한 결과 조성과 발화지연시간의 상관 관계가 있음을 확인하였다. 따라서 n-Pentanol과 p-Xylene 계 의 혼합 조성에 의한 발화지연시간의 예측이 가능할 것으 로 판단되어 앞서 제시한 식 (7)와 (8)을 회귀분석한 결과 다음과 같은 예측식을 얻었다.
(17)
(18)
n-Pentanol과 p-Xylene 계 5개의 조성에서 AIT의 발화지
연시간의 실험값과 예측 모델에 의한 계산값을 Table 2와 Figure 2에 나타내었다. 본 연구에서 제시한 식 (18)에 의한 실험값과 예측값의 평균오차는 1.05 s, 결정계수(r2)는 0.98 로써 모사성이 크게 보이므로 식(18)을 이용하여 조성 0.1 과 0.9 사이에서의 다른 조성에서도 발화지연시간의 예측 이 가능하다.
5. 결 론
본 연구는 자연발화온도 측정 장치(ASTM E659)를 사용 하여 n-Pentanol과 p-Xylene 가연성혼합물의 자연발화온도 와 발화지연시간 그리고 최소자연발화온도(AIT)를 측정하 였다. n-Pentanol과 p-Xylene 계를 구성하는 순수물질의 AIT 는 기존 측정값을 활용하였고,(9,10) n-Pentanol과 p-Xylene 계 5개의 조성에서 AIT를 측정하였다. 또한 측정된 혼합물의 다른 조성에서도 AIT과 AIT에서의 발화지연시간(Ignition Delay)을 예측할 수 있는 모델을 제시하였다.
1) 이성분계를 구성하는 순수물질인 n-Pentanol과 p-Xylene 의 AIT는 각각 285 ℃와 557 ℃로 측정되었다.
2) n-Pentanol과 p-Xylene 계의 5개 조성에서 측정된 AIT는 n-Pentanol(0.9))+p-Xylene(0.1) 계에서는 295 ℃, n-Pentanol(0.7))
+p-Xylene(0.3) 계에서는 306 ℃, n-Pentanol(0.5))+p-Xylene (0.5) 계에서는 326 ℃, n-Pentanol(0.3))+ p-Xylene(0.7) 계에 서는 446 ℃ 그리고 n-Pentanol(0.1))+p-Xylene(0.1) 계에서는 520 ℃로 측정되었다.
3) n-Pentanol과 p-Xylene 계의 조성변화에 의한 AIT의 예측식은 다음과 같다.
여기서 X1은 p-Xylene이다.
4) n-Pentanol과 p-Xylene 계의 조성변화에 의한 발화지 연시간의 예측식은 다음과 같다.
여기서 X1은 p-Xylene이다.
6) 본 연구에서 제시한 자료와 예측식은 n-Pentanol과 p-Xylene 계를 취급하는 공정에서 중요한 안전 자료로 활 용될 수 있다.
References
1. V. Babrauskas, “Ignition Handbook”, Fire Science Publishers, SFPE (2003).
2. F. P. Lees, “Loss Prevention in the Process Industries Vol.
1”, 2nd ed., Oxford Butterworth-Heinemann (1996).
3. C. J. Hilado and S. W. Clark, “Discrepancies and Correlation of Reported Autoignition Temperature”, Fire Technology, Vol. 8, No. 3, pp. 218-227 (1972).
4. C. C. Chen and Y. C. Hsieh, “Effect of Experimental Conditions on Measuring Autoignition Temperature of liquid Chemicals”, Ind. Eng. Chem. Res., Vol. 49, No. 12, pp.
5925-5932 (2010).
5. S. Peper, R. Dohrnand and K. Konejung, “Methods for the Prediction of Thermodynamics Properties of Polyurethane Raw Materials Mixture”, Fluid Phase Equilibria, Vol. 424, pp. 137-151 (2016).
6. D. M. Ha, “Measurement and Prediction of Autoignition Temperature n-Butanol+p-Xylene Mixture”, Journal of the
Korean Institute of Gas, Vol. 20, No. 5, pp. 1-8 (2016).
7. D. M. Ha, “Measurement and Prediction of Autoignition Temperature(AIT) n-Propanol and Acetic acid System”, Journal of the Korean Society of Safety, 32, No. 2, pp.
66-71 (2017).
8. J. Zhang, S. Niu, Y. Zhang, C. Tang, X. Jiang, E. Hu and Z. Huang, “Experimental and Modeling Study of Auto- ignition of n-Heptane/n-Butanol Mixtures”, Combustion and Flame, Vol. 160, pp. 31-39 (2013).
9. D. M. Ha and S. J. Lee, “Measurement of Autoignition Temperature of o-Xylene+n-Pentanol System”, Journal of the Korean Society of Safety, Vol. 21, No. 4, pp. 66-72 (2006).
10. D. M. Ha, “Measurement and Prediction of Autoignition Temperature (AIT) n-Hexanoll+p-Xylene Mixture”, Journal of Energy Engineerig, Vol. 25, No. 1, pp. 48-55 (2016).
11. I. Goldfrab and A. Zinoviev, “A Study of Delay Spontaneous Insulation Fires”, Physics Letters A, Vol. 311, No. 6, pp. 491-500 (2003).
12. C. J. Hilado and S. W. Clark, “Autoignition Temperature of Organic Chemicals”, Chemical Engineering, Vol. 79, No.
19, pp. 75-80 (1972).
13. N. N. Semenov, “Some Problems in Chemical Kinetics and Reactivity, Vol. 2”, Princeton University Press, Princeton, N.J. (1959).
14. G. E. P. Box. and N. R. Draper, “Empirical Model-Building and Response Surface”, John Wiley and Sons, Inc. (1987).
15. J. V. Beck and K. J. Arnold, “Parameter Estimation in engineering and Science”, John Wiley and Sons, Inc.
(1977).
16. S. J. Cho, J. S. Shin, S. H. Choi, E. S. Lee and S. J. Park,
“Optimization Study for Pressure Swing Distillation Process for the Mixture of Isobutyl-Acetate and Isobutyl-Alcohol System”, Korean Chemical Engineering Research, Vol. 52, No. 3, pp. 307-313 (2014).