Feasibility of Spin-Echo Echo-Planar Imaging MR Elastography in Livers of Children and Young Adults
This is an Open Access article distributed under the terms of the Creative Commons Attribution Non-Commercial License (http://creativecommons.org/licenses/
by-nc/4.0/) which permits unrestricted non-commercial use, distribution, and reproduction in any medium, provided the original work is properly cited.
Received: June 11, 2019 Revised: June 27, 2019 Accepted: July 9, 2019 Correspondence to:
Hyun Joo Shin, M.D., Ph.D.
Department of Radiology and Research Institute of Radiological Science, Severance Children’s Hospital, Yonsei University College of Medicine, 50-1 Yonsei- ro, Seodaemun-gu, Seoul 03722, Korea.
Tel. +82-2-2228-7400 Fax. +82-2-2227-8337 E-mail: [email protected]
Copyright © 2019 Korean Society of Magnetic Resonance in Medicine (KSMRM)
Original Article
Purpose: To assess the feasibility of the use of spin-echo echo-planar imaging (SE-EPI) magnetic resonance elastography (MRE) in livers of children and young adults.
Materials and Methods: Patients (≤ 20 years old) who underwent 3T SE-EPI MRE were included retrospectively. Subjects were divided into three groups according to the purpose of the liver MRI: suspicion of fatty liver or focal fat deposition in the liver (FAT group), liver fibrosis after receiving a Kasai operation from biliary atresia (BA group), and hepatic iron deposition after receiving chemotherapy or transfusions (IRON group). Technical failure of MRE was defined when a stiffness map showed no pixel value with a confidence index higher than 95%, and the patients were divided as success and failure groups accordingly. Clinical findings including age, gender, weight, height, and body mass index and magnetic resonance imaging results including proton density fat fraction (PDFF), T2*, and MRE values were assessed.
Factors affecting failure of MRE were evaluated and the image quality in wave propagation image and stiffness map was evaluated using the appropriate scores.
Results: Among total 240 patients (median 15 years, 211 patients in the FAT, 21 patients in the BA, and 8 patients in the IRON groups), technical failure was noted in six patients in the IRON group (6/8 patients, 75%), while there were no failures noted in the FAT and BA groups. These six patients had T2* values ranging from 0.9 to 3.8 ms. The image quality scores were not significantly different between the FAT and BA groups (P > 0.999), while the scores were significantly lower in the IRON group (P <
0.001).
Conclusion: The 3T SE-EPI MRE in children and young adults had a high technical success rate. The technical failure was occurred in children with decreased T2* value (≤
3.8 ms) from iron deposition.
Keywords: Child; Young adult; Liver; Magnetic resonance imaging; Elasticity imaging techniques
Jin Kyem Kim1, Haesung Yoon1,5, Mi-Jung Lee1,5, Myung-Joon Kim1,5,
Kyunghwa Han2, Hong Koh3,5, Seung Kim3,5, Seok Joo Han4,5, Hyun Joo Shin1,5
1Department of Radiology and Research Institute of Radiological Science, Yonsei University College of Medicine, Seoul, Korea
2Department of Radiology, Research Institute of Radiological Science, Center for Clinical Imaging Data Science, Yonsei University College of Medicine, Seoul, Korea
3Department of Pediatric Gastroenterology, Hepatology and Nutrition, Yonsei University College of Medicine, Seoul, Korea
4Department of Pediatric Surgery, Yonsei University College of Medicine, Seoul, Korea
5Severance Pediatric Liver Disease Research Group, Yonsei University College of Medicine, Seoul, Korea
INTRODUCTION
Pediatric liver diseases including congenital, inflammatory, and metabolic diseases, if left untreated, can progress to hepatic fibrosis and eventually liver cirrhosis in the patient (1, 2). However, if pediatric liver disease can be effectively treated, there is a high probability that the degree of fibrosis can be minimized and possibly reversed (3, 4).
Therefore, early diagnosis and monitoring of hepatic fibrosis are important in pediatric populations to improve beneficial patient outcomes.
Generally, a liver biopsy is considered the gold standard for diagnosing hepatic fibrosis. However, the use of liver biopsy has several disadvantages, including invasiveness, sampling errors, inter- or intra-observer variability, and the need for sedation in children (5, 6). For this reason, non-invasive imaging techniques such as ultrasound elastography and magnetic resonance elastography (MRE) are available to assess hepatic fibrosis quantitatively (7). The use of a MRE offers results from larger areas with superior repeatability and reproducibility (8, 9). This technique was approved by the U.S. Food and Drug Administration, and is considered an accurate method of evaluating hepatic fibrosis (7).
For imaging the propagating shear waves while applying mechanical stress in MRE, several sequences have been introduced, including gradient-recalled-echo (GRE) and spin-echo echo-planar imaging (SE-EPI). Although GRE MRE was utilized first, SE-EPI MRE is known to offer faster acquisition times and can measure stiffness in larger areas and deeper portions affected by the disease (10). Recently a few studies reported performance of GRE and EPI MRE in adults (11-13). One study presented high success rates with GRE MRE in a pediatric population (14). However, no study has focused on the performance of SE-EPI MRE at 3T in a pediatric cohort and reported the factors associated with technical failure of SE-EPI MRE in children.
Therefore, the purpose of this study was to assess the feasibility of SE-EPI MRE in livers of children and young adults.
MATERIALS AND METHODS
PatientsOur Institutional Review Board approved this retrospective study and waived the requirement for informed consent.
Pediatric patients equal to or under the age of 20 years
who underwent short liver MRI with SE-EPI MRE according to clinical demands from April 2015 to November 2017 were included in this study. The subjects were divided into three groups according to the purpose of the liver MRI examination: suspicion of fatty liver or focal fat deposition in the liver (FAT group), liver fibrosis after receiving a Kasai operation from biliary atresia (BA group), and hepatic iron deposition after receiving chemotherapy or multiple transfusions (IRON group). Additionally, age (years), sex, weight (kg), height (cm), and body mass index (BMI, kg/m2) of the patients at the time of the MRI examinations were reviewed retrospectively using electronic medical records.
Acquisition of MRI and MRE
Liver MRI was performed using a 3.0T system (Discovery 750w, GE Healthcare, Milwaukee, WI, USA). Patients who needed sedation for MRI examination could not undergo this examination because this MRI system was not supported by pediatric anesthesiologists according to the institutional sedation protocol. Here, the sequences were composed of a single-shot fast-spin-echo (SSFSE) T2-weighted image, 3D volumetric multi-echo gradient sequence (IDEAL-IQ for proton density fat quantification and T2* decay assessment), and SE-EPI MRE in axial directions. The SSFSE T2-weighted image was used to determine gross morphology in the liver and the MRI parameters for the SSFSE T2-weighted images were as follows: repetition time (TR) 540 ms, echo time (TE) 80 ms, field of view (FOV) 40 cm, matrix 320 × 256, slice thickness 8 mm, flip angle 90°, number of signal averages 0.64. The MRI parameters for IDEAL-IQ were as follows:
TR 5.9 ms, TE 2.6 ms, FOV 42 cm, matrix 128 × 128, slice thickness 8 mm, flip angle 3°, number of signal averages 0.69, six gradients ranging from 0.9 to 4.4 ms. The MRI parameters for MRE were as follows: TR 1000 ms, TE 620 ms, FOV 38 cm, matrix 64 × 64, slice thickness 8 mm, flip angle 90°, number of signal averages 2. PDFFs over 6% and T2* value under 6.4 ms were considered abnormal (15-17).
As noted for MRE, an active driver generated 60 Hz mechanical waves that passed through a passive driver attached to the right abdominal wall (18, 19). The driver amplitude was reduced by 20% according to the previous study that recommended reduction of 20% in patients older than 5 years old (18). The 2D SE-EPI sequence was used for imaging four axial slices in the widest portion of the liver, with a total acquisition time of 24 seconds. If a patient had difficulty holding their breath, the acquisition process was divided in two steps; two slices were obtained in each of the two 12-second scans (19-21). As a result, magnitude
and phase images were generated and stiffness maps (elastograms) in grayscale with 95% confidence maps were produced (19, 22).
Analysis of MRI and MRE
To measure proton density fat fraction (PDFF, %) and T2*
values (ms) in the liver, an experienced pediatric radiologist with nine years of experience measured the values in IDEAL-IQ sequence. A round ROI was drawn in each image showing the largest homogenous parenchyma of the liver right lobe avoiding hepatic vessels using a picture archiving and communication system (Centricity, General Electric Corporation, Milwaukee, WI, USA).
Next, to measure the MRE value, four freehand ROIs were drawn in the liver right lobe within the confidence interval, avoiding hepatic vessels in each slice of the grayscale stiffness map. Then, the mean MRE value (kPa) from the four measurements was used as a representative stiffness value. In this case, all subjects were divided into success and failure groups according to MRE results by the experienced pediatric radiologist. Success was defined when a stiffness map from MRE showed areas appropriate for measuring stiffness in the liver. If a stiffness map showed no pixel value with a confidence index higher than 95% in the liver, leaving no available area in four slices to draw the ROI in liver parenchyma, the scan was considered to have been a technical failure, according to the previous study (23). An MRE value over 2.71 kPa was considered abnormal (19).
To assess the quality of elastography images, the pediatric radiologist evaluated wave propagation images and stiffness maps of all patients using a three-point scale according to the previous studies (13, 23). In this case, the scoring was performed for the wave propagation image using following scoring system; score 0, disorganized wave pattern or no visible wave propagation in the entire liver;
score 1, some portion of inappropriate wave propagation, but overall sufficient quality; score 2, good image quality showing continuous wave propagation in the liver. Indeed, the scoring for stiffness map with confidence interval was done with following scoring system; score 0, no pixel value higher than 95% confidence interval in entire liver in four slices; score 1, measurable pixel value area less than 50%
of the liver; score 2, measurable pixel value area more than 50% in the liver.
Statistical Analysis
In this study, the statistical analysis was performed with SAS (version 9.4, SAS Institute Inc., Cary, NC, USA)
and R software (version 3.5.1, R Foundation for Statistical Computing, Vienna, Austria). Data were presented as median values and interquartile ranges. A Kruskal-Wallis test or Fisher’s exact test was done to compare age, sex, weight, height, BMI, PDFF, T2*, and MRE values of the FAT, BA, and IRON groups and Dunn’s method was used for post-hoc analysis. Also, the scores of image quality were compared between groups using a Kruskal-Wallis test and Dunn’s method was used for post-hoc analysis. In addition, the clinical and MRI results were compared between groups with the image quality scores using the Mann-Whitney U test. A P value of less than 0.05 was considered statistically significant.
RESULTS
PatientsDuring the study period, a total of 240 patients (≤ 20 years old) who underwent liver MRI including SE-EPI MRE were included in this study. The median age of the included patients was 15 years and the youngest of included patients was 4 years old. A total of 171 patients were male and 69 were female. The median weight of all included patients was 44.5 kg (range, 25-99 kg) and the median height was 148 cm (range, 118.7-186 cm). Among the total 240 patients, 211 (87.9%) were in the FAT group, twenty-one patients (8.8%) were in the BA group, and 8 patients (3.3%) in the IRON group. Therefore, it was determined that among the IRON group, four patients received chemotherapy, one patient had multiple transfusions for aplastic anemia, and three patients were diagnosed with beta thalassemia. A comparison of clinical findings between the evaluated groups is presented in Table 1. Age, height, and weight were noted as being significantly lower in the BA group compared with the FAT and IRON groups (all Ps ≤ 0.025). With this in mind, it was noted that the BMI was significantly higher in the FAT group, compared with the BA and IRON groups (all Ps ≤ 0.005).
Results of MRI and MRE
The median PDFF of all patients was 13.8% (range, 1-53%), while the median T2* value was 20 ms (range, 0.9- 64 ms). A comparison of MRI results between groups is presented in Table 1. PDFF values were significantly higher in the FAT group compared with the BA and IRON groups and the MRE value was significantly higher in the BA group compared with the FAT and IRON groups (P < 0.001 and
0.022, respectively).
Technical failure of SE-EPI MRE was noted in six patients who were in the IRON group (6/8 patients, 75%). However, there was no failure in the FAT and BA groups. In this case, the patients in the failure group had hepatic iron deposition due to chemotherapy and/or multiple transfusions for leukemia (n = 3), aplastic anemia (n = 1) and beta- thalassemia (n = 2). T2* values in the failure group ranged from 0.9 to 3.8 ms. Primarily noted was that one patient in both the IRON and success groups was a 16-year-old female with secondary hemochromatosis from chemotherapy received 5 years ago for a rhabdomyosarcoma of the
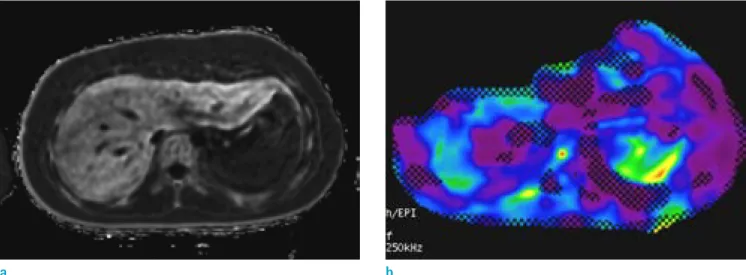
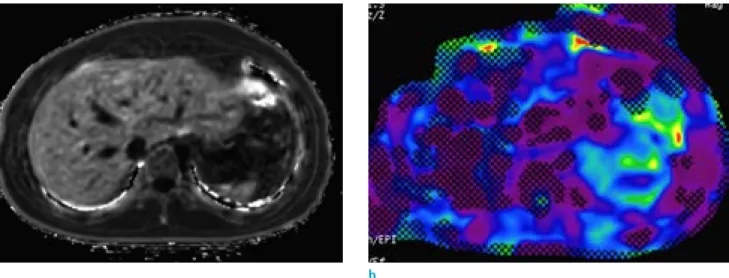
paranasal sinus. Her T2* value in the liver was 4 ms and her MRE value was 2.4 kPa (Fig. 1). Additionally, another female patient included in both the IRON and failure groups was a 20-year-old who had multiple transfusions for aplastic anemia. That patient’s T2* value in the liver was 3.8 ms and there was no region adequate for measuring the MRE value in the stiffness map (Fig. 2).
When the image quality was assessed, all six patients in the failure group and also in the IRON group had score 0 for both wave propagation images and stiffness maps. In this case, the remaining 234 patients had score 2 for stiffness map. For wave propagation images, 85 patients had score
Fig. 1. Technical success of SE-EPI MRE in a 16-year-old female who had multiple chemotherapies for paranasal rhabdomyosarcoma 5 years ago. (a) T2* value in the liver was 4 ms, suggesting iron deposition in the liver. (b) As in the color map, there was available area for measuring liver stiffness and the MRE value in the liver was 2.4 kPa.
a b
Table 1. Comparison of Clinical and MRI Results in FAT, BA, and IRON Groups
Groups FAT
(n = 211) BA
(n = 21) IRON
(n = 8) P-value1
(All) P-value2
(FAT vs. BA) P-value3
(FAT vs. IRON) P-value4 (BA vs. IRON)
Age (years) 14 (11-16) 9 (8-11) 17 (13-18) < 0.001 < 0.001 0.167 0.008
Gender (M:F) 159:52 9:12 3:5 0.002 0.003 0.030 0.568
Weight (kg) 67 (49-83) 33 (26-44) 57 (44-63) < 0.001 < 0.001 0.126 0.025
Height (cm) 159 (148-172) 137 (127-149) 163 (156-164) < 0.001 < 0.001 0.695 0.008
BMI (kg/m2) 26.4 (22.2-29.4) 17.6 (15.4-18.5) 21.5 (18.4-23.5) < 0.001 < 0.001 0.005 0.051
PDFF (%) 18 (7-31.1) 2.2 (1.7-4) 4.1 (2.6-5.5) < 0.001 < 0.001 0.002 0.143
T2* (ms) 20 (17-24) 23 (18.5-25.5) 2.6 (2.0-4.0) < 0.001 0.056 < 0.001 < 0.001
MRE (kPa) 2.4 (2-2.8) 3.3 (3.1-4.9) 2.1 (1.8-.) < 0.001 < 0.001 0.332 0.022
Values are presented in median values with interquartile ranges, P values are obtained from a Kruskal-Wallis test or Fisher’s exact test, after testing with Dunn’s method for multiple comparisons.
BA = liver fibrosis after receiving a Kasai operation from biliary atresia; BMI = body mass index; FAT = suspicion of fatty liver or focal fat deposition in the liver; IRON = hepatic iron deposition after receiving chemotherapy or multiple transfusions; MRE = magnetic resonance elastography; PDFF = MR proton density fat fraction
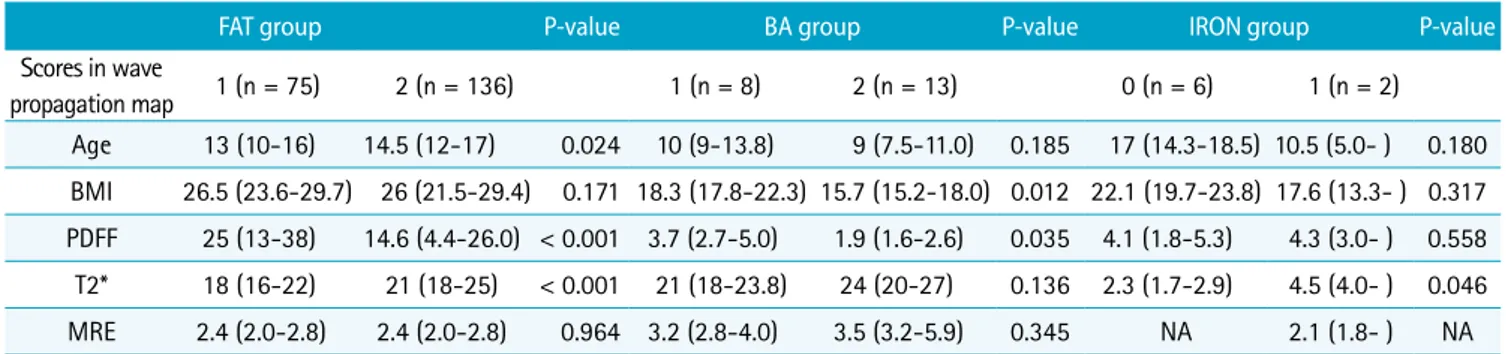
1 while 149 patients had score 2. Among the patients with score 1 on wave propagation images, 75 patients (35.6%
of the FAT group) were in FAT group, 8 patients (38.1% of the BA group) were in BA group, and 2 patients were in the IRON group. Among the patients with score 2 on wave propagation images, 136 patients (64.5% of FAT group) were in the FAT group and remaining 13 patients (61.9% of BA group) were in the BA group. Chiefly, it is noted that the scores were not significantly different between the FAT and BA groups (P > 0.999), while the scores were significantly different in the IRON group (P < 0.001) (Table 2). Thus, when we compare the scores in wave propagation images according to the groups (Table 3), patients with lower age, T2* values and higher PDFF values had score 1 rather than score 2 in the FAT group. In comparison, in the BA group, patients with higher BMI and PDFF values had score 1
rather than score 2. In the IRON group, patients with lower T2* values had score 0 rather than score 1.
No patients had technical failures from breathing, motion, or inadequate wave propagation due to abnormal paddle locations. Additionally, there were no patients with ascites.
Of the 35 patients (14.6%) under the age of 10, none were included in the failure group. In fact, only the patients with a T2* value ≤ 3.8 ms had technical failure of SE-EPI MRE (Fig.
3).
DISCUSSION
The technical failure of SE-EPI MRE was only occurred in the IRON group in our study, accounting for 75% (6/8) of the patients in the IRON group. No one under 10 years old had a technical failure, and the only significant factor
Fig. 2. Technical failure of SE-EPI MRE in a 20-year-old female who had multiple transfusions for aplastic anemia. (a) T2*
value in the liver was 3.8 ms, suggesting iron deposition in the liver. (b) As in the color map, there was no area appropriate for measuring stiffness in the liver because there was no pixel value with a confidence index higher than 95%.
a b
Table 2. Comparison of Technical Failure and Image Quality of SE-EPI MRE in FAT, BA, and IRON Groups
Groups FAT
(n = 211) BA
(n = 21) IRON
(n = 8) P-value1
(All) P-value2
(FAT vs. BA) P-value3
(FAT vs. IRON) P-value4 (BA vs. IRON)
Failure (n) 0 0 6 (75%) < 0.001 > 0.999 < 0.001 < 0.001
Image quality scores (n)
Wave propagation image (0/1/2)
0/75/136 0/8/13 6/2/0 < 0.001 > 0.999 < 0.001 < 0.001
Stiffness map
(0/1/2) 0/0/211 0/0/21 6/0/2 < 0.001 > 0.999 < 0.001 < 0.001
P values are obtained from a Kruskal-Wallis test after testing with Dunn’s method for multiple comparisons.
BA = liver fibrosis after receiving a Kasai operation from biliary atresia; FAT = suspicion of fatty liver or focal fat deposition in the liver; IRON = hepatic iron deposition after receiving chemotherapy or multiple transfusions; MRE = magnetic resonance elastography
associated with failure was a T2* value ≤ 3.8 ms. This study was meaningful because we assessed the performance and image quality of SE-EPI MRE in a 3T system with a large study population of children and young adults, and we included patients as young as 4 years old. In addition, we assessed failure rates according to the underlying diseases and presented a T2* value for influencing technical failure of MRE.
In general, the GRE sequence has been more frequently used in liver MRE for adults and children. In GRE MRE, TR and TE are greater than the period of the active driver, causing significant signal dephasing when the T2* transverse relaxation time is short (24). Therefore, the short T2*
transverse relaxation time with iron-overloaded liver causes frequent technical failure of GRE MRE (25, 26). Considering the shorter T2* relaxation time of 3T MRI compared to 1.5T MRI, failure in GRE MRE is increased in iron-overloaded
liver at 3T. However, under these circumstances SE-EPI MRE is less sensitive to transverse relaxation signal decay, has a shorter acquisition time, and a higher signal-to-noise ratio to permit imaging larger and deeper waves compared with GRE MRE (11). Therefore, the use of SE-EPI MRE offers benefits for patients with iron-overloaded liver, for children due to its shorter acquisition time, and for obese patients who have a large liver with a deep location. However, it is noted that few reports use SE-EPI MRE in pediatric patients (10, 27).
In a recent study of adults, the technical failure rate was evaluated as lower in SE-EPI than in GRE MRE (4% vs. 10%) at 3T MRI (12). In another study with adults, the failure rate for SE-EPI MRE was much lower than for GRE MRE at 3T (1.2% vs. 10.7%) (28). It was noted that among the failed patients using GRE MRE, 67% of patients had lower T2*
values from iron deposition and the remaining participants had poor wave propagation. The reported median T2*
value of the failure group from GRE was 8.8 ms with an interquartile range of 4.4-20 ms, which was higher than our study. Another study, by Wagner et al. (23), showed a similar technical failure rate for GRE MRE (8%) while SE- EPI MRE showed no technical failure in adults. In that case, the reported T2* values from the failure group were also under 4.4 ms.
A few studies have assessed technical failure of MRE in pediatric patients. Joshi el al. (14) first reported that the technical failure rate of GRE MRE in children and young adults at 1.5T was 3.8%. The common reasons given for failure were poor wave propagation due to inappropriate paddle location (28%) and hepatic iron overload (22%). The Wagner et al. (13) study included patients as young as 12 years old, and revealed that the technical failure rate for Fig. 3. T2* values in all 240 patients. A total of 2.5% of
patients who had T2* values ≤ 3.8 ms had technical failure of SE-EPI MRE.
Table 3. Comparison of Clinical and MRI Results in FAT, BA, and IRON Groups According to the Image Quality Scores in Wave Propagation Map
FAT group P-value BA group P-value IRON group P-value
Scores in wave
propagation map 1 (n = 75) 2 (n = 136) 1 (n = 8) 2 (n = 13) 0 (n = 6) 1 (n = 2)
Age 13 (10-16) 14.5 (12-17) 0.024 10 (9-13.8) 9 (7.5-11.0) 0.185 17 (14.3-18.5) 10.5 (5.0- ) 0.180 BMI 26.5 (23.6-29.7) 26 (21.5-29.4) 0.171 18.3 (17.8-22.3) 15.7 (15.2-18.0) 0.012 22.1 (19.7-23.8) 17.6 (13.3- ) 0.317 PDFF 25 (13-38) 14.6 (4.4-26.0) < 0.001 3.7 (2.7-5.0) 1.9 (1.6-2.6) 0.035 4.1 (1.8-5.3) 4.3 (3.0- ) 0.558 T2* 18 (16-22) 21 (18-25) < 0.001 21 (18-23.8) 24 (20-27) 0.136 2.3 (1.7-2.9) 4.5 (4.0- ) 0.046 MRE 2.4 (2.0-2.8) 2.4 (2.0-2.8) 0.964 3.2 (2.8-4.0) 3.5 (3.2-5.9) 0.345 NA 2.1 (1.8- ) NA Values are presented in median values with interquartile ranges, P values are obtained from a Mann-Whitney U test.
BA = liver fibrosis after receiving a Kasai operation from biliary atresia; BMI = body mass index; FAT = suspicion of fatty liver or focal fat deposition in the liver; MRE = magnetic resonance elastography; NA = not applicable; PDFF = MR proton density fat fraction
GRE MRE at 3T was higher than at 1.5T (15.3% vs. 3.5%).
They showed that a technical failure of GRE MRE was associated with BMI, iron overload, massive ascites, and the use of a 3T system. The Serai et al. (10) study assessed the utility of GRE and SE-EPI MRE in children and young adults using a 1.5T system. Even though they did not report failure rates, GRE MRE showed a higher incidence of moderate to severe breathing artifacts than was seen with SE-EPI (27.5% vs. 0%). On the same topic, Serai et al. (27) recently published a study assessing the diagnostic performance of SE-EPI MRE at 1.5T and demonstrated that approximately 23% of children who had T2* values lower than 4.3 ms had technical failures. However, there are no reports that have assessed the performance and image quality of SE-EPI MRE at 3T in children and young adults.
In our study, inadequate wave propagation observed in GRE MRE did not occur in our study using SE-EPI MRE. Also, we fixed the paddle with bandages on the patients, and thus, there was no inadequate positioning or movement of paddle during the acquisitions. Additionally, there was no patient who had motion artifact that affected acquisition of MRE, because of the fast acquisition of stiffness map. When we assessed the image quality in wave propagation images and stiffness maps, the scores were lower in the IRON group. The stiffness map showed an adequate area over 50% of the liver, even though the wave propagation images had both scores 1 and 2. In six patients with failure in the IRON group had score 0 on both wave propagation image and stiffness map. The factor contributing to failure of SE- EPI MRE at 3T was a T2* value ≤ 3.8 ms. Another key point is that the reported cut-off value of 3.8 ms was also the lowest value compared with previous studies, including the study with SE-EPI MRE in a 1.5T system (27). In addition, our failure rate of SE-EPI MRE at 3T was comparable with that of an adult study reporting 0-4%. Although the success rate of MRE could be affected by the composition of the disease in the study population, this study is meaningful, in that we included large numbers of patients and reported the lowest cut-off value for obtaining MRE results from a wide range of T2* values. In our study, the utility of SE- EPI sequence for MRE and reduced acquisition time to 12 sec for two slices could result in a high success rate in pediatric liver MRE. We therefore suggest using SE-EPI MRE as an alternative to GRE MRE at 3T in children with iron deposition, with patients at younger ages, and with patients who experienced an increased PDFF.
Notably, there are several limitations of this study. First, because of the retrospective study design, patients with
ascites or infants who required sedation were not subjected to MRE and the effect of free breathing was not assessed in our study population. Second, the pathologic evaluation of fibrosis, iron or fat deposition in the liver was not assessed from ethical problem in children. Further studies with pathologic results are needed to know accurate factors affecting MRE performance and methods to overcome failure of MRE.
In conclusion, our study showed that technical failure of SE-EPI MRE at 3T occurred only in the IRON group of a study population of children and young adults. Decreased T2* value (≤ 3.8 ms) was associated with technical failure of SE-EPI MRE.
REFERENCES
1. Bonekamp S, Kamel I, Solga S, Clark J. Can imaging modalities diagnose and stage hepatic fibrosis and cirrhosis accurately? J Hepatol 2009;50:17-35
2. Mavis AM, Alonso EM. Liver disease in the adolescent. Clin Liver Dis 2015;19:171-185
3. Friedman SL. Evolving challenges in hepatic fibrosis. Nat Rev Gastroenterol Hepatol 2010;7:425-436
4. Bortolotti F, Guido M. Reversal of liver cirrhosis: a desirable clinical outcome and its pathogenic background. J Pediatr Gastroenterol Nutr 2007;44:401-406
5. Castera L, Pinzani M. Biopsy and non-invasive methods for the diagnosis of liver fibrosis: does it take two to tango?
Gut 2010;59:861-866
6. Pariente D, Franchi-Abella S. Paediatric chronic liver diseases: how to investigate and follow up? Role of imaging in the diagnosis of fibrosis. Pediatr Radiol 2010;40:906-919
7. Kennedy P, Wagner M, Castera L, et al. Quantitative elastography methods in liver disease: current evidence and future directions. Radiology 2018;286:738-763 8. Trout AT, Sheridan RM, Serai SD, et al. Diagnostic
performance of MR elastography for liver fibrosis in children and young adults with a spectrum of liver diseases. Radiology 2018;287:824-832
9. Singh S, Venkatesh SK, Wang Z, et al. Diagnostic performance of magnetic resonance elastography in staging liver fibrosis: a systematic review and meta- analysis of individual participant data. Clin Gastroenterol Hepatol 2015;13:440-451 e446
10. Serai SD, Dillman JR, Trout AT. Spin-echo echo-planar imaging MR elastography versus gradient-echo MR elastography for assessment of liver stiffness in children
and young adults suspected of having liver disease.
Radiology 2017;282:761-770
11. Kim YS, Jang YN, Song JS. Comparison of gradient-recalled echo and spin-echo echo-planar imaging MR elastography in staging liver fibrosis: a meta-analysis. Eur Radiol 2018;28:1709-1718
12. Felker ER, Choi KS, Sung K, et al. Liver MR elastography at 3 T: agreement across pulse sequences and effect of liver R2* on image quality. AJR Am J Roentgenol 2018;211:588- 594
13. Wagner M, Corcuera-Solano I, Lo G, et al. Technical failure of MR elastography examinations of the liver: experience from a large single-center study. Radiology 2017;284:401- 412
14. Joshi M, Dillman JR, Towbin AJ, Serai SD, Trout AT. MR elastography: high rate of technical success in pediatric and young adult patients. Pediatr Radiol 2017;47:838-843 15. Alustiza Echeverria JM, Castiella A, Emparanza JI.
Quantification of iron concentration in the liver by MRI.
Insights Imaging 2012;3:173-180
16. Shin HJ, Kim HG, Kim MJ, et al. Normal range of hepatic fat fraction on dual- and triple-echo fat quantification MR in children. PLoS One 2015;10:e0117480
17. Wahidiyat PA, Iskandar SD, Sekarsari D. Evaluation of iron overload between age groups using magnetic resonance imaging and its correlation with iron profile in transfusion- dependent thalassemia. Acta Med Indones 2018;50:230- 236
18. Serai SD, Towbin AJ, Podberesky DJ. Pediatric liver MR elastography. Dig Dis Sci 2012;57:2713-2719
19. Binkovitz LA, El-Youssef M, Glaser KJ, Yin M, Binkovitz AK, Ehman RL. Pediatric MR elastography of hepatic fibrosis:
principles, technique and early clinical experience. Pediatr
Radiol 2012;42:402-409
20. Petitclerc L, Sebastiani G, Gilbert G, Cloutier G, Tang A. Liver fibrosis: review of current imaging and MRI quantification techniques. J Magn Reson Imaging 2017;45:1276-1295 21. Mariappan YK, Glaser KJ, Ehman RL. Magnetic resonance
elastography: a review. Clin Anat 2010;23:497-511
22. Srinivasa Babu A, Wells ML, Teytelboym OM, et al.
Elastography in chronic liver disease: modalities, techniques, limitations, and future directions.
Radiographics 2016;36:1987-2006
23. Wagner M, Besa C, Bou Ayache J, et al. Magnetic resonance elastography of the liver: qualitative and quantitative comparison of gradient echo and spin echo echoplanar imaging sequences. Invest Radiol 2016;51:575-581
24. Rump J, Klatt D, Braun J, Warmuth C, Sack I. Fractional encoding of harmonic motions in MR elastography. Magn Reson Med 2007;57:388-395
25. Venkatesh SK, Yin M, Ehman RL. Magnetic resonance elastography of liver: technique, analysis, and clinical applications. J Magn Reson Imaging 2013;37:544-555 26. Yin M, Glaser KJ, Talwalkar JA, Chen J, Manduca A, Ehman
RL. Hepatic MR elastography: clinical performance in a series of 1377 consecutive examinations. Radiology 2016;278:114-124
27. Serai SD, Trout AT. Can MR elastography be used to measure liver stiffness in patients with iron overload?
Abdom Radiol (NY) 2019;44:104-109
28. Kim YS, Song JS, Kannengiesser S, Seo SY. Comparison of spin-echo echoplanar imaging and gradient recalled echo-based MR elastography at 3 Tesla with and without gadoxetic acid administration. Eur Radiol 2017;27:4120- 4128