�Received; June 14, 2014�Revised; August 12, 2014
�Accepted; August 19, 2014
Corresponding author : Dal Mo Yang, M.D.
Department of Radiology, Kyung Hee University Hospital at Gangdong, 149 Sangil-dong, Gangdong-gu, Seoul 134-727, Korea.
Tel. 82-2-440-6183, Fax. 82-2-440-6932 E-mail : [email protected]
This is an Open Access article distributed under the terms of the Creative Commons Attribution Non-Commercial License (http://creativecommons.org/licenses/by-nc/3.0/) which permits unrestricted non-commercial use, distribution, and reproduction in any medium, provided the original work is properly cited.
Correlation of the Speed of Enhancement of Hepatic Hemangiomas with Intravoxel Incoherent Motion MR Imaging
Dal Mo Yang1, Geon-Ho Jahng1, Hyun Cheol Kim1, Sang Won Kim1, Hyug-Gi Kim2
1Department of Radiology, Kyung Hee University Hospital at Gangdong, Seoul, Korea
2Department of Biomedical Engineering, Kyung Hee University, Gyeonggi-do, Korea
Purpose : To evaluate the relationship between the speed of enhancement of hepatic hemangiomas on gadolinium- enhanced MRI and ADC values by using various parameters, including the D, f, D* and ADCfiton intravoxel incoherent motion (IVIM) MR Imaging.
Materials and Methods: The institutional review board approved this retrospective study. A total of 47 hepatic heman- giomas from 39 patients were included (20 men and 19 women). The hemangiomas were classified into three types according to the enhancement speed of the hepatic hemangiomas on gadolinium-enhanced dynamic T1-weighted images: rapid (Type A), intermediate (Type B), and slow (Type C) enhancement. The D, f, D* and ADCfitvalues were calcu- lated using IVIM MR imaging. The diffusion/perfusion parameters and ADC values were compared among the three types of hemangiomas.
Results: Both the ADCfitand D values of type C were significantly lower than those of type A (P = 0.0022, P = 0.0085).
However, for the f and D*, there were no significant differences among the three types. On DWI with all b values (50, 200, 500 and 800 sec/mm2), the ADC values of type C were significantly lower than those of the type A (P < 0.012). For b values with 800 sec/mm2, the ADC800values of the type C hemangiomas were significantly lower than those of type B (P
= 0.0021). We found a negative correlation between hepatic hemangioma enhancement type and ADC50(ρ= -0.357, P
= 0.014), ADC200(ρ= -0.537, P = 0.0001), ADC500(ρ= -0.614, P = 0.0001), and ADC800(ρ= -0.607, P = 0.0001).
Therefore, four ADC values of ADC50, ADC200, ADC500, and ADC800were decreased with decreasing enhancement speed.
Conclusion: Hepatic hemangiomas had variable ADCs according to the type of enhancement, and the reduced ADCs in slowly enhancing hemangiomas may be related to the reduced pure molecular diffusion (D).
Index words : Hepatic hemangioma∙Liver MRI∙Diffusion-weighted imaging∙Incoherent intravoxel motion MR Imaging
Original Article
Hemangiomas are the most common benign hepatic tumor and they occur in 5% to 20% of the general population (1). Because of the high prevalence of hemangiomas in the general population, differentia- tion between hemangiomas and other hepatic lesions is important. With advances in hardware and coil systems, diffusion-weighted MR imaging can be applied to liver imaging. Diffusion-weighted imaging (DWI) can help detect and characterize focal hepatic lesions by measuring a lesion’s apparent diffusion coefficient (ADC) (2-6).
Hepatic hemangiomas usually show a greater degree of signal attenuation on DWI with higher b thus higher ADC values (7). However, hepatic hemangiomas show various degrees of ADC values, which make it difficult to distinguish hepatic hemangiomas from other hepatic tumors (2-4). The enhancement pattern of hemangiomas may affect the ADC values, since these values can depend on blood flow, perfusion, and/or diffusion within the hemangiomas (8-10). However, there are only a few studies examining the relationship between ADC values and the type or speed of enhancement of hepatic hemangiomas (8, 11).
Intravoxel incoherent motion (IVIM) MR imaging is a method to quantitatively assess the microscopic translational motions that occur in each image voxel on MR imaging (12-22). Both pure molecular diffusion (D) and microcirculation-related diffusion, called pseudo diffusion (D*), or blood flow fraction (f) can be distinguished by using IVIM MR imaging (14).
IVIM MR imaging may increase our understanding of enhancement of hemangiomas by analyzing several parameters on IVIM MR imaging, including D, f, D*, and ADC. There have been no studies on the relation- ship between IVIM MR imaging and the speed of enhancement in hepatic hemangiomas.
Therefore, the purpose of our study was to evaluate the relationship between the speed of enhancement of hepatic hemangiomas on gadolinium-enhanced MRI and diffusion and perfusion parameters obtained from multi b-value DWI data.
Patients
Our institutional review board approved this retrospective study and they waived informed patient consent. We performed a review of the clinical records of the abdominal MR imaging examinations that demonstrated the presence of hepatic hemangiomas and were performed from January 2009 through January 2013. Inclusion criteria were radiological and clinical confirmation of the nature of the lesions, the presence of a focal hepatic lesion with a size of ≥ 10 mm, and the availability of both the T2-weighted images and the multi b-value DWI data. A total of 47 hepatic hemangiomas were diagnosed in 39 patients (20 men and 19 women). The mean age of the 39 selected patients was 50 years (range: 26-75 years).
The diagnosis of hemangiomas was established with the classical contrast enhancement pattern seen on MR and/or CT with no change in the size of the lesions for six months or more on serial CT (11). The longest diameter of the hepatic hemangiomas was measured by one radiologist (D. M. Y.). The diameter of the lesions ranged from 1 cm to 4.6 cm (mean: 1.7 cm).
MR imaging techniques
MR imaging was performed with a 1.5-Tesla system (Achieva; Philips Medical Systems, Best, Netherlands) with a six-channel sensitivity-encoding (SENSE) torso coil. All patients were initially examined with a routine MRI protocol of the upper abdomen, which included T2-weighted images, in- and opposed-phase T1-weighted images, multi b-value DWI images, and multi-phase contrast-enhanced three-dimensional (3D) T1-weighted images.
For the T2-weighted images, breath-hold, fat suppressed fast spin-echo (FSE) MR imaging was performed with the following parameters: repetition time (TR)/echo time (TE): 441/90 ms, matrix: 256 × 183, field of view (FOV): 36 × 28 cm, acquisition of two signals, and section thickness: 6 mm with a 1 mm section gap. For the in- and opposed-phase T1- weighted images, dual-echo fast field-echo (FFE) MR imaging was performed with the following parameters:
187/2.3 ms (opposed-phase), 4.6 ms (in-phase), flip MATERIALS AND METHODS
INTRODUCTION
angle: 80�, matrix: 256 × 256, FOV: 36 × 28 cm, acquisition of one signal, and section thickness: 6 mm with a 1 mm section gap.
For the multi b-value DWI data, the breath-hold fat- suppressed spin-echo echo-planar imaging (EPI) sequence was performed with the following parame- ters: TR/TE: 1338/66 ms, matrix: 112 × 88, FOV: 36
× 28 cm, acquisition of two signals, section thickness:
6 mm with 1 mm section gap, receiver bandwidth:
2627 Hz, a transverse plane, SENSE parallel imaging factor: 2 and acquisition time: less than 25 seconds for breath-hold acquisition. Two b-value images were obtained within a single breath-hold time for each scan. Therefore, scans were repeated four times (b=0 and 50 sec/mm2, b=0 and 200 sec/mm2, b=0 and 500 sec/mm2, and b=0 and 800 sec/mm2). For each scan, diffusion gradients were applied on the slice-selection, phase-encoding, and readout-encoding directions. We used coregistration technique (Statistical Parametric Mapping 5, Mathworks, MA, USA) for overcoming image misregistration between multiple b value images during breathhold.
For the multi-phase contrast-enhanced 3D T1- weighted images, a spoiled gradient-echo sequence (THRIVE) was run before and after injection of gadopentetate dimeglumine (Magnevist, Schering, Berlin, Germany) at a dose of 0.1 mmol per kilogram of body weight followed by a 20 ml saline flush with a power injector. The arterial, portal, and delayed phase images were obtained at 10 seconds, 40 seconds and 2 minutes after contrast media arrival at thoraic aorta on real time MR imaging fluoroscopic monitoring. The acquisition parameters were as follows: 4.8/2.4 ms, flip angle: 15�, matrix: 352 × 256, field of view: 36
× 28 cm, acquisition of two signals, and section thickness: 6 mm without the section gap.
Image and Data Analyses
Two experienced radiologists (H.C.K and S.W.K.) retrospectively reviewed the MR images from a picture archiving and communications system (PACS). They each had more than 10 years experience in the practice and interpretation of liver MR and worked in consensus on the study images.
The hemangiomas were classified into three types according to the enhancement speed of the hepatic hemangiomas on gadolinium-enhanced multi-phase
T1-weighted images, which was determined by the enhancing tumor volume of the portal phase images:
Type A included hemangiomas with rapid enhance- ment (the enhancing area of the mass was more than 75% of the total volume of the mass), Type B included hemangiomas with intermediate enhancement (the enhancing area of the mass was between 25% and 75%), and Type C hemangiomas had slow enhance- ment (the enhancing area of the mass was less than 25%).
The multi b-value DWI data were analyzed by a volumetric region-of-interest (ROI) method. One radiologist (D.M.Y.) drew a 3D ROI area of each hemangioma using MRIcro software (http://www.
cabiatl.com/micro/) to obtain the DWI signal intensity (SI) of each lesion. ROIs were traced manually as large as possible of each hemangiomas.
In this study, three different methods were used to obtain diffusion or flow-related parameters.
First, flow and the true and pseudo diffusion coeffi- cients were estimated using the following equation on the basis of the IVIM theory:
SI/SI0= (1 - f) × exp (-bD) + f × exp (-bD*) [1], where D and D* are the true diffusion coefficient and the pseudo diffusion coefficient, respectively, and f is the fractional volume occupied in the voxel by flowing spins. By using the Levenberg-Marquardt nonlinear least-squares algorithm, the D, f, and D*
were calculated for each ROI of the hepatic hemangiomas. Five b-values of 0, 50, 200, 500 and 800 sec/mm2were used. The units of these three values are expressed as mm2/sec for both D and D*
and percent (%) for f. The terms on the right side of the equation indicate the true diffusion for the first term and flow-related pseudo diffusion for the second term. Therefore, D is the diffusion coefficient representing the slow component of diffusion by pure molecular diffusion, but D* is the diffusion coefficient representing the fast component of diffusion by incoherent microcirculation, which is the flow-related diffusion coefficient.
Second, to obtain accurate ADC values with a single-component model, we calculated the ADC value of each ROI by fitting the following equation using the four DWI SI values from four different b values of 50, 200, 500 and 800 sec/mm2.
SI/SI0= Exp (-b ADCfit) [2],
where ADCfitis the ADC value obtained from the exponential fitting of DWI signal intensities and is calculated by using linear regression analysis with the natural logarithm of the intensity and the variable b from the four images. The ADC is expressed as mm2/sec. The ADCfitvalue should be much more accurate than the ADC value obtained from only the two b-values, which is shown in the following sentence.
Third, the ADC value for each b factor was calculated by using the following equation.
ADCb= In(SI0/SIb)/b [3],
where SI0is the signal intensity in each ROI without a diffusion gradient (b = 0) and SIbis the DWI signal intensity in the ROI with the diffusion factor b (i.e., 50, 200, 500, and 800 sec/mm2). The ADC is express- ed as mm2/sec. From this equation, we had four differ-
ent ADC values, which are ADC50, ADC200, ADC500 and ADC800. We expect that these values are less accurate than the ADCfit obtained from the second method. However, these ADC values can be used to show the effects of diffusion-weighted factors of the three subject groups.
Statistical analysis
The type of hepatic enhancement, hemangioma size, and the D, f, D*, ADCbfor the four b values and ADCfitvalues were compared using the Wilcoxon rank sum test (SPSS, version 12, Chicago, IL USA).
Probability values less than 0.016 (i.e., 0.05 divided by 3 to consider the multiple comparison using the Bonferroni method because we have three groups) were considered statistically significant.
The correlation between hepatic hemangioma
Table 1. Mean Size, True Diffusion (D), Pseudodiffusion (D*), and Perfusion Fraction (f) According to the Speed of Hepatic Hemangiomas
Type A (n=14) Type B (n=15) Type C (n=18)
Size (cm) 1.36±0.34 2.25±1.02 1.56±0.82
D (×10-3mm2/s) 2.04±0.6* 1.90±0.63 1.50±0.39*
D* (×10-3mm2/s) 19.7±14.3 17.2±13.8 12.9±11.7
f (%) 30.1±0.1 31.4±3.8 30.2±0.9
ADCfit(×10-3mm2/s) 2.07±0.38� 2.06±0.54� 1.62±0.34��
Note.─ Data are means±standard deviation Type A: means hemangioms with rapid enhancement Type B: means hemangioms with intermediate enhancement Type C: means hemangioms with slow enhancement
*: Significant difference between two (p = 0.0085)
�: Significant difference between two (p = 0.0022)
�: Significant difference between two (p = 0.0136)
Table 2. ADC values b=50,200,500 and 800 sec/mm According to the Speed of Hepatic Hemangiomas
Type A (n=14) Type B (n=15) Type C (n=18)
b 50 6.25 1.99* 5.67 2.67 4.13 2.07*
b 200 3.98 0.74* 3.39 1.36 2.56 1.03*
b 500 2.69 0.56* 2.46 0.74 1.91 0.69*
b 800 2.36 0.38* 2.29 0.51� 1.78 0.27*�
Note.─ Data are means±standard deviation Type A: means hemangioms with rapid enhancement Type B: means hemangioms with intermediate enhancement Type C: means hemangioms with slow enhancement
*: Significant difference between two (p < 0.0160)
�: Significant difference between two (p = 0.0021)
enhancement type and the D, f, D*, ADCbfor the four b values and ADCfitvalues was assessed with the Spearman correlation coefficient. A probability value less than 0.05 was considered statistically significant.
The sizes and the ADCfit, D, f, and D* values of the hepatic hemangiomas according to enhancement type are summarized in Table 1. In addition, the ADCb values calculated using the four b values (50, 200, 500 and 800 sec/mm2) of the hepatic hemangiomas, according to enhancement type, are also summarized in Table 2. The number of the hepatic hemangiomas was 14 for type A, 15 for type B and 18 for type C.
There was no significant difference in lesion size among the three types of hemangiomas (p > 0.05).
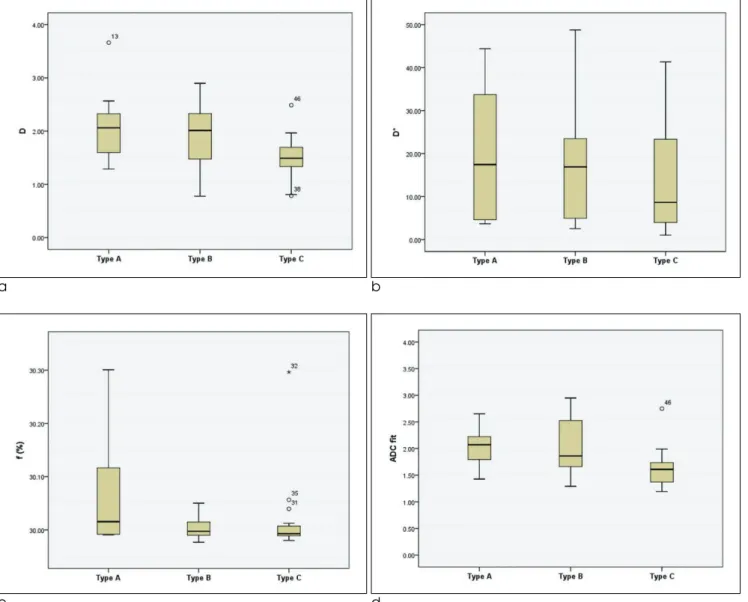
Based on the first analysis method, the D values of type C hemangiomas were significantly lower than those of type A hemangiomas (p = 0.0085) (Figs. 1-4).
However, the D values were not significantly different between types A and B and between types B and C (p
> 0.016). We found a negative correlation between enhancement type of hepatic hemangiomas and D value (ρ= -0.401, P = 0.005). Therefore, D values were decreased with decreasing enhancement speed.
Although the difference in D* values was not statisti- cally significant among the three groups (P > 0.016), D* values also decreased with decreasing enhance- ment speed. There were not significant differences in f among the three types of hemangioma. No correlation was found between hepatic hemangioma enhancement type and D* (ρ= -0.222, P = 0.133) and f (ρ= -0.230, P = 0.121).
Based on the second analysis method, the ADCfitof RESULTS
a b
c d
Fig. 1. MR images of 47-year-old man with slow enhancing hepatic hemangioma. (a, b) Transverse dynamic fat-suppressed T1- weighted images shows a hepatic lesion in the right lobe (arrow), which is no enhancement in the arterial phase (a) and minimal peripheral nodular enhancement in the delayed phase (b). (c, d) Diffusion weighted image (b = 50, 800 sec/mm2) show that the signal intensity of the lesion remains high (arrow).
the slowly enhancing hemangiomas (type C) were significantly lower than those of the rapidly enhancing hemangiomas (type A) and intermediately enhancing hemangiomas (type B) (P < 0.016) (Figs. 1-4). We found a negative correlation between hepatic hemangioma enhancement type and ADCfit(ρ=
-0.479, P = 0.001). ADCfitvalues decreased with decreasing the speed of enhancement.
Based on the third analysis method, the ADC values of type C hemangiomas were significantly lower than those of type A (P < 0.016) for ADC50, ADC200, ADC500, and ADC800. For only the b values with 800 sec/mm2, the ADC800values of type C hemangiomas were significantly lower than those of type B hemangiomas (P = 0.0021). However, no significant difference was observed between types A and B and types B and C with other b-values (P > 0.016). We found a negative correlation between hepatic hemangioma enhancement type and ADC50(ρ=
-0.357, P = 0.014), ADC200(ρ= -0.537, P = 0.0001), ADC500(ρ= -0.614, P = 0.0001), and ADC800(ρ=
-0.607, P = 0.0001). Therefore, four ADC values of ADC50, ADC200, ADC500, and ADC800were decreased with decreasing enhancement speed.
In this study we obtained multiple DWI data obtained using five different diffusion-weighting factors to test whether the difference in ADC values according to enhancement pattern depended on the cellularity of hemangiomas. We found that diffusion coefficients decreased with decreasing enhancement speed, but not flow. Therefore, difference in ADC values according to the speed of enhancement of hepatic hemangiomas on gadolinium-enhanced MRI can be related to diffusion rather than flow.
DISCUSSION
e f
g h
Fig. 1. (e-h) The D, f, D* and ADCfit values of the lesion (arrow) were 1.44 × 10⁻³mm2/sec, 30 (%), 6.2 × 10⁻³mm2/sec and 1.64 × 10⁻³mm2/sec., respectively.
a b
c d
e f
g
Fig. 2. MR images of 42-year-old man with rapid enhancing hepatic hemangioma. (a) On arterial phase of transverse dynamic fat-suppressed T1-weighted image, there is a homogeneously enhancing mass in the right lobe (arrow). (b, c) Diffusion weighted image (b = 50 sec/mm2) shows that the signal intensity of the lesion (arrow) remains high. But the signal intensity of the lesion (arrow) is reduced on diffusion weighted image using high b value (b = 800 sec/mm2) (d-g) The D, f, D* and ADCfitvalues of the lesion (arrow) were 2.04 × 10⁻³mm2/sec, 30.1 (%), 35.2 × 10⁻³mm2/sec and 2.14 × 10⁻³mm2/sec., respectively.
Furthermore, we found that DWI with higher b-values was sensitive enough to distinguish hemangiomas with different enhancement patterns.
The first main finding of this study was that the difference in ADC values according to hemangioma enhancement speed is related more to the difference in pure molecular diffusion rather than perfusion.
Diffusion can distinguish the rapid enhancing hemangiomas (type A) from slow enhancement hemangiomas (type C), but perfusion cannot. The D values were significantly lower in type C hemangiomas compared to type A. However,
perfusion related parameters, including f and D*, were not significantly different between the two types of hemangioma. The slowly enhancing hemangiomas (type C) demonstrated a decrement of pure molecular diffusion (D) compared to that of the rapidly enhanc- ing hemangiomas (type A). This result was also supported the ADCfitdatum analysis. The ADCfit values were significantly lower in the type C hemangiomas compared to those of type A and B hemangiomas. ADCfitdecreased with decreasing enhancement speed. There was a statistically signifi- cant difference in the ADCbvalues between type A
a b
c d
Fig. 3. Box plots of (a) D, (b) D*, (c) f, and (d) ADCfitaccording to speed of enhancement of hemangiomas. Top and bottom of boxes are 25th and 75th percentiles of the values, respectively. Length of box represents the interquartile range within the 50th percentiles of values. The horizontal line inside the box indicates median values. Data points outside box are outliers and are smaller than the lower quartile minus 1.5 times the interquartile range or larger than the upper quartile plus 1.5 times the interquartile range.
and C with all b values (50, 200, 500, and 800 sec/mm2). For low b values, the signal decay is due to the effects of both pure molecular diffusion and perfusion. However, for high b values, the perfusion effects make a minimal contribution. In our study, the ADC values between types A and C were different with both low and high b values. In addition, the ADC values between type B and type C were different with high b value (800 sec/mm2). Therefore, the difference in the ADC values according to hemangioma enhance- ment type is more related to the difference of pure molecular diffusion rather than pseudo diffusion or flow. These results could explain how the difference in ADC values between type C and type A is related to pure molecular diffusion rather than perfusion.
The second main finding of this study was that DWI with higher b-values was sensitive enough to distin- guish hemangiomas with intermediate enhancement from those with slow enhancement. There was a statis- tically significant difference in ADC values between types B and C with a high b value (800 sec/mm2), but we could not differentiate the two types with low b- values (50, 200, 500). With a very high b-value, DWI datum can display slow diffusion alternations.
Therefore, it should be important to use DWI with a high b-value, because at a low b value the signal intensity is dominated by fast diffusion, whereas at a
high b value, the signal intensity is governed predomi- nantly by slow diffusion.
Hepatic hemangiomas consist of cavernous vascular spaces that allow diffusion of water molecules through intervening connective tissue septa. The lower ADC values in the slowly enhancing hemangiomas may be related to two conditions. First, slowly enhancing hemangiomas may have more narrow cavernous spaces, which have abundant and thick irregular intervening septa that could facilitate low molecular diffusion. Second, the presence of scar tissues within the slow enhancing hemangioma may cause decreased molecular diffusion secondary to fibrotic changes. Yu et al asserted that no or minimal enhancement of the hemangioma may be due to degenerative changes, including organizing thrombus, hemorrhage or fibrotic scar (23). In addition, Yamashita et al described that the diffusion of the contrast material is very slow or absent in hemangiomas with scar tissue (24).
A previous study determined that the ADC values of the hepatic hemangiomas varied according to the enhancement type, as determined by gadolinium- enhanced MRI (8). The hemangiomas with early enhancement had higher ADC values compared to those with peripheral nodular enhancement and delayed enhancement (8). Another study demonstrated that a higher speed of blood flow in the cavernous spaces of hepatic hemangiomas contributed signifi- cantly to the relatively higher ADCs (11). Those two results are in good agreement with what we found in this study, but our interpretations differed. The authors of the previous studies (8, 11) proposed that the ADCs of hepatic hemangiomas were directly affected by the degree of intralesional perfusion rather than diffusion. The previous study only used two b values (0 and 500 sec/mm2) and their result cannot explain whether the difference of ADC values in the enhance- ment types is due to pure molecular diffusion or flow (8). However, the result of this study demonstrated that decreased signal intensities depended on diffusion because ADC50, ADC200, and ADC500were signifi- cantly different between the types A and C, but ADC800was only significantly different than types B and C. The ADC values of the hemangiomas can combine both pure molecular diffusion and capillary perfusion when DWI data are acquired with a relatively low b-value (13). Thus, these results should Fig. 4. Plot of the diffusion MR imaging signal attenuation
against the b value according to the speed of enhancement of hemangiomas. Type A included hemangiomas with rapid enhancement. Type B included hemangiomas with intermediate enhancement. Type C hemangiomas had slow enhancement.
be further investigated with very high b values and a large sample of hemangiomas. We assume that using a very high b value might enhance the difference in ADC values in the enhancement types of the hepatic hemangiomas. Therefore, further studies with much higher b-value, such as 2,000 sec/mm2should be performed to confirm our results.
This study has several limitations. First, the patient population was small and the study design was retrospective. Therefore, a prospective study with a large sample size should be performed. Second, we used only five b values (0, 50, 200, 500 and 800 sec/mm2) for IVIM MR imaging in this study, and therefore it may be difficult to accurately characterize biexponential signal attenuations. Although there is no consensus as of yet regarding the number of b values that should be used for clinical measurements, a large number of b values may provide more data support for measuring parameters (21). However, it is not clinically feasible to obtain a large number of b values, because this requires very long measurement times. Third, the reproducibility measurement for ROI of smaller hemangiomas may be another limitation.
Finally, although it is generally accepted that obtaining typical imaging findings at two or more imaging examinations is sufficient for diagnosing hemangioma, all of our cases were not pathologically confirmed.
Therefore, we could not perform pathologic correla- tion. To strengthen our results, further studies with larger sample sizes, using multiple b values, and with pathologic correlation are needed.
In summary, hepatic hemangiomas had variable ADCs on DWI according to the enhancement patterns as determined by gadolinium-enhanced MRI. The lower ADC values in slowly enhancing hemangiomas may be related to reduced pure molecular diffusion, which is represented by decreased D values. The slowly enhancing hemangiomas show low ADCs and D, which may overlap with those of malignant tumors, such as hepatocellular carcinomas, intrahepatic mass- forming cholangiocarcinomas and metastases.
In conclusion, the IVIM MR imaging is useful in discerning the reason for differences in ADC values between hepatic hemangiomas with different enhance- ment types.
References
1. Semelka RC, Sofka CM. Hepatic hemangiomas. Magn Reson Imaging Clin N Am 1997;5:241-253
2. Ichikawa T, Haradome H, Hachiya J, Nitatori T, Araki T.
Diffusion-weighted MR imaging with a single-shot echoplanar sequence: detection and characterization of focal hepatic lesions.
AJR Am J Roentgenol 1998;170:397-402
3. Namimoto T, Yamashita Y, Sumi S, Tang Y, Takahashi M. Focal liver masses: characterization with diffusion-weighted echo- planar MR imaging. Radiology 1997;204:739-744
4. Taouli B, Vilgrain V, Dumont E, Daire J, Fan B, Menu Y.
Evaluation of liver diffusion isotrophy and characterization of focal hepatic lesions with two single-shot echo-planar MR imaging sequences: prospective study in 66 patients. Radiology 2003;226:71-78
5. Bruegel M, Holzapfel K, Gaa J, et al. Characterization of focal liver lesions by ADC measurements using a respiratory triggered diffusion-weighted single-shot echo-planar MR imaging technique. Eur Radiol 2008;18:477-485
6. Parikh T, Drew SJ, Lee VS, et al. Focal liver lesion detection and characterization with diffusion weighted MR imaging:
comparison with standard breath-hold T2-weighted imaging.
Radiology 2008;246:812-822
7. Taouli B, Koh DM. Diffusion-weighted MR imaging of the liver.
Radiology 2010;254:47-66
8. Goshima S, Kanematsu M, Kondo H, et al. Hepatic hemangioma: correlation of enhancement types with diffusion- weighted MR findings and apparent diffusion coefficients. Eur J Radiol 2009;70:325-330
9. Vossen JA, Buijs M, Liapi E, Eng J, Bluemke DA, Kamel IR.
Receiver operating characteristic analysis of diffusion-weighted magnetic resonance imaging in differentiating hepatic hemangiomas from other hypervascular liver lesions. J Comput Assist Tomogr 2008;32:750-756
10. Feuerlein S, Pauls S, Juchems MS, et al. Pitfalls in abdominal diffusion weighted imaging: how predictive is restricted water diffusion for malignancy. AJR Am J Roentgenol 2009;193:1070-1076
11. Nam SJ, Park KY, Yu JS, Chung JJ, Kim JH, Kim KW. Hepatic cavernous hemangiomas: relationship between speed of intratu- moral enhancement during dynamic MRI and apparent diffusion coefficient on diffusion-weighted imaging. Korean J Radiol 2012;13:728-735
12. Yamada I, Aung W, Himeno Y, Nakagawa T, Shibuya H.
Diffusion coefficients in abdominal organs and hepatic lesions:
evaluation with intravoxel incoherent motion echo-planar MR imaging. Radiology 1999;210:617-623
13. Le Bihan D, Breton E, Lallemand D, Aubin ML, Vignaud J, Jeantet ML. Separation of diffusion and perfusion in intravoxel incoherent motion MR imaging. Radiology 1988;168:497-505 14. Le Bihan D, Turner R, MacFall JR. Effects of intravoxel incoher-
ent motions (IVIM) in steady-state free precession (SSFP) imaging: application to molecular diffusion imaging. Magn Reson Med 1989;10:324-337
15. Luciani A, Vignaud A, Cavet M, et al. Liver cirrhosis: intravoxel incoherent motion MR imaging-pilot study. Radiology 2008;249:891-899
16. Turner R, Le Bian D, Maier J, Vavrek R, Hedges LK, Pekar J.
Echo-planar imaging of intravoxel incoherent motions.
Radiology 1990;177:407-414
17. Dixon WT. Separation of diffusion and perfusion in intravoxel incoherent motion MR imaging: a modest proposal with tremen- dous potential. Radiology 1988;168:566-567
18. Yoon JH, Lee JM, Yu MH, Kiefer B, Han JK, Choi BI.
Evaluation of hepatic focal lesions using diffusion-weighted MR imaging: comparison of apparent diffusion coefficient and intravoxel incoherent motion-derived parameters. J Magn Reson Imaging 2014;39:276-285
19. Ichikawa S, Motosugi U, Ichikawa T, Sano K, Morisaka H, Araki T. Intravoxel incoherent motion imaging of focal hepatic lesions. J Magn Reson Imaging 2013;37:1371-1376
20. Patel J, Sigmund EE, Rusinek H, Oei M, Babb JS, Taouli B.
Diagnosis of cirrhosis with intravoxel incoherent motion diffusion MRI and dynamic contrast enhanced MRI alone and in
combination: preliminary experience. J Magn Reson Imaging 2010;31:589-600
21. Koh DM, Collins DJ, Orton MR. Intravoxel incoherent motion in body diffusion-weighted MRI: reality and challenges. AJR Am J Roentgenol 2011;196:1351-1361
22. Woo S, Lee JM, Yoon JH, Joo I, Han JK, Choi BI. Intravoxel incoherent motion diffusion-weighted MR imaging of hepatocel- lular carcinoma: correlation with enhancement degree and histologic grade. Radiology 2014;270:758-767
23. Yu JS, Kim MJ, Kim KW. Intratumoral blood flow in cavernous hemangioma of the liver: radiologic-pathologic correlation.
Radiology 1998;208:549-550
24. Yamashita Y, Ogata I, Urata J, Takahashi M. Cavernous hemangioma of the liver: pathologic correlation with dynamic CT findings. Radiology 1997;203:121-125
통신저자 : 양달모, (134-727) 서울시 강동구 상일동 149, 강동경희대학교병원 영상의학과
Tel. (02) 440-6183 Fax. (02) 440-6932 E-mail: [email protected]
간혈관종의 조영증강속도와 복셀내비결집운동 MR영상과의 상관관계
1강동경희대병원 영상의학과
2경희대학교 생체의공학과
양달모1∙장건호1∙김현철1∙김상원1∙김혁기2
목적: 조영증강 MRI에서의 간혈관종의 조영증강속도와 겉보기확산계수 및 복셀내비결집운동 MR영상에서의 여러가 지 지표인, 진성 확산계수 (D), 관류계수 (f), 가성 확산계수 (D*), 겉보기확산계수 (ADCfit)와의 상관관계를 알아보 고자 하였다.
대상과 방법: 후향적인 연구로 IRB 승인을 받았다. 39명 환자에서 47개의 간혈관종을 연구대상으로 하였다. 이 중 남자가 20명 여자가 19명이었다. 간혈관종은 조영증강후 시행한 T1 강조영상에서의 조영증강 속도에 따라서 3가지 형으로 분류하였고, 빠른 조영증강을 보이는 간혈관종은 A형, 중간정도는 B형, 느린 조영증강을 보이는 경우는 C형 으로 하였다. D, f, D* and ADCfit값을 구하여 3가지형의 간혈관종 간에 차이를 비교하였다.
결과: ADCfit와 D 값은 C형의 간혈관종이 A형의 간혈관종보다 유의하게 낮았다 (P = 0.0022, P = 0.0085). 하 지만 f 와 D* 값은 세 군간에 차이가 없었다. 모든 b값에서의 (50, 200, 500 and 800 sec/mm2) 겉보기확산계수 값은 C형이 A형에 비해 유의하게 낮았다 (P < 0.012). 그리고 b값이 800 sec/mm2에서 C형의 겉보기확산계수 값 이 B형보다 유의하게 낮았다 (P = 0.0021). 하지만 다른 b 값에서는 A형과 B형, B형과 C형 간의 차이는 없었다 (P > 0.016). 간혈관종의 조영증강 속도와 각 b 값에서의 겉보기확산계수 값 ADC50(ρ= -0.357, P = 0.014), ADC200 (ρ= -0.537, P = 0.0001), ADC500 (ρ= -0.614, P = 0.0001), ADC800(ρ= -0.607, P = 0.0001)과는 부적 상관관계 (negative correlation)를 보였다. 따라서 ADC50, ADC200, ADC500, and ADC800 에서의 겉보기확산계수 값은 조영증강속도가 느릴수록 감소하는 경향을 보였다.
결론: 간혈관종은 조영증강 속도에 따라 다양한 겉보기확산계수 값을 보이고, 느린 조영증강을 보이는 간혈관종이 감 소된 겉보기확산계수 값을 보이는 것은 진성 분자확산과 관계가 있다.
대한자기공명의과학회지 18:208-218(2014)