• 검색 결과가 없습니다.

Comparison of Muscle Mass Indexes According to Protein Intake in Obese Patients

N/A
N/A
Protected

Academic year: 2021

Share "Comparison of Muscle Mass Indexes According to Protein Intake in Obese Patients"

Copied!
10
0
0

로드 중.... (전체 텍스트 보기)

전체 글

(1)

pISSN 2383-899X eISSN 2234-7631

Introduction

Obesity is a disease in which body fat excessively accumulates to the extent that health is negatively affected.

1

Obesity is reported to be associated with diseases including diabetes, hypertension, hypercho- lesterolemia, asthma, arthritis, heart disease, stroke, endometrial cancer, breast cancer, and colorectal cancer.

2,3

According to a 2014 report by the World Health Organization (WHO), the obese popula- tion has more than doubled since 1980, and now comprises approxi- mately 13% of the global adult population (11% and 15% of the male and female populations, respectively).

3

This is also the case in Korea, where the obese population is steadily increasing at a higher rate than that noted previously. In 2013, the prevalence of adult obesity, defined as body mass index (BMI) ≥ 25 kg/m

2

, was approximately

32.5% (37.6% for men and 27.5% for women). Hence, a third of the Korean adult population is obese.

4

Generally, BMI and waist circumference are used as indexes for obesity.

1

Obesity is defined as a BMI ≥30 kg/m

2

in Western coun- tries

1

and ≥ 25 kg/m

2

in Asia-Pacific countries

5

; the latter definition is used in Korea. Additionally, waist circumference and waist-hip ra- tio are used as indexes for abdominal obesity.

6

The Korean Society for the Study of Obesity gives the definition of abdominal obesity as waist circumference ≥90 cm for men and ≥85 cm for women.

7

BMI does not provide information regarding body fat mass or fat-free mass

8

, but recent studies have reported that metabolic syndrome is associated with body fat and fat-free masses.

9

Of several body com- position measures, fat-free mass in particular has an inverse J- shaped association with all-cause mortality, and the level of fat-free

Comparison of Muscle Mass Indexes According to Protein Intake in Obese Patients

Mingyeong Heo, Yeonjoo Lee, Yongsoon Park*

Department of Food and Nutrition, Hanyang University, Seoul, Korea

Background: Protein is the most important nutrient for the muscle synthesis and maintenance of muscle mass. However, there have been no studies comparing muscle mass indexes according to protein intake in obese patients. Thus, the present study investigated the hypothesis that high protein intake positively affected muscle mass indexes in obese patients.

Methods: Male (n=50) and female (n=30) obese patients were recruited. Each sex was divided into 2 groups according to their protein intake.

Dietary intake, fat-free mass, appendicular skeletal muscle mass, appendicular skeletal muscle mass/height

2

, skeletal muscle index, total bone area, bone mineral count, bone mineral density, total cholesterol, low density lipoprotein cholesterol, high density lipoprotein cholesterol, inter- leukin-6, tumor necrosis factor α, smoking, alcohol, and exercise were assessed.

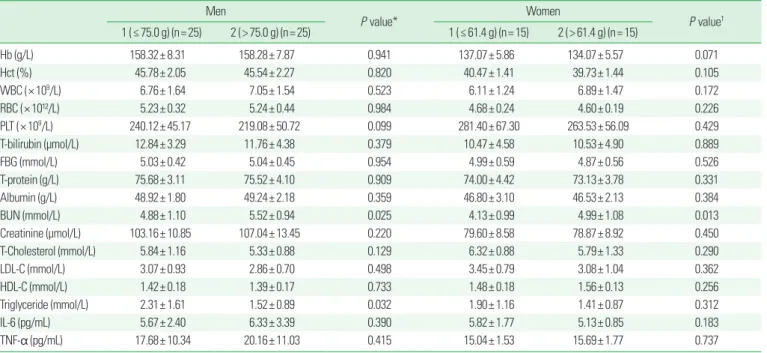
Results: Fat-free mass, appendicular skeletal muscle mass, and appendicular skeletal muscle mass/height

2

were significantly higher in obese men in the higher protein intake group, while serum triglyceride was significantly lower in the same group. However, bone indexes and inflam- matory cytokines according to protein intake were not significantly different in obese men. Fat-free mass, bone indexes, muscle indexes, blood lipid profiles, and inflammatory cytokines were not significantly different according to protein intake in obese women.

Conclusion: In this population, increasing protein intake may positively affect fat-free mass, appendicular skeletal muscle mass, appendicular skeletal muscle mass/height

2

, and serum triglyceride in obese men. Therefore, additional studies may be necessary to identify the appropriate level of protein intake required to prevent a decrease in muscle mass, and increase muscle mass in obese patients.

Key words: Protein intake, Muscle mass indexes, Obese patients, Fat-free mass, Appendicular skeletal muscle mass, Appendicular skeletal muscle mass/height

2

*Corresponding author Yongsoon Park http://orcid.org/0000-0001-5110-5716 Department of Food and Nutrition, Hanyang University, 222 Wangsimni-ro, Seongdong-gu, Seoul 04763, Korea

Tel +82-2-2220-1205 Fax +82-2-2292-1226 E-mail yongsoon@hanyang.ac.kr Received Feb. 29, 2016 Reviewed Mar. 25, 2016 Accepted Apr. 7, 2016

Copyright © 2016 Korean Society for the Study of Obesity

This is an Open Access article distributed under the terms of the Creative Commons Attribution Non-Commercial License (http://creativecommons.org/licenses/by-nc/4.0/) which permits unrestricted non-commercial use, distribution, and reproduction in any medium, provided the original work is properly cited.

(2)

mass has been suggested as a predictor of the all-cause mortality rate.

10

Previous studies have reported sex, age, height, weight, and exercise and dietary habits to be factors that affect fat-free mass.

11-15

A number of studies on fat-free mass in obesity have been con- ducted to investigate a high-protein diet and the maintenance of fat- free mass; these studies seem to show that a high-protein diet may help obese people maintain fat-free mass.

16-20

However, diverse pro- tein levels and various intervention periods were used in the litera- ture

15

, and some studies have reported that a high-protein diet was ineffective in maintaining fat-free mass.

21,22

Aside from the effect of fat-free mass maintenance, a high-protein diet in obesity was also found to be effective in improving body composition by reducing body weight and body fat mass, improving blood lipid composition by decreasing serum triglycerides and increasing high density lipo- protein cholesterol (HDL-C)

20,21

, and reducing the levels of inflam- matory cytokines such as interleukin-6 (IL-6) and tumor necrosis factor alpha (TNF-α).

22

However, bone mineral density, bone miner- al count, and bone metabolic index were not affected by protein in- take level.

16,23

Previous studies on fat-free mass were interventional research in- vestigations of high-protein intake and fat-free mass maintenance in obese people on a low calorie diet to reduce body weight. Cross-sec- tional studies have never been conducted to compare muscle mass indexes according to protein intake level. Therefore, in the present study we hypothesized that muscle mass index would differ in obese people depending on their protein intake level. We compared fat-free mass and muscle mass indexes by protein intake level in obese men and women who were not on a low calorie diet. We additionally ex- amined bone indexes, blood lipid composition, and the level of in- flammatory cytokines according to protein intake level.

Methods

1. Study participants

Obese adults (aged between 19 and 65 years) with a BMI ≥ 25 kg/

m

2

or waist circumference ≥90 cm for men and ≥85 cm for women were recruited through newspaper advertisements between May and July 2014. Of those interested in the study, breastfeeding or pregnant women were excluded. Additional exclusion criteria were as follows:

weight reduction of 10% or more in the last 3 months, having taken a pharmaceutical product (e.g. anti-obesity or lipid-lowering drugs) or

health foods that may affect weight within the last 4 weeks, treat- ment with antipsychotic medication within the last 2 months, histo- ry of drug or alcohol abuse, acute severe cardiovascular disease (e.g.

heart failure, myocardial infarction, or stroke), current or previous immune system disease, severe liver or kidney failure, previous gas- trointestinal surgery (with exceptions of simple appendectomy and hernia repair surgery), and participation in another study within the last 2 months. Lastly, exclusion criteria based on clinical laboratory test results were as follows: serum creatinine ≥176.8 μmol/L, systolic blood pressure ≥180 mmHg, and diastolic blood pressure ≥110 mmHg. Of the 133 obese adults initially recruited, 53 were excluded after screening and a final total of 80 subjects (50 men and 30 wom- en) participated in the study. The study was approved by Hanyang University Institutional Review Board (HY-14-041), and was con- ducted according to the Declaration of Helsinki. All participants signed a written consent form.

2. Procedure

1) Anthropometric measurements and body composition measures

Height was measured using a stadiometer (Aluminum Extensim- eter for Physical Examination, Samhwa Instrument, Seoul, Korea), and weight was measured using a body composition analyzer (Slim- Manager-N40, Aiia Communication Inc., Seongnam, Korea). Waist circumference was measured around the navel at the end of expira- tion while the participant breathed naturally, and the measurement was performed 3 times. Hip circumference was also measured 3 times, horizontally around the most protruding area of the buttocks from a lateral view. Lastly, dual energy X-ray absorptiometry (DEXA; Discovery-W, Hologic Corporation, Bedford, Massachu- setts, USA) was used to measure body fat (BF; kg), fat-free mass (FFM; kg), total bone area (cm

2

), bone mineral count (BMC; g), and bone mineral density (BMD; g/cm

2

).

BMI was calculated by dividing weight by squared height, and waist-hip ratio (WHR) was measured by dividing waist circumfer- ence by hip circumference. In addition, the following indexes were calculated to assess differences in fat-free mass: appendicular skeletal muscle mass (ASM; kg), which was obtained by adding arm and leg muscle masses, relative appendicular skeletal muscle mass (ASM/

height

2

; kg/m

2

), which was obtained by dividing ASM by squared

height, and skeletal muscle index (SMI; %) which was obtained by

(3)

dividing muscle mass by weight and multiplying the quotient by 100.

2) Blood biochemical measures

Blood was drawn after the participant had fasted for at least 12 hours and the blood sample was sent to the Korea Biomedical Labo- ratory for analysis. Hemoglobin (Hb), hematocrit (Hct), white blood cell count (WBC), red blood cell count (RBC), and platelets (PLT) were measured using an automatic hematology analyzer (Sysmex XT-1800i, Sysmex, Kobe, Japan). In addition, total bilirubin (T-bili- rubin), fasting blood glucose (FBG), total protein (T-protein), albu- min, blood urea nitrogen (BUN), creatinine, total cholesterol (T- cholesterol), low density lipoprotein cholesterol (LDL-C), HDL-C, and triglycerides were measured using an automatic chemistry ana- lyzer (Hitachi automatic analyzer 7170, Hitachi, Tokyo, Japan).

Lastly, IL-6 and TNF-α were analyzed using a Bio-Plex Protein Array system (Bio-Rad, Hercules, California, USA) with a micro- plate reader system (Bio-Plex Array Reader, Bio-Rad) and Bio-Plex Manager software.

3) Survey of general characteristics and health habits

Blood pressure was measured using a blood pressure monitor (Omron HEM-7051, Omron Healthcare, Kyoto, Japan) with the arm elevated at the level of the heart while the participant rested for at least 5 minutes without making any sudden movements. With re- gard to health habits, current drinking and smoking statuses and ex- ercise habits were surveyed. For exercise habits, participants were asked whether or not they consistently performed intensive work- outs during leisure time that would make them out of breath or in- crease their heart rate (e.g., jogging, gymnastics, aerobics, badmin- ton, table tennis, bowling, cycling, swimming, golf, volleyball, jump- ing rope, hiking, running, soccer, basketball, squash, and tennis) for 10 minutes or longer at least once a week.

4) Intakes of macronutrients and food groups

Participants were trained on how to write a dietary record, and were asked to keep a 3-dayfood record on their intake of macronutri- ents and food groups for 2 weekdays and a weekend day. The dietary records were analyzed using a nutritional assessment program (Com- puter Aided Nutritional Analysis for Professionals, CAN Pro, Ver 4.0, Korean Society of Nutrition, Seoul, Korea), and the mean values com- puted over 3 days were analyzed statistically.

3. Statistical analysis

All statistical analyses were performed using SPSS 21.0 (SPSS, Inc., Chicago, IL, USA). For each variable, all descriptive statistics were presented as the mean and standard deviation (in the format of mean±standard deviation) and percentage. Continuous variables were tested by performing an independent t-test, and nominal vari- ables were tested by performing a chi-square test after the data were cross-tabulated. Male and female participants were each divided into 2 groups with the median value of the daily average protein intake as the cut-off; an analysis of covariance (ANCOVA) was conducted to compare the 2 groups within each sex. In the ANCOVA, age and ex- ercise habit were adjusted in the analysis of body composition, and age, BMI, and exercise habit were adjusted in the analysis of blood biochemical measures. Furthermore, energy intake was adjusted in the analysis of the intake of macronutrients and major protein sourc- es by food group. Statistical significance was defined as a P value less than 0.05.

Results

1. General characteristics

Participants’ general characteristics are summarized by sex in Ta- ble 1. Out of a total of 80 participants, 50 were men and 30 were women. The mean age, arm, leg, and trunk fat masses, and total body fat mass were significantly higher in women than in men. In contrast, men had significantly higher measurements than women for the following: height, weight, systolic and diastolic blood pres- sures, arm, leg, and trunk fat-free masses as well as total fat-free mass, ASM, ASM/height

2

, skeletal muscle index, total bone area, bone mineral count, and bone mineral density. More men were smokers and drinkers, but more men exercised at least once a week compared to women. Additional analyses conducted to compare the intakes of energy and macronutrients showed that men had signifi- cantly higher energy, protein, and lipid intakes. No significant sex differences were found in BMI, waist and hip circumferences, waist- hip ratio, or carbohydrate intake.

2. Body composition

Participants of each sex were divided into 2 groups according to

the sex-specific median value of daily protein intake as a cut-off

point, i.e., group 1 participants consumed a sub-median level of pro-

(4)

tein (men: 0.76 g/BW kg/day, women: 0.65 g/BW kg/day), and group 2 consumed more than the median amount of protein (men: 1.08 g/

BW kg/day, women: 1.11 g/BW kg/day) (Table 2). Comparison of body compositions between the groups defined according to protein intake level showed the following results. In men, arm and leg fat- free masses, total fat-free mass, ASM, and ASM/height

2

were signifi- cantly higher in group 2 than in group 1. However, BMI, waist and

hip circumferences, waist-hip ratio, arm, leg, and trunk fat masses, total body fat mass, trunk fat-free mass, skeletal muscle index, total bone area, bone mineral count, and bone mineral density did not show significant differences between the groups. In women, none of the body composition measures were significantly different between groups 1 and 2.

3. Blood biochemical measures

Sex-specific comparison of blood biochemical measures between group 1 and 2 showed the following results (Table 3). In men, BUN was significantly higher and triglycerides significantly lower in group 2 than group 1. Aside from those, there were no significant differences between the groups in any of Hb, Hct, WBC, RBC, PLT, T-bilirubin, FBG, T-protein, albumin, creatinine, T-cholesterol, LDL-C, HDL-C, IL-6, or TNF-α. In women, BUN was significantly higher in group 2 than group 1. In contrast, no significant difference between the groups was found in any of the following measures: Hb, Hct, WBC, RBC, PLT, T-bilirubin, FBG, T-protein, albumin, creati- nine, T-cholesterol, LDL-C, HDL-C, triglycerides, IL-6, and TNF-α.

4. Intake of macronutrients and major protein sources The results of the analysis on the intake of macronutrients and major protein sources according to protein intake level are as follows (Table 4). In male participants, the percentage of energy from carbo- hydrates was significantly higher in group 1 than in group 2, where- as the percentage of energy from total protein, animal protein, total fat, and animal fat consumption was significantly higher in group 2 than in group 1. An analysis conducted to compare the consumption levels of major protein sources showed that male participants in group 2 consumed more grains and meat than those in group 1. No significant difference between the groups was found in the con- sumption of carbohydrates, plant protein and fat, beans, eggs, fish and shellfish, or milk and milk-based products. The analysis of fe- male consumption of nutrients and major protein sources revealed that the percentage of energy from carbohydrates was significantly higher in group 1 than in group 2, whereas the percentage of energy from protein and fat was significantly higher in group 2 than in group 1. Otherwise, there were no significant differences in the con- sumption of carbohydrates, total animal and plant protein, total ani- mal and plant fat, grains, meats, beans, eggs, fish and shellfish, or milk and milk-based products between groups 1 and 2. Lastly, pro- Table 1. Basic characteristics of obese men and women

Men (n= 50) Women (n= 30) P value

Age (year) 27.1± 6.6 36.4± 10.2 < 0.001

< 30, n (%) 11 (22.00) 22 (73.33) < 0.001

≥ 30, n (%) 39 (78.00) 8 (26.67)

Height (cm) 173.84± 5.68 160.63± 4.49 < 0.001

Weight (kg) 84.27± 7.77 72.08± 6.83 < 0.001

BMI (kg/m²) 27.85± 1.70 27.91± 2.05 0.890

WC (cm) 94.82± 5.23 92.74± 6.04 0.110

HC (cm) 105.05± 3.99 103.34± 3.95 0.065

WHR (%) 0.90± 0.04 0.90± 0.05 0.726

SBP (mmHg) 138.96± 11.09 127.13± 14.83 < 0.001

DBP (mmHg) 83.52± 9.95 78.30± 10.47 0.029

Body fat (kg)

Arm 2.74± 0.70 4.13± 0.83 < 0.001

Leg 4.65± 1.18 7.13± 1.72 < 0.001

Trunk 7.41± 2.01 9.77± 2.24 < 0.001

Total 14.87± 3.38 21.04± 4.14 < 0.001

Fat-free mass (kg)

Arm 8.37± 0.98 5.19± 0.70 < 0.001

Leg 21.40± 2.28 14.72± 1.57 < 0.001

Trunk 29.00± 2.53 22.58± 1.77 < 0.001

Total 58.77± 5.24 42.48± 3.63 < 0.001

ASM (kg) 29.77± 3.05 19.90± 2.07 < 0.001

ASM/height

2

(kg/m

2

) 9.84± 0.78 7.71± 0.67 < 0.001

SMI (%) 35.35± 2.19 27.65± 1.85 < 0.001

Total bone area (cm

2

) 2,204.5± 126.0 1,921.1± 121.4 < 0.001 BMC (g) 2,664.7± 265.8 2,164.6± 242.8 < 0.001 BMD (g/cm

2

) 1.21± 0.07 1.13± 0.09 < 0.001 Smoking, n (%) 20 (40.00) 1 (3.33) < 0.001 Alcohol, n (%) 43 (86.00) 14 (46.67) < 0.001 Exercise, n (%) 40 (80.00) 16 (53.33) 0.012 Energy (kcal) 1,906.5± 407.0 1,609.7± 380.6 0.002 Carbohydrate (g) 231.67± 56.45 229.48± 43.81 0.856

Protein (g) 76.43± 19.64 62.28± 20.75 0.003

Lipid (g) 62.83± 17.23 48.56± 19.69 0.001

Data are reported as means± SD for continuous variables and number (percentage) for categorical variables.

P values were analyzed by independent t-test or χ

2

test.

BMI, body mass index; WC, waist circumference; HC, hip circumference; WHR, waist

hip ratio; SBP, systolic blood pressure; DBP, diastolic blood pressure; ASM, appendicular

skeletal muscle mass; SMI, skeletal muscle index (skeletal muscle mass (kg)/weight

(kg)× 100); BMC, bone mineral count; BMD, bone mineral density; Exercise, ≥ once a

week.

(5)

Table 2. Body composition according to dietary protein intake in obese men and women

Men P value* Women

P value

1 (≤ 75.0 g) (n= 25) 2 (> 75.0 g) (n= 25) 1 (≤ 61.4 g) (n= 15) 2 (> 61.4 g) (n= 15)

BMI (kg/m²) 27.56± 1.45 28.14± 1.91 0.231 28.23± 2.32 27.58± 1.76 0.355

WC (cm) 93.92± 4.75 95.71± 5.63 0.247 92.94± 7.33 92.55± 4.65 0.907

HC (cm) 104.27± 3.97 105.84± 3.94 0.204 104.10± 3.65 102.57± 4.21 0.093

WHR (%) 0.90± 0.03 0.90± 0.04 0.617 0.89± 0.06 0.90± 0.05 0.384

Body fat (kg)

Arm 2.65± 0.66 2.82± 0.75 0.483 4.25± 0.95 4.02± 0.72 0.383

Leg 4.61± 0.92 4.69± 1.41 0.905 7.40± 1.95 6.86± 1.47 0.197

Trunk 7.31± 1.87 7.51± 2.17 0.700 10.28± 2.65 9.27± 1.67 0.178

Total 14.73± 2.70 15.02± 4.00 0.806 21.93± 4.86 20.14± 3.18 0.131

Fat-free mass (kg)

Arm 8.00± 0.78 8.73± 1.03 0.005 5.25± 0.59 5.12± 0.81 0.505

Leg 20.62± 1.75 22.18± 2.51 0.017 14.59± 1.66 14.84± 1.53 0.925

Trunk 28.43± 2.69 29.58± 2.27 0.108 22.67± 2.10 22.49± 1.44 0.631

Total 57.05± 4.65 60.50± 5.30 0.021 42.52± 3.96 42.45± 3.41 0.743

ASM (kg) 28.62± 2.30 30.91± 3.31 0.008 19.84± 2.08 19.96± 2.14 0.871

ASM/height

2

(kg/m

2

) 9.60± 0.52 10.08± 0.92 0.033 7.69± 0.57 7.72± 0.78 0.959

SMI (%) 34.89± 1.93 35.82± 2.36 0.140 27.30± 1.70 28.00± 1.98 0.332

Total bone area (cm

2

) 2,183.9± 121.1 2,225.2± 129.7 0.265 1,929.3± 141.8 1,913.0± 101.2 0.382

BMC (g) 2,599.2± 209.1 2,730.1± 302.6 0.086 2,140.5± 197.9 2,188.8± 285.8 0.726

BMD (g/cm

2

) 1.19± 0.07 1.22± 0.08 0.107 1.11± 0.06 1.14± 0.11 0.230

Data are reported as means± SD for continuous variables and number (percentage) for categorical variables.

*P values were analyzed by ANCOVA after adjusting for age and exercise in obese male;

P values were analyzed by ANCOVA after adjusting for age and exercise in obese female.

BMI, body mass index; WC, waist circumference; HC, hip circumference; WHR, waist hip ratio; ASM, appendicular skeletal muscle mass; SMI, skeletal muscle index (skeletal mus- cle mass (kg)/weight (kg)× 100); MFR, muscle to fat ratio; BMC, bone mineral count; BMD, bone mineral density.

Table 3. Blood biochemical measurements according to dietary protein intake in obese men and women

Men P value* Women

P value

1 (≤ 75.0 g) (n= 25) 2 (> 75.0 g) (n= 25) 1 (≤ 61.4 g) (n= 15) 2 (> 61.4 g) (n= 15)

Hb (g/L) 158.32± 8.31 158.28± 7.87 0.941 137.07± 5.86 134.07± 5.57 0.071

Hct (%) 45.78± 2.05 45.54± 2.27 0.820 40.47± 1.41 39.73± 1.44 0.105

WBC (× 10

9

/L) 6.76± 1.64 7.05± 1.54 0.523 6.11± 1.24 6.89± 1.47 0.172

RBC (× 10¹²/L) 5.23± 0.32 5.24± 0.44 0.984 4.68± 0.24 4.60± 0.19 0.226

PLT (× 10

9

/L) 240.12± 45.17 219.08± 50.72 0.099 281.40± 67.30 263.53± 56.09 0.429

T-bilirubin (μmol/L) 12.84± 3.29 11.76± 4.38 0.379 10.47± 4.58 10.53± 4.90 0.889

FBG (mmol/L) 5.03± 0.42 5.04± 0.45 0.954 4.99± 0.59 4.87± 0.56 0.526

T-protein (g/L) 75.68± 3.11 75.52± 4.10 0.909 74.00± 4.42 73.13± 3.78 0.331

Albumin (g/L) 48.92± 1.80 49.24± 2.18 0.359 46.80± 3.10 46.53± 2.13 0.384

BUN (mmol/L) 4.88± 1.10 5.52± 0.94 0.025 4.13± 0.99 4.99± 1.08 0.013

Creatinine (μmol/L) 103.16± 10.85 107.04± 13.45 0.220 79.60± 8.58 78.87± 8.92 0.450

T-Cholesterol (mmol/L) 5.84± 1.16 5.33± 0.88 0.129 6.32± 0.88 5.79± 1.33 0.290

LDL-C (mmol/L) 3.07± 0.93 2.86± 0.70 0.498 3.45± 0.79 3.08± 1.04 0.362

HDL-C (mmol/L) 1.42± 0.18 1.39± 0.17 0.733 1.48± 0.18 1.56± 0.13 0.256

Triglyceride (mmol/L) 2.31± 1.61 1.52± 0.89 0.032 1.90± 1.16 1.41± 0.87 0.312

IL-6 (pg/mL) 5.67± 2.40 6.33± 3.39 0.390 5.82± 1.77 5.13± 0.85 0.183

TNF-α (pg/mL) 17.68± 10.34 20.16± 11.03 0.415 15.04± 1.53 15.69± 1.77 0.737

Data are means± SD.

*P values were analyzed by ANCOVA after adjusting for age, BMI, and exercise in obese male;

P values were analyzed by ANCOVA after adjusting for age, BMI, and exercise in obese female.

Hb, hemoglobin; Hct, hematocrit; WBC, white blood cell; RBC, red blood cell; PLT, platelets; T-Bilirubin, total bilirubin; FBG, fasting blood glucose; T-Protein, total protein; BUN, blood

urea nitrogen; LDL-C, low density lipoprotein cholesterol; T-Cholesterol, total cholesterol; HDL-C, high density lipoprotein cholesterol; IL-6, interleukin 6; TNF-α, tumor necrosis factor α.

(6)

tein intake per kg of bodyweight was significantly higher in group 2 than in group 1 in male and female participants (men: 0.76 g/kg vs 1.08 g/kg, women: 0.65 g/kg vs 1.11 g/kg).

Discussion

In the study, we conducted comparative analysis of fat-free mass and muscle mass indexes, bone health parameters, serum lipid pro- files, and inflammatory cytokine levels of obese male and female adults, separated into 2 groups according to protein intake level. In male participants, arm and leg fat-free masses, total fat-free mass, ASM, and ASM/height

2

were significantly higher, and serum triglyc- erides were significantly lower in group 2 than in group 1. However, for female participants, we did not observe a significant difference between groups in fat-free mass index, muscle mass index, or serum lipid profile. Furthermore, in both male and female participants, there were no significant differences in bone health parameters and inflammatory cytokine levels between group 1 and group 2. The analyses on the consumption of macronutrients and major protein sources according to protein intake level showed that in men, the per- centage of energy from carbohydrates was significantly lower and the intakes of total protein, animal protein, total fat, animal fat, grains,

and meat were significantly higher in group 2 than that in group 1, whereas in women there were no significant differences in the intake of macronutrients or major protein sources between the groups.

Dietary protein requirements are described as the minimal level of protein necessary to maintain a short-term balance of nitrogen under controlled energy intake.

24

The daily recommended dietary allowance (RDA) of protein is 0.8 g/kg in the US.

25

When determining the RDA, it is important to consider that a certain amount of protein is directly used for structural and functional purposes, such as the growth, maintenance, and repair of bones and soft tissues, and the production of hormones, antibodies, and enzymes.

24

According to the Dietary Reference Intakes for Koreans (KDRI, 2015), the RDA of protein is 65 g and 55 g for men and women in their 20s, respectively, and 60 g and 50 g for men and women in their 30s to 50s, respectively.

26

In the present study, arm and leg fat-free masses, as well as total fat-free mass, were significantly higher in group 2 than in group 1 among obese adult males. This finding is due to the fact that fat-free mass increases as protein intake increases

27

; the rates of energy in- take from protein in this study were 18.32% and 15.78% for the male participants in group 2 and group 1, respectively. Studies by Lejeune et al.

28

and Westerterp-Plantenga et al.

29

have shown that a protein intake group (18%) maintained a higher level of fat-free mass than a Table 4. Intake of macronutrients and protein major sources food group according to dietary protein intake in obese men and women

Men P value* Women

P value

1 (≤ 75.0 g) (n= 25) 2 (> 75.0 g) (n= 25) 1 (≤ 61.4 g) (n= 15) 2 (> 61.4 g) (n= 15)

Energy (kcal)

1,653.2± 309.5 2,159.8± 329.8 < 0.001 1,300.2± 223.3 1,919.2± 212.2 < 0.001

Carbohydrate (% of energy)

54.75± 5.30 48.43± 7.43 0.001 62.94± 6.41 53.82± 6.02 < 0.001

Protein (% of energy)

15.78± 2.36 18.32± 3.13 0.002 14.29± 2.77 16.35± 2.25 0.033

Lipid (% of energy)

29.47± 4.18 33.25± 5.41 0.008 22.77± 6.02 29.83± 4.31 0.001

Carbohydrate (g) 215.41± 50.44 247.93± 58.41 0.063 202.40± 32.26 256.56± 36.93 0.742

Protein (g) 60.83± 9.75 92.04± 13.62 < 0.001 46.33± 11.17 78.23± 14.91 0.348

Plant protein (g) 27.15± 7.49 31.59± 10.64 0.283 24.94± 5.49 34.10± 8.04 0.927

Animal protein (g) 33.67± 10.05 60.45± 17.95 < 0.001 21.39± 9.33 44.13± 18.34 0.525

Lipid (g) 50.65± 8.99 75.00± 14.71 < 0.001 33.48± 12.15 63.63± 12.98 0.708

Plant lipid (g) 24.26± 8.34 30.45± 12.42 0.398 18.75± 7.81 32.23± 9.56 0.861

Animal lipid (g) 26.38± 9.74 44.56± 14.98 < 0.001 14.74± 7.59 31.39± 12.04 0.639

Grain (g) 226.75± 84.91 234.5± 72.16 0.018 210.83± 38.79 255.44± 58.68 0.748

Beans (g) 24.61± 31.67 18.86± 27.23 0.225 21.69± 21.63 35.24± 38.81 0.414

Meats (g) 113.71± 50.03 226.12± 91.42 < 0.001 53.33± 33.48 130.40± 90.48 0.686

Eggs (g) 32.99± 22.30 55.68± 41.85 0.183 27.21± 33.98 46.63± 28.01 0.533

Seafood (g) 36.23± 38.09 37.09± 35.37 0.446 40.38± 52.05 43.34± 39.33 0.535

Milk and dairy products (g) 73.78± 93.81 122.93± 149.57 0.610 93.10± 100.35 175.10± 249.02 0.753

Data are means± SD.

*P-value were analyzed by ANCOVA after adjusting for energy in obese male;

P-value were analyzed by ANCOVA after adjusting for energy in obese female;

P-values were ana-

lyzed by independent t-test.

(7)

control group (15%), and studies by Tang et al.

17

and Leidy et al.

18

have reported a higher level of fat-free mass in a high protein intake group (1.4 g/kg) compared to a normal protein intake group (0.8 g/

kg), all of which are consistent with the findings of the present study.

ASM, ASM/height

2

, and skeletal muscle index, which we exam- ined in relation to fat-free mass, are typically used to differentiate sarcopenia from sarcopenic obesity in the elderly.

30,31

Sarcopenic obesity is a major risk factor for metabolic syndrome, and the risk of people with sarcopenic obesity developing metabolic syndrome is 12 times higher than those without sarcopenia and obesity. Therefore, sarcopenic obesity can be considered a major risk factor of metabolic syndrome, rather than sarcopenia or obesity alone.

32

Until now, re- search had not been conducted to address the prevention of sarcope- nic obesity in young obese adults; however, in the present study, ASM and ASM/height

2

were significantly higher for men in group 2 than for those in group 1. Additionally, in comparison with a study by Kim et al.

31

, ASM and ASM/height

2

were significantly higher among men in both groups 1 and 2 than in the control group, and, in particular, they were much higher in group 2. Therefore, additional research is warranted to investigate the effect of protein intake level on the prevention of sarcopenic obesity among young obese adults.

In women, however, neither fat-free mass nor muscle mass index differed with protein intake level. According to Tipton et al.

33

, male and female sex hormones affect muscle protein synthesis differently, and thus, we believe that the observed different patterns of protein intake and fat-free mass in men and women could be attributable to hormonal differences between the 2 sexes. In addition, we suspect that the number of female participants in the present study was too small and that the protein intake level was not high enough to show a difference in fat-free mass between the groups.

In the study, we did not find a significant difference in body fat mass depending on the protein intake level in either men or women.

However, in previous studies

20,21

that compared a high carbohydrate group (0.8 g/kg) and a high protein group (1.6 g/kg), body fat mass significantly decreased in the high protein group and the authors ar- gued that this was due to a low insulin response following a relative decrease in carbohydrate intake.

20

In men, the serum triglyceride level was significantly lower in group 2 than in group 1. It was within a normal range in group 2, whereas the level in group 1 was elevated compared to normal. In women, groups 1 and 2 did not show a significant difference in se-

rum triglyceride levels, but the level in group 1 was higher than nor- mal, showing the same trend as in men. In both sexes, the rate of en- ergy intake from fat was significantly lower and that from carbohy- drates significantly higher in group 2 than in group 1. The difference in the level of serum triglycerides seems to reflect the difference in carbohydrate intake in the diet.

34

According to a study by Kasim- Karakas et al.

35

, a low-fat high-carbohydrate diet increases the level of serum triglycerides. Our finding is also similar to the result re- ported by Westerterp-Plantenga et al.

29

; the group in which 18% of energy intake was from protein had a lower level of triglycerides in comparison to the control group in which 15% of energy intake was from protein.

The level of HDL-C was not significantly different in either sex between group 1 and group 2. However, Layman et al.

20,21

have shown that, HDL-C was maintained or significantly increased in the high-protein group (1.6 g/kg), but was not in high-carbohydrate group (0.8 g/kg). In the present study, protein intake level adjusted for weight was 0.76 g/kg and 1.08 g/kg for men groups 1 and 2, re- spectively, and 0.65 g/kg and 1.11 g/kg for women in groups 1 and 2, respectively, which are lower than levels described in previous stud- ies. Therefore, we suspect that a significant difference was not found in the HDL-C level between the groups due to the relatively low level of protein intake.

It has been suggested that obesity is detrimental to bone health be- cause inflammatory cytokines such as IL-6 and TNF-α increase in obesity, and they in turn increase bone resorption.

36

Moreover, IL-6 and TNF-α are independent predictors of cardiovascular disease.

37

In the present study, there was no significant difference between the groups in IL-6 or TNF-α for either sex, although Kitabchi et al.

22

re- ported a significant decrease of IL-6 and TNF-α in the high protein group (30%/kcal). In this study, the percentage of energy from pro- tein in groups 1 and 2, i.e., 15.78% vs 18.32% for men and 14.29% vs 16.35% for women, was lower than those in a previous study.

22

This may have resulted in an insignificant difference in inflammatory cy- tokines between the groups.

BUN level was significantly higher in group 2 than in group 1 in both sexes because BUN level reflects protein intake. This finding is consistent with that of Tang et al.

16

, who showed that BUN was high- er in the high protein intake group than the normal protein intake group.

In men, after adjustment for energy intake, the meat (animal-de-

(8)

rived foods) consumption level was higher in group 2 than in group 1, which suggests that the former group had a higher level of protein and fat intake. Furthermore, group 2 consumed more grains, indi- cating that they tended to consume more carbohydrates compared to group 1, although the difference between the 2 groups was not sig- nificant. In contrast, there was no significant energy-adjusted differ- ence between women in groups 1 and 2 in the consumption of major protein sources or macronutrients. Accordingly, the difference in protein intake in women was due to the difference in energy intake, and the significant difference in protein intake disappeared after the level was adjusted for energy intake.

The comparison of the daily average intake of macronutrients be- tween the Korean adult population and the study participants re- vealed the following. The daily average intake of carbohydrates among Korean adults is 340.5 g for men and 274.6 g for women, and thus, the study participants of both sexes consumed less than the daily average intake of the Korean adult population. With respect to protein, the daily average intake among Korean adults is 83.7 g and 61.3 g for men and women, respectively. Thus, for both sexes, group 2 of the present study had a higher daily average intake of protein than the Korean adult population. Finally, with respect to fat, the daily average intake by Korean adults is 56.9 g and 42.2 g for men and women, respectively, and again, in both sexes, group 2 of the present study had a higher daily average intake of fat than the Kore- an adult population.

38

This study was a cross-sectional study with a small sample size, and we found differences in fat-free mass and muscle mass indexes according to protein intake in men but not in women. Hence, it is difficult to generalize the study findings. Moreover, the 3-day di- etary journals used to investigate nutritional intake were completed by the study participants themselves, who may have underestimated the intake of total energy, macronutrients, and major dietary protein sources. Furthermore, there were not many survey questions regard- ing exercise, and thus, information about exercise habits may not have been fully captured.

The present study found that in men, fat-free mass, ASM, ASM/

height

2

, and serum triglycerides were significantly different between groups defined by protein intake level, whereas in women there was no significant difference between the groups for any of the indexes.

Accordingly, we conclude that, of all dietary intakes, protein intake positively influenced fat-free mass, ASM, ASM/height

2

, and serum

triglycerides in obese men in our study. Based on the findings, addi- tional research should be conducted to investigate an appropriate level of protein intake necessary to prevent loss of muscle mass and further increase protein intake in obese people.

Conflicts of Interest

No author has any conflict of interest.

References

1. World Health Organization. Obesity: preventing and managing the global epidemic. Geneva: World Health Organization; 2000.

2. Mokdad AH, Ford ES, Bowman BA, Dietz WH, Vinicor F, Bales VS, et al. Prevalence of obesity, diabetes, and obesity-related health risk factors, 2001. JAMA 2003;289:76-9.

3. World Health Organization. Obesity and overweight. 2015 Jan [accessed 2015 Dec 16]; Available from: URL: http://www.who.

int/mediacentre/factsheets/fs311/en/

4. Korea Center for Disease Control and Prevention. Korea Health Statistics 2013: Korea National Health and Nutrition Examination Survey (KNHANES VI-1). Seoul: Korean Ministry of Health and Welfare; 2014.

5. World Health Organization. The Asia-Pacific perspective: Rede- fining obesity and its treatment. Melbourne: World Health Orga- nization; 2000.

6. World Health Organization. Waist circumference and waist-hip ratio. Geneva: World Health Organization; 2011.

7. Lee S, Park HS, Kim SM, Kwon HS, Kim DY, Kim DJ, et al. Cut- off points of waist circumference for defining abdominal obesity in the Korean population. Korean J Obes 2006;15:1-9.

8. Kyle UG, Schutz Y, Dupertuis YM, Pichard C. Body composition interpretation contributions of the fat-free mass index and the body fat mass index. Nutrition 2003;19:597-604.

9. Wang J, Rennie KL, Gu W, Li H, Yu Z, Lin X. Independent asso- ciations of body-size adjusted fat mass and fat-free mass with the metabolic syndrome in Chinese. Ann Hum Biol 2009;36:110-21.

10. Bigaard J, Frederiksen K, Tjønneland A, Thomsen BL, Overvad K, Heitmann BL, et al. Body fat and fat-free mass and all-cause mor- tality. Obes Res 2004;12:1042-9.

11. Kyle UG, Genton L, Slosman DO, Pichard C. Fat-free and fat

(9)

mass percentiles in 5225 healthy subjects aged 15 to 98 years. Nu- trition 2001;17:534-41.

12. Forbes GB. Stature and lean body mass. Am J Clin Nutr 1974;27:

595-602.

13. Forbes GB. Longitudinal changes in adult fat-free mass: influence of body weight. Am J Clin Nutr 1999;70:1025-31.

14. Votruba SB, Horvitz MA, Schoeller DA. The role of exercise in the treatment of obesity. Nutrition 2000;16:179-88.

15. Krieger JW, Sitren HS, Daniels MJ, Langkamp-Henken B. Effects of variation in protein and carbohydrate intake on body mass and composition during energy restriction: a meta-regression. Am J Clin Nutr 2006;83:260-74.

16. Tang M, Leidy HJ, Campbell WW. Regional, but not total, body composition changes in overweight and obese adults consuming a higher protein, energy-restricted diet are sex specific. Nutr Res 2013;33:629-35.

17. Tang M, Armstrong CL, Leidy HJ, Campbell WW. Normal vs.

high-protein weight loss diets in men: effects on body composi- tion and indices of metabolic syndrome. Obesity (Silver Spring) 2013;21:E204-10.

18. Leidy HJ, Carnell NS, Mattes RD, Campbell WW. Higher protein intake preserves lean mass and satiety with weight loss in pre- obese and obese women. Obesity (Silver Spring) 2007;15:421-9.

19. Layman DK, Boileau RA, Erickson DJ, Painter JE, Shiue H, Sather C, et al. A reduced ratio of dietary carbohydrate to protein im- proves body composition and blood lipid profiles during weight loss in adult women. J Nutr 2003;133:411-7.

20. Layman DK, Evans E, Baum JI, Seyler J, Erickson DJ, Boileau RA.

Dietary protein and exercise have additive effects on body com- position during weight loss in adult women. J Nutr 2005;135:

1903-10.

21. Layman DK, Evans EM, Erickson D, Seyler J, Weber J, Bagshaw D, et al. A moderate-protein diet produces sustained weight loss and long-term changes in body composition and blood lipids in obese adults. J Nutr 2009;139:514-21.

22. Kitabchi AE, McDaniel KA, Wan JY, Tylavsky FA, Jacovino CA, Sands CW, et al. Effects of high-protein versus high-carbohydrate diets on markers of β -cell function, oxidative stress, lipid peroxi- dation, proinflammatory cytokines, and adipokines in obese, pre- menopausal women without diabetes: a randomized controlled trial. Diabetes Care 2013;36:1919-25.

23. Luscombe ND, Clifton PM, Noakes M, Farnsworth E, Wittert G.

Effect of a high-protein, energy-restricted diet on weight loss and energy expenditure after weight stabilization in hyperinsulinemic subjects. Int J Obes Relat Metab Disord 2003;27:582-90.

24. Bilsborough S, Mann N. A review of issues of dietary protein in- take in humans. Int J Sport Nutr Exerc Metab 2006;16:129-52.

25. Trumbo P, Schlicker S, Yates AA, Poos M. Food and Nutrition Board of the Institute of Medicine, The National Academies. Di- etary reference intakes for energy, carbohydrate, fiber, fat, fatty ac- ids, cholesterol, protein and amino acids. J Am Diet Assoc 2002;

102:1621-30.

26. The Korean Nutrition Society. Dietary Reference Intakes for Kore- ans 2015 (KDRIs 2015). Seoul: Korean Ministry of Health and Welfare; 2015.

27. Geirsdottir OG, Arnarson A, Ramel A, Jonsson PV, Thorsdottir I.

Dietary protein intake is associated with lean body mass in com- munity-dwelling older adults. Nutr Res 2013;33:608-12.

28. Lejeune MP, Kovacs EM, Westerterp-Plantenga MS. Additional protein intake limits weight regain after weight loss in humans. Br J Nutr 2005;93:281-9.

29. Westerterp-Plantenga MS, Lejeune MP, Nijs I, Van Ooijen M, Ko- vacs EM. High protein intake sustains weight maintenance after body weight loss in humans. Int J Obes Relat Metab Disord 2004;

28:57-64.

30. Baumgartner RN. Body composition in healthy aging. Ann N Y Acad Sci 2000;904:437-48.

31. Kim TN, Yang SJ, Yoo HJ, Lim KI, Kang HJ, Song W, et al. Preva- lence of sarcopenia and sarcopenic obesity in Korean adults: the Korean sarcopenic obesity study. Int J Obes (Lond) 2009;33:885- 92.

32. Lu CW, Yang KC, Chang HH, Lee LT, Chen CY, Huang KC. Sar- copenic obesity is closely associated with metabolic syndrome.

Obes Res Clin Pract 2013;7:e301-7.

33. Tipton KD. Gender differences in protein metabolism. Curr Opin Clin Nutr Metab Care 2001;4:493-8.

34. Farnsworth E, Luscombe ND, Noakes M, Wittert G, Argyiou E, Clifton PM. Effect of a high-protein, energy-restricted diet on body composition, glycemic control, and lipid concentrations in overweight and obese hyperinsulinemic men and women. Am J Clin Nutr 2003;78:31-9.

35. Kasim-Karakas SE, Almario RU, Mueller WM, Peerson J. Changes

(10)

in plasma lipoproteins during low-fat, high-carbohydrate diets: ef- fects of energy intake. Am J Clin Nutr 2000;71:1439-47.

36. Cao JJ. Effects of obesity on bone metabolism. J Orthop Surg Res 2011;6:30.

37. Cesari M, Penninx BW, Newman AB, Kritchevsky SB, Nicklas BJ, Sutton-Tyrrell K, et al. Inflammatory markers and onset of cardio-

vascular events: results from the Health ABC Study. Circulation 2003;108:2317-22.

38. Korea Center for Disease Control and Prevention. Korea Health

Statistics 2014: Korea National Health and Nutrition Examination

Survey (KNHANES VI-2). Seoul: Korean Ministry of Health and

Welfare; 2015.

수치

Table 3. Blood biochemical measurements according to dietary protein intake in obese men and women

참조

관련 문서

The effect of Combined Exercise program on Body composition, Physical fitness and thickness of subcutaneous fat in. Obese

First, the rhythmic gymnastics exercise program improves the skeletal muscle mass of adult women in office workers and reduces body fat percentage,

The purpose of this study was to examine the effects of 8 weeks of Zumba dance exercise for obese middle-aged women on blood lipid index and vascular aging.. The subjects of

Therefore, this study aims to analyze the effects of Soru massage therapy on the following variables: fatigue, stress, and obesity-related indexes including weight, waist girth

Changes in the level of physical fitness of obese women who performed complex exercise were significantly different in muscle endurance,

2) In between-group comparison before and after elastic band exercise, a significant difference was found in the percentage of body fat, fat-free

Complete blood , white blood cell and platelet counts all showed statistically significantly differences (p&lt;0.05), as did. In other tests, PT and aPTT had

Fourth, for the sub-factors of personality traits according to weight lifters’ education, while there was a high difference in neuroticism and agreeableness