Young Il Cho1, Hae-Young Kim2,*
1Department of Psychology, Sungshin Women’s University, Seoul, Korea
2Department of Health Policy Management, College of Health Science & Department of Public Health Sciences, Graduate School, Korea University, Seoul, Korea
Review Article
J Periodontal Implant Sci 2015;45:2-7 http://dx.doi.org/10.5051/jpis.2015.45.1.2
A fundamental problem in analyzing complex multilevel-structured periodontal data is the violation of independency among the observations, which is an assumption in traditional statistical models (e.g., analysis of variance and ordinary least squares regression). In many cases, aggregation (i.e., mean or sum scores) has been employed to overcome this problem.
However, the aggregation approach still exhibits certain limitations, such as a loss of power and detailed information, no cross-level relationship analysis, and the potential for creating an ecological fallacy. In order to handle multilevel-structured data appropriately, mixed ef- fects models have been introduced and employed in dental research using periodontal data. The use of mixed effects models might account for the potential bias due to the vio- lation of the independency assumption as well as provide accurate estimates.
Keywords: Linear models, Statistics, Statistical data interpretation.
Received: Jan. 14, 2015 Accepted: Jan. 15, 2015
*Correspondence:
Hae-Young Kim
Department of Health Policy and Management, College of Health Sciences, Korea University, 145 Anam-ro, Seongbuk-gu, Seoul 136-701, Korea E-mail: [email protected]
Tel: +82-2-3290-5667 Fax: +82-2-940-2849
INTRODUCTION
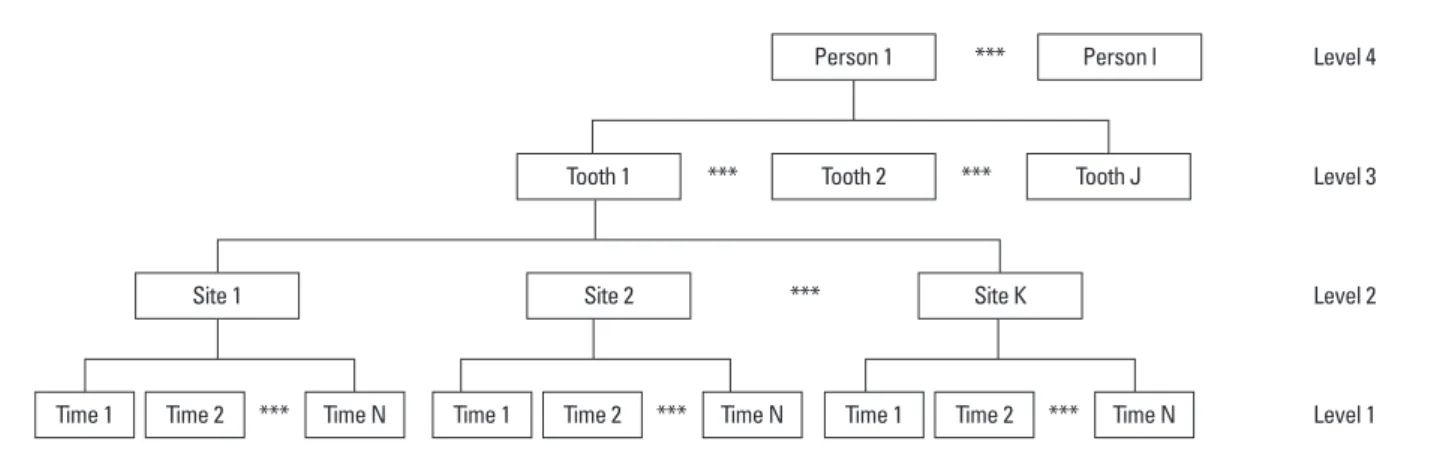
Generally, most of the data collected in dental research contain information on complex inherent structures. In order to assess an individual’s oral health status, a dentist must inspect the specific status of each tooth and its adjacent tissue unit. Because a person has multiple teeth and each tooth has multiple surfaces or sites, the resulting data innately contains a large volume of information on these complex structures [1-3]. This kind of multilevel-struc- tured data is commonly observed in various dental research fields such as restorative dentist- ry [4], orthodontics [5], or periodontics [2]. An example of the complex multilevel structure of periodontal data is shown in Fig. 1, which depicts a four-level structure containing time points (level 1), sites (level 2), teeth (level 3), and persons (level 4). Analysis of this complex multilevel-structured data has been challenging because many methodological problems need to be considered and resolved [6,7].
An erroneous approach: disaggregation
An important problem when analyzing multilevel-structured data is the inherent violation of the independency assumption on which many traditional statistical methods are based.
Teeth of a particular person share a common environment within the same oral cavity; there- fore, the health status of these teeth may be related to each other. In disaggregation, indi-
This is an Open Access article distributed under the terms of the Creative Commons Attribution Non-Commercial License (http://creativecommons.org/licenses/by-nc/3.0/).
viduals within a given dataset are approached as independent ob- servations. If the data has a multilevel structure, it is ignored. In this case, a traditional statistical model will be incorrectly applied to a multilevel-structured dataset. One example of this kind of error would be applying the traditional analysis of variance model to cor- relate the relationship of multiple observations such as the correla- tion of multiple implants from the same patient. From a practical perspective, collecting information on 100 implants from 40 pa- tients might require less effort and time than examining 100 im- plants from 100 patients would (assuming that each implant was randomly selected from each patient who might also have multiple implants). The amount of information collected from the 100 im- plants in 40 patients (correlated data) will likely be smaller than that from 100 implants in 100 patients (independent data). Therefore, if all other conditions are equal, the standard errors calculated from the correlated data will be larger than those from the independent data will be. In other words, if the correlated data is analyzed using the standard analytic methods that assume independence among individuals, a critical problem of underestimating the standard er- rors may lead to erroneously significant results.
The traditional approach: aggregation
In other cases, multilevel-structured dental data has frequently been treated as an aggregated form of averaged or summed scores.
In the field of periodontal research, the gingival index or periodontal index is computed as a mean score of multiple teeth and/or multiple sites. In addition, the degree of dental caries can be operationalized by the decayed, missing, and filled teeth (DMFT) index, which is the sum of the total number of decayed, missing, and filled teeth. How- ever, this aggregation method has demonstrated at least three short- comings. First, a substantial loss of power is inevitable because a small number of aggregated values are used in the data analysis. For instance, each patient has only one DMFT value in the data analysis, instead of all of their observed records on dental caries experienced in all of their teeth. Second, there might be a loss of detailed obser- vations. For example, a small number of deep pockets or a large number of shallow pockets can give the same averaged or summed periodontal index score, even though these data were obtained from
very different measures status. Similarly, a high DMFT index score may imply that either the patient has many decayed teeth or many treated, filled teeth, which are quite different conditions from the viewpoint of treatment requirements. Third, it is impossible to esti- mate the status or the change in any conditions at the lower level such as at the teeth level. For example, evaluating the effectiveness of a periodontal treatment based on a specific change to the peri- odontal status around a tooth is impossible when only an aggregat- ed score per subject is provided.
ANALYTIC METHODS FOR COMPLEX MULTILEVEL PERIODONTAL DATA
There are two general classes of approaches for analyzing data with a complex multilevel structure: the multilevel mixed effects model [8- 10] and the generalized estimating equation (GEE) approach [11]. A noteworthy difference between these two methods is whether the differences between persons have been explicitly modeled or not. A characteristic of correlated, multilevel-structured data is the existence of heterogeneity between higher level units (i.e., a difference between average values or average effects among certain groups/persons).
While the multilevel mixed effects model explicitly analyses the high- er unit-specific differences, the GEE method accounts for these dif- ferences implicitly by regarding them as an unwanted interference.
These two classes of models can be generalized to create models for continuous, binary, ordered, or counted outcomes.
To illustrate the main differences between these two classes of models, models for binary outcomes are exemplified below. The sim- plest form of a multilevel mixed effects model for a binary outcome can be obtained by introducing a random intercept, bj, which repre- sents the difference between higher level units (e.g., with the tooth as the first level and the person as the second level). The simplest multilevel mixed effects model is:
logit(Yij)=β0j+β1j Xij,
where, Yij is the outcome variable for j th individual’s ith tooth, β0j
is the intercept for j th individual, β1j is the slope for j th individual, Person 1
Tooth 1
Site 1
Time 1 Time 2 *** Time 1 Time 2 Time 1 Time 2
***
*** ***
***
*** ***
Time N Time N Time N
Site 2 Site K
Tooth 2 Tooth J
Person l Level 4
Level 3
Level 2
Level 1
Figure 1. The complex multilevel structure of a periodontal data.
and Xij is the predictor for j th individual’s ith tooth. According to the types of outcome variables, a link function (e.g., identity, log, or logit) can be used. In addition, various error covariance structures such as homogeneous, heterogeneous, or autocorrelated structures among residuals can be explicitly modeled to account for the error at the teeth level. Thus, the equation models the relation between the predictors and outcomes at the second level. The mixed effect models might represent associations between predictors and the binary outcome variable at the person level as well as at the teeth level. Specifically, the intercept and the effects of the predictors on the outcome variable at the teeth level are assumed to vary across the individual in a population [12,13]. The models at the second level can be expressed as:
β0j=γ00+u0j
β1j=γ10+u1j
where, γ00 and γ10 are the average intercept and slope at the pop- ulation level, respectively. Generally, the covariance structure among deviation scores at the person level is assumed to be normally dis- tributed. Those coefficients are referred to as fixed effects, which are interpreted as the population values. Additionally, u0j and u1j are the deviation scores from the average scores at the individual level.
Those coefficients are referred to as random effects that explicitly indicate the degree to which the intercept and slopes vary among persons. Because the two effects are combined in the single equa- tion and model, the model is referred to as the mixed effects model.
Finally, the magnitude of the design effects (i.e., the violation of in- dependence among these teeth) could be estimated by intraclass correlation. Intraclass correlation is the percentage of observed vari- ation in the outcome variable attributable to person-level character- istics. This percentage could be computed in an unconditional model.
On the other hand, the GEE approach for a binary outcome can be expressed as the following model:
logit(Yij)=β0*+β1* Xij,
where Yij is the outcome variable for j th individual’s ith tooth, β0* is the average intercept at the person level, β1* is the average slope at the person level, and Xij is the predictor for j th individual’s ith tooth. Additionally, link functions are selected depending on the type of outcome variable. The regression parameters in the GEE model represent population-averaged effects, and the GEE models the correlations or covariances among the teeth to account for the correlations evident between lower level units that exist within higher level units [12,14]. Researchers who employ the GEE are typ- ically interested in estimating the effects of predictors on outcome variables at the person level. Because the interest is at the person level, the covariance structures at the teeth level such as repeated or clustered observations could be reasonably modeled to estimate regression coefficients and the corresponding standard errors. De- ciding between these two models to analyze correlated (repeated or clustered) data may mainly depend on whether the effect of higher level units or population-averaged effects are of interest.
Table 1. Examples of published periodontal studies using multilevel mixed effects modeling.
Source Feature Contents
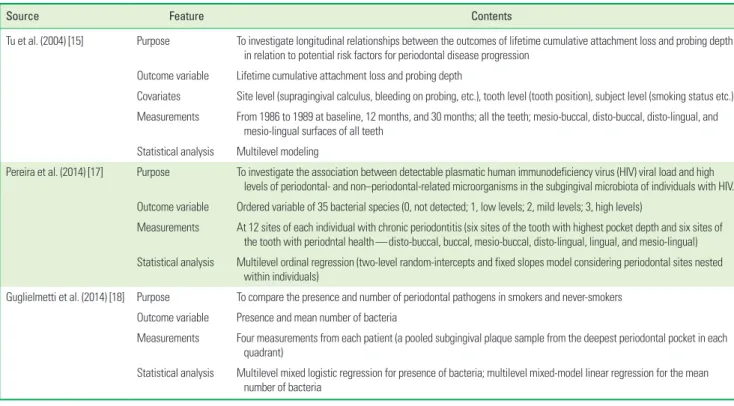
Tu et al. (2004) [15] Purpose To investigate longitudinal relationships between the outcomes of lifetime cumulative attachment loss and probing depth in relation to potential risk factors for periodontal disease progression
Outcome variable Lifetime cumulative attachment loss and probing depth
Covariates Site level (supragingival calculus, bleeding on probing, etc.), tooth level (tooth position), subject level (smoking status etc.) Measurements From 1986 to 1989 at baseline, 12 months, and 30 months; all the teeth; mesio-buccal, disto-buccal, disto-lingual, and
mesio-lingual surfaces of all teeth Statistical analysis Multilevel modeling
Pereira et al. (2014) [17] Purpose To investigate the association between detectable plasmatic human immunodeficiency virus (HIV) viral load and high levels of periodontal- and non–periodontal-related microorganisms in the subgingival microbiota of individuals with HIV.
Outcome variable Ordered variable of 35 bacterial species (0, not detected; 1, low levels; 2, mild levels; 3, high levels)
Measurements At 12 sites of each individual with chronic periodontitis (six sites of the tooth with highest pocket depth and six sites of the tooth with periodntal health—disto-buccal, buccal, mesio-buccal, disto-lingual, lingual, and mesio-lingual) Statistical analysis Multilevel ordinal regression (two-level random-intercepts and fixed slopes model considering periodontal sites nested
within individuals)
Guglielmetti et al. (2014) [18] Purpose To compare the presence and number of periodontal pathogens in smokers and never-smokers Outcome variable Presence and mean number of bacteria
Measurements Four measurements from each patient (a pooled subgingival plaque sample from the deepest periodontal pocket in each quadrant)
Statistical analysis Multilevel mixed logistic regression for presence of bacteria; multilevel mixed-model linear regression for the mean number of bacteria
Using the multilevel mixed effects model in periodontal research
Three noteworthy examples of periodontal research that applied the multilevel mixed effects model are introduced in Table 1. Tu et al. [15,16] investigated the longitudinal relationships between the outcomes lifetime cumulative attachment loss (LCAL) and probing depth in relation to potential risk factors for periodontal disease progression. The risk factors of interest included site-level factors (supragingival calculus, subgingival calculus, and bleeding on prob- ing), tooth-level factors (tooth position), and subject-level factors (number of sites with a LCAL>1 mm and smoking status). The mul- tilevel mixed effects model was applied, and the results revealed a linear relationship for tooth position and a significant effect for subgingival calculus and bleeding on probing with both LCAL and probing depth. Pereira et al. [17] explored the association between plasmic human immunodeficiency virus viral load and subgingival microbiota measured at 12 sites in each patient with chronic peri- odontitis (six sites from a tooth with the highest probing depth and six with a tooth in good periodontal health). A two-level model for an ordinal outcome variable was constructed with sites as the first level and persons as the second level. Last, Guglielmetti et al. [18]
aimed to compare the presence and number of periodontal patho- gens in smokers and never-smokers. Using four subgingival plaque samples collected from each person, the presence and number of bacteria were analyzed using the multilevel mixed model logistic regression and multilevel mixed model linear regression, respectively.
Using the generalized estimating equation in periodontal research
Abuhussein et al. [19] investigated factors associated with apop- tosis in serum, saliva, and gingival crevicular fluid (GCF) and their as- sociations with periodontal disease severity and activity. Clinical as- sessments such as those testing for gingivitis, measuring the number of deep pockets, and categorizing patients into mild or moderate/
severe chronic periodontitis groups were determined at six sites per tooth. In addition, the GCF sample was collected from the mesio-
buccal site of each tooth. To adjust for the correlated multiple mea- sures taken from each patient, the GEE was implemented. The out- comes of interest were the aforementioned clinical groups and the number of deep pockets. The main explanatory variables were the level of GCF DNA fragmentation and presence or absence of the apoptosis markers. In patients with chronic periodontitis, factors as- sociated with apoptosis in GCF were reported after adjustment for the multiple observations (in the mesio-buccal site of each tooth) that were performed in each patient.
Repeated measurements in a person or community Fig. 2 depicts the collection framework for a multilevel-struc- tured dataset with multiple repeated measurements taken at the person or community level. Table 2 lists specific examples of these kinds of data in periodontal research. Multiple repeated measures in the same individual are frequently used in an attempt to measure the variable accurately. For example, Monje et al. [20] measured the sinus lateral wall thickness in atrophic posterior maxillae at six dif- ferent sites in each patient; therefore, multiple repeated observa- tions were made at the person level (Fig. 2A). Because correlated repeated measures were made in the same person, a mixed effects model was applied to assess the effects of residual ridge height, sex,
Table 2. Published periodontal studies analyzing data with repeated sites and repeated time points.
Source Feature Contents
Monje et al. (2014) [20] Purpose To examine the sinus lateral wall thickness of atrophic posterior maxilla
Outcome variable Residual ridge height (RH, the distance from the alveolar crest up to the lowest points of the sinus floor) and lateral wall thickness (LWT, a perpendicular line at 3, 5, 7, 10, 13, and 15 mm from the lowest point of the sinus floor)
Measurements Six LWTs and one RH in millimeters from a maxillary sinus
Statistical analysis The mixed linear model was used to test the effect of sex, type of edentulism, etc., on LWT of the sinus
Vettore et al. (2013) [21] Purpose To estimate the prevalence and geographical distribution of periodontal disease and its association with contextual and individual social inequalities
Outcome variable Severity of periodontal disease (moderate, severe) using the community periodontal index and clinical attachment loss Explanatory variable Contextual characteristics of cities—human development index, gini index
Measurements Cross-sectional
Statistical analysis Multilevel logistic regression
Person 1
Site 1 Site 2 Site K
Person I Level 2
Level 1
***
*** ***
A
Community 1
Person 1 Person 2 Person I
Community L Level 2
Level 1
***
*** ***
B Figure 2. Depiction of repeated measurements (A) at multiple sites in a single individual (person level) and (B) in multiple individuals in a community (com- munity level).
and age on sinus lateral wall thickness. After consideration of the repeated measurements, the authors found that sinus lateral wall thickness was influenced by residual ridge height, the presence of teeth, and age.
The multilevel structure is a general phenomenon in data obtained from society, which also has a natural, multilevel structure. Many aspects of the human society frequently form a multilevel struc- ture, (e.g., the four-level structure of students (level 1), classes (level 2), schools (level 3), and districts (level 4). Vettore et al. [21] investi- gated the prevalence and geographical distribution of periodontal disease and its association with contextual and individual social in- equalities. Contextual effects mean that a higher level (community level in the example) factor affects the relationship with the lower level (person level) factor and the outcome variables. In their study, social inequalities were assessed using the Human Development In- dex and the Gini Index of Income Inequality. A multilevel model was implemented to accommodate the multilevel structure of the data and evaluate the contextual relationship of periodontal dis- ease state (person-level variable) with the second-level variables.
The authors concluded that income inequality (the second-level, community variable) plays a significant role in the occurrence of severe periodontal disease (the first-level, personal variable).
CONCLUSION
A fundamental problem in analyzing complex multilevel-struc- tured periodontal data is the violation of independency among the observations. In order to handle multilevel-structured data appro- priately, the mixed effects models should be used. In doing so, the bias resulting from the violation of the independency assumption might be avoided and the estimates might be provided accurately.
CONFLICT OF INTEREST
No potential conflict of interest relevant to this article was re- ported.
ORCID
Young Il Cho http://orcid.org/0000-0003-3235-7613 Hae-Young Kim http://orcid.org/0000-0003-2043-2575
REFERENCES
1. Gilthorpe MS, Griffiths GS, Maddick IH, Zamzuri AT. An applica- tion of multilevel modelling to longitudinal periodontal research data. Community Dent Health 2001;18:79-86.
2. Gilthorpe MS, Griffiths GS, Maddick IH, Zamzuri AT. The applica- tion of multilevel modelling to periodontal research data. Com- munity Dent Health 2000;17:227-35.
3. Gilthorpe MS, Maddick IH, Petrie A. Introduction to multilevel modelling in dental research. Community Dent Health 2000;
17:222-6.
4. Gilthorpe MS, Mayhew MT, Bulman JS. Multilevel survival analy- sis of amalgam restorations amongst RAF personnel. Community Dent Health 2002;19:3-11.
5. Gilthorpe MS, Cunningham SJ. The application of multilevel, multivariate modelling to orthodontic research data. Community Dent Health 2000;17:236-42.
6. Hannigan A, Lynch CD. Statistical methodology in oral and dental research: pitfalls and recommendations. J Dent 2013;41:385-92.
7. Macfarlane TV, Worthington HV. Some aspects of data analysis in dentistry. Community Dent Health 1999;16:216-9.
8. Laird NM, Ware JH. Random-effects models for longitudinal data.
Biometrics 1982;38:963-74.
9. Mason WM, Wong GM, Entwistle B. Contextual analysis through the multilevel linear model. In: Leinhardt S, editor. Sociological methodology. San Francisco: Jossey-Bass; 1983. p.72-103.
10. Bolker BM, Brooks ME, Clark CJ, Geange SW, Poulsen JR, Stevens MH, et al. Generalized linear mixed models: a practical guide for ecology and evolution. Trends Ecol Evol 2009;24:127-35.
11. Liang KY, Zeger SL. Longitudinal data analysis using generalized linear models. Biometrika 1986;73:13-22.
12. Kim HY, Preisser JS, Rozier RG, Valiyaparambil JV. Multilevel anal- ysis of group-randomized trials with binary outcomes. Commu- nity Dent Oral Epidemiol 2006;34:241-51.
13. Diez Roux AV. A glossary for multilevel analysis. J Epidemiol Community Health 2002;56:588-94.
14. Hu FB, Goldberg J, Hedeker D, Flay BR, Pentz MA. Comparison of population-averaged and subject-specific approaches for ana- lyzing repeated binary outcomes. Am J Epidemiol 1998;147:694- 703.
15. Tu YK, Gilthorpe MS, Griffiths GS, Maddick IH, Eaton KA, Johnson NW. The application of multilevel modeling in the analysis of longitudinal periodontal data--part I: absolute levels of disease.
J Periodontol 2004;75:127-36.
16. Tu YK, Gilthorpe MS, Griffiths GS, Maddick IH, Eaton KA, Johnson NW. The application of multilevel modeling in the analysis of longitudinal periodontal data--part II: changes in disease levels over time. J Periodontol 2004;75:137-45.
17. Pereira VT, Pavan P, Souza RC, Souto R, Vettore MV, Torres SR, et al. The association between detectable plasmatic human immu- nodeficiency virus (HIV) viral load and different subgingival mi- croorganisms in Brazilian adults with HIV: a multilevel analysis. J Periodontol 2014;85:697-705.
18. Guglielmetti MR, Rosa EF, Lourencao DS, Inoue G, Gomes EF, De Micheli G, et al. Detection and quantification of periodontal pathogens in smokers and never-smokers with chronic periodon- titis by real-time polymerase chain reaction. J Periodontol 2014;
85:1450-7.
19. Abuhussein H, Bashutski JD, Dabiri D, Halubai S, Layher M, Klaus- ner C, et al. The role of factors associated with apoptosis in as- sessing periodontal disease status. J Periodontol 2014;85:1086- 95.
20. Monje A, Catena A, Monje F, Gonzalez-García R, Galindo-Moreno P, Suarez F, et al. Maxillary sinus lateral wall thickness and mor- phologic patterns in the atrophic posterior maxilla. J Periodontol 2014;85:676-82.
21. Vettore MV, Marques RA, Peres MA. Social inequalities and peri- odontal disease: multilevel approach in SBBrasil 2010 survey. Rev Saude Publica 2013;47 Suppl 3:29-39.