ISSN 2234-3806 • eISSN 2234-3814
http://dx.doi.org/10.3343/alm.2015.35.1.41
A Simple and Rapid Method Based on Liquid
Chromatography–Tandem Mass Spectrometry for the Measurement of α-L-Iduronidase Activity in Dried
Blood Spots: An Application to Mucopolysaccharidosis I (Hurler) Screening
Jeong Soo Yang, Ph.D.1, Hye Kyeong Min, M.S.1, Hyeon Ju Oh, M.S.2, Hye In Woo, M.D.2,3, Soo-Youn Lee, M.D.1,2,3, Jong-Won Kim, M.D.2,3, Junghan Song, M.D.4, and Hyung-Doo Park, M.D.2,3
Clinical Trial Center1, Clinical Research Institute, Samsung Medical Center, Seoul; Department of Laboratory Medicine and Genetics2, Samsung Medical Center, Seoul; Department of Laboratory Medicine and Genetics3, Sungkyunkwan University School of Medicine, Seoul; Department of Laboratory Medicine4, Seoul National University College of Medicine, Seoul National University Bundang Hospital, Seongnam, Korea
Background: We developed an analytical method to measure α-L-iduronidase (IDUA) ac- tivity in dried blood spots. This was achieved by using liquid chromatography coupled to tandem mass spectrometry (LC-MS/MS) with electrospray ionization in the positive ion mode.
Methods: Chromatographic separation was completed using mobile phase involving wa- ter-formic acid and acetonitrile-formic acid over 2.8 min of run time on a column with a Kinetex XB-C18 (Phenomenex, USA). The detection of column effluent was performed using a Xevo TQ-S triple quadrupole mass spectrometer (Waters, USA) in the multiple-re- action monitoring mode. This method was verified with blank and control samples at four activity levels: base, low, medium, and high. Control materials were provided from Centers for Disease Control and Prevention (CDC).
Results: Intra- and inter-day precisions were between 2.6% and 16.5% and between 7.9% and 17.0%, respectively. A correlative regression study on the IDUA activity in CDC- control samples performed to assess the validity of the developed method showed a highly significant linear association (r2=0.9976) between the calculated and CDC-reported val- ues and an obvious difference in activity among the four levels. This reliable analytical method was applied to mucopolysaccharidosis I (Hurler) screening of patients under treatment (n =4) and in normal controls (n =129). IDUA activity ranged from 8.98 to 77.12 µmol/hr/L) in normal controls, and patients undergoing medical treatment showed low IDUA activity.
Conclusions: This method had advantages of simplicity, rapid sample preparation, and liquid chromatographic separation, which efficiently inhibited ionization suppression in- duced by matrix effects in mass spectrometric detection.
Key Words: Iduronidase, Mass spectrometry, Mucopolysaccharidosis I
Received: November 6, 2013 Revision received: February 17, 2014 Accepted: October 2, 2014
Corresponding author: Hyung-Doo Park Department of Laboratory Medicine and Genetics, Samsung Medical Center, Sungkyunkwan University School of Medicine, 81 Irwon-ro, Gangnam-gu, Seoul 135-710, Korea
Tel: +82-2-3410-0290 Fax: +82-2-3410-2719 E-mail: [email protected]
© The Korean Society for Laboratory Medicine This is an Open Access article distributed under the terms of the Creative Commons Attribution Non-Commercial License (http://creativecom- mons.org/licenses/by-nc/3.0) which permits unrestricted non-commercial use, distribution, and reproduction in any medium, provided the original work is properly cited.
INTRODUCTION
Mucopolysaccharidosis type I (MPSI) is a lysosomal storage dis- ease caused by deficient or absent activity of the α-L-iduronidase (IDUA; EC 3.2.1.76) enzyme, which catalyzes the degradation of the glycosaminoglycans (GAGs), e.g., dermatan and heparan sulfates [1-3]. Mass spectrometry-based analytical methods have been used to screen MPSI by distinct values of IDUA en- zyme activity in bloods, i.e., dried blood spot (DBS) samples [4- 8]. The amount (mol) of product into which a synthesized/spiked substrate was cleaved during incubation with IDUA, was mea- sured and used to calculate enzyme activity. Early in method development, sample preparation prior to flow injection into a mass spectrometer (not coupled with liquid chromatographic separation) consisted of complex procedures. These included (1) extraction of enzyme from DBS by vortexing for 1 min and shak- ing for 45 min at 37°C; (2) 20- or 16-hr incubation to allow the reaction between the enzyme and substrate to occur; (3) reac- tion-quenching with sodium acetate; (4) liquid-liquid extraction (LLE) to eliminate polar interfering substances; and (5) drying under a stream of nitrogen and reconstitution of samples [4, 5].
Spacil et al. [6, 7] simplified sample preparation, i.e., without LLE, by employing mass spectrometric detection coupled with liquid chromatography (LC) to separate the product from poten- tial matrix interferences. In addition, Mechtler et al. [8] shortened
the incubation time to 3 hr by applying turbulent flow chroma- tography (TFC)-ultra high performance liquid chromatography- tandem mass spectrometry (UPLC-MS/MS). The two-dimen- sional LC was essential to minimize ionization suppression by matrix interference and, at the same time, to detect a smaller amount of product due to a shorter time of reactive incubation (3 hr vs. 16 hr). In the present study, we developed a novel tan- dem mass spectrometry (MS/MS) method to screen MPSI. The study was approved by the Institutional Ethics Committee of Samsung Medical Center.
METHODS
1. Materials and reagents
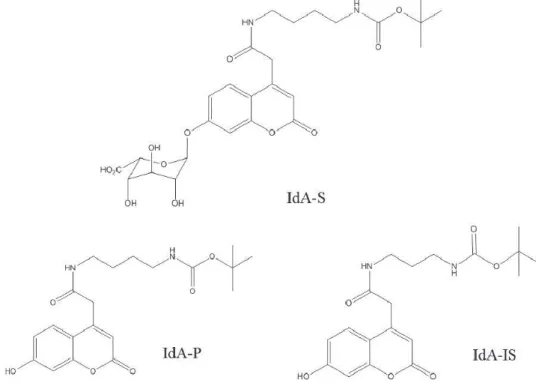
Two mixtures of substrate-internal standard (S-IS, IDUA S & IS Analyte Specific Reagent, REF: BR-05-153, Lot NO: X0635, pow- der) and product-internal standard (P-IS, 1:1, mol/mol, powder) were provided by the Genzyme Center Corporate Headquarters (Cambridge, MA, USA): the chemical compositions of substrate (IdA-S), product (IdA-P), and internal standard (IdA-IS) of IDUA are C26H34N2O12, C20H26N2O6, and C19H24N2O6, respectively (Fig.
1). Centers for Disease Control and Prevention (CDC) DBS sam- ples at four different levels, (base, low, medium, and high) of IDUA enzyme activity were provided by the CDC (Atlanta, GA, USA). The CDC-reported activity values, i.e., mean activities
Fig. 1. The structure of substrate (IdA-S), product (IdA-P), and internal standard (IdA-IS) of α-L-iduronidase.
(range), were 0.08 µmol/hr/L blood (0.00-0.59), 0.39 µmol/hr/L blood (0.00-1.11), 5.54 µmol/hr/L blood (4.22-6.87), and 11.49 µmol/hr/L blood (8.40-14.58) at the base, low, medium, and high levels, respectively.
Acetonitrile, methanol, and water were of HPLC grade and were purchased from Burdick and Jackson (Honeywell Interna- tional, Morristown, NJ, USA). Analytical reagent grade formic acid was purchased from ProteoChem (Cheyenne, WY, USA).
Sodium formate and D-saccharic acid 1,4-lactone monohydrate were used to prepare a cocktail buffer and were purchased from Sigma Aldrich (St. Louis, MO, USA). Well plates (micro- plate polypropylene, round bottom, chimney style) were pur- chased from Greiner Bio-One (Monroe, NC, USA), while 1.7-mL microtubes were purchased from Axygen (Union City, CA, USA).
A thermo shaker incubator (model: MS-100) was purchased from Hangzhou Allsheng Instruments Co., Ltd. (Hangzhou City, China).
2. Preparation of calibration standard
A P-IS stock solution (both concentrations 1.0 µM) was pre- pared by adding 150 µL of 0.2% formic acid in methanol to a vial containing P-IS (1:1, mol/mol). A calibration standard of P-IS (both concentrations 2.0 nM) was prepared by a 500-fold dilution of the stock solution with 0.2% formic acid in acetoni- trile-water (40:60, v/v). The aliquots (50 µL) were stored at -4°C prior to usage.
3. Preparation of cocktail buffer and incubation cocktail (S-IS cocktail)
Cocktail and incubation buffers were prepared as previously de- scribed [4-8], with some modifications. Briefly, a cocktail buffer (18 mL) was prepared by mixing 17.5 mL of IDUA buffer (0.112 mol/L sodium formate + 0.158 mol/L formic acid, pH 3.6) with 0.5 mL of saccharolactone IDUA inhibitor solution (3.0 mmol/L D-saccharic acid 1,4-lactone monohydrate in water). The solu- tion was stored at 4°C until use. A S-IS cocktail (S, 1.67 mM, IS, 11.8 µM) was prepared by adding 18 mL of cocktail buffer to a vial, which contained 17 mg substrate and 0.08 mg internal standard. The aliquot solutions were stored at -4°C until use.
4. Sample preparation
For the 3-hr-reactive incubation, samples were prepared as pre- viously described [5] with modifications. Briefly, 30 µL of S-IS cocktail (S, 50.1 nmol; IS, 0.354 nmol) was added to a punched DBS in 96-well plates with centrifugation for 3 min at 2,000 g, followed by incubation at 37°C for 3 hr with 250 rpm agitation
to allow the reaction between the IDUA enzyme and substrate to occur. Water-acetonitrile (100 µL, 20:80, v/v) was added to quench the reaction. The supernatant aliquot was diluted 500- fold with water-acetonitrile (93:7, v/v) prior to liquid chromatog- raphy-tandem mass spectrometry (LC-MS/MS) analysis.
5. Liquid chromatography-tandem mass spectrometry
An AcQuity ultra-performance liquid chromatography (UPLC) system (Waters, Milford, MA, USA) with a cooling autosampler, a column oven with temperature control, a degasser, and a bi- nary pump was used to inject 2 μL of prepared samples onto a reversed-phase analytical column (Kinetex XB-C18, 50 mm length × 2.1 mm i.d., 2.6 μm particle size, 100Å, Phenomenex, Torrance, CA, USA), which was maintained at 37°C. Chromato- graphic separations of samples were performed using linear gradient elution of mobile phases involving 0.1% formic acid in water (A), and 0.1% formic acid in acetonitrile (B) over 2.8 min of total run time: 0 min (7% B), 0.5 min (7% B), 1.5 min (50%B), 1.7 min (90% B), 2.2 min (90% B), and 2.3 min (7% B) at a 0.5 mL/min flow rate. The strong and weak solutions used to wash the autosampler were 0.1% formic acid in acetonitrile and 0.1% formic acid in water, respectively.
A Xevo TQ-S triple quadrupole mass spectrometer (Waters) equipped with an electrospray ionization (ESI) interface was used to detect product and internal standard in the column ef- fluents. The mass spectrometric conditions for ionization and multiple-reaction monitoring (MRM) of product and internal standard were optimized by injection of product-internal stan- dard solution onto LC-MS/MS. Optimum mass spectrometric conditions are summarized in Table 1. The MRM fragmentation transitions for data acquisition were m/z 413.2-313.2 for prod- uct and m/z 399.2-299.2 for internal standard at a cone voltage of 30.0 V and collision energies of 17 eV (for product) and 15 eV (for internal standard) with dwell times of 50 msec for each transition. Data acquisition and analysis were performed using the MassLynxTM NT 4.1 software with Quan-LynxTM program (Waters).
6. Calculation of enzyme activity by single-point calibration
In previous papers [4-8], the enzyme activity was calculated in µmol/hr/L from the product amount (mol) divided by blood vol- ume (-3.1 μL per 3.2 mm DBS punch), and incubation time, where the product amount was calculated from the response ratio of product-to-internal standard for a sample, multiplied by the amount (mol) of added internal standard as follows:Where the amount of internal standard was calculated from the concentration of IS in a S-IS cocktail added to punched DBS, multiplied by the cocktail volume. On the basis of this cal- culation, we established a single-point calibration by plotting the response ratio of product to internal standard vs. the nominal activity (38.07 µmol/hr/L) of IDUA enzyme in DBS.
7. Method validation
The intra-day precision of this method was evaluated by analyz- ing a blank sample and four CDC-control samples at base, low, medium, and high levels of IDUA enzyme activities in three rep- licates (n =3) along with a single-point calibration curve. To evaluate inter-day precision, the run (within a day) was repeated on three consecutive days (total: n=9).
8. Clinical application in controls and patients
We prepared DBS samples from 139 normal controls (119 new-
borns and 20 healthy adults) and tested IDUA activity. In addi- tion, we obtained DBS from four patients with MPSI at the time of study. All patients were diagnosed with MPSI by biochemical and molecular genetic investigation, and they were subjected to enzyme replacement therapy (ERT). Unfortunately, we could not obtain DBS samples from the patients without treatment.
RESULTS
1. Tandem mass spectrometric conditions
The mass spectrometric conditions were optimized (capillary voltage, cone voltage, collision energy, etc.) for electrospray ion- ization and MRM of product and internal standards. The posi- tive electrospray ionization mode was selected for the detection of product and internal standard, which were more sensitive in positive mode than negative mode. In the positive ion full scan, the sodium-adducted ions [M+Na]+ were abundantly generated at m/z 413.2 and 399.2 for product and internal standard, re- spectively. More fragments were generated with increasing colli- sion energy. The prominent stable product ion for product was obtained at m/z 313.2, with collision energy of 17 eV, and the internal standard was monitored by the most abundant product ion at m/z 299.2 with collision energy of 15 eV (Fig. 2).
2. Liquid chromatographic conditions and dilution of sample residue
Conditions were optimized to obtain peaks of product and inter- nal standard with high intensity, good shape, and a stable re- sponse that was not affected by endogenous substances de- rived from matrices. We applied conventional, reversed-phase, and liquid chromatography–for example, using a C18 column–
on which product and internal standard were well retained and separated because of their relative non-polarity. Under a gradi- ent-mobile phase condition of water-acetonitrile-0.1% formic acid, several C18 columns have been tested: core-shell-type columns such as Phenomenex Kinetex XB-C18 (50 ×2.1 mm i.d., 2.6 µm) and Agilent Poroshell 120 EC-C18 (50×3.0 mm i.d., 2.7 µm), and a porous-type UPLC column such as a Waters BEH (50×2.1 mm i.d., 1.7 µm). There were no noticeable differ- ences between the columns in terms of peak shape (tailing and symmetry) and peak height. However, the Waters BEH column showed much higher pressure than other columns, –5,000 psi at 0.5 mL/min. In addition, the Agilent Poroshell column gave later elution of product and internal standard than other col- umns: ~1.4-1.8-fold elution time, depending on the initial con- ditions of the gradient mobile phase. Finally, a Kinetex XB-C18 Table 1. Optimum operating mass spectrometric parameters for
the product (P) and internal standard (IS)
Parameter Value
Source temperature (°C) 150
Desolvation temperature (°C) 450
Cone gas flow rate (L/hr) 150
Desolvation gas flow rate ( L/hr) 950
Transition dwell time (sec) 0.05
Capillary voltage (kV) 3.50
Cone voltage (V) 30.0
Collision energy voltage (eV) 17 (P), 15 (IS) Collision gas flow rate (mL/min) 0.19
Low mass resolution 1 3.0
High mass resolution 1 15.0
Ion energy 1 0.3
Low mass resolution 2 3.0
High mass resolution 2 15.0
Ion energy 2 1.0
Nebulizer gas flow (Bar) 7.0
Source offset (V) 50.0
Mode of analysis Positive ion
Ion transition for product (m/z) 413.2 → 313.2 Ion transition for internal standard (m/z) 399.2 → 299.2
Activity =
Peak area (P)
Peak area (IS) × Amount (IS, μmol) Blood volume (3.1×10⁻⁶L) × Incubation time (3 hrs)
column was chosen for liquid chromatographic separation of product and internal standard considering the lower pressure of the column and the shorter elution time.
3. Method Validation
The suitability of this system was tested by repeated injection of a P-IS standard mixture solution throughout the method valida- tion. The response ratio of product-to-internal standard (P/IS) was precise within a batch; the relative standard deviation (RSD) was 4.48-11.49%. The retention times of the product and inter- nal standard were constant at 1.66 min and 1.62 min, respec- tively. The peak shapes of the product and internal standard were reproducible in terms of symmetry and width. By compar- ing the MRM chromatograms between the calibration standard and double-blank sample (free of substrate, product, and inter- nal standard), no obvious peak significantly affected the re- sponse of P and IS around each retention time, indicating the absence of interfering substances during the sample prepara- tion (Fig. 3A vs. C).
Although no product was spiked into the blank sample (spiked with substrate and internal standard), a noticeable peak of product was observed, as shown in Fig. 3B. We suggest that this product came from the S-IS standard mixture because it was also found in the standard, which was analyzed without any treatment before LC-MS/MS. In addition, we hypothesized that product was formed through a cleavage reaction of substrate, even without IDUA enzyme under 3-hr incubation at 37°C, be- cause the response ratios P/IS in the blank samples (incubated S-IS standard solution) were approximately 4-5 fold higher than response ratios P/IS in the S-IS solution (results not shown).
The intra-day and inter-day precision results are presented in Table 2. The analytical method developed in this study was pre- cise because the intra- and inter-day precision ranged between 2.6-16.5% and 7.9-17.0%, respectively, across all levels of a blank and four controls.
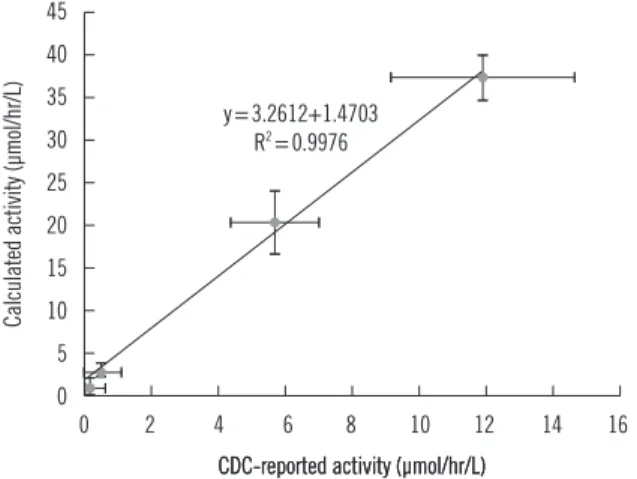
A correlative regression study on IDUA activity in CDC-control samples was performed to assess the validity of the developed method (Fig. 4).The calculated values were obtained by sub- tracting activity values in the blank sample from activity values in control samples within a batch, as was previously reported [5].
A highly significant linear association (r2=0.9976) was found between the calculated and CDC-reported values. In addition, the values of mean and standard deviation indicated that the calculated activities in the four level-control samples were dis- tinct from each other. Therefore, this method was found to be reliable and applicable to MPSI screening to differentiate be- tween affected patients and normal individuals.
4. Evaluation of IDUA activity in healthy individuals and affected patients
The median activity of IDUA from healthy individuals was 23.2 µmol/hr/L (2.5th-97.5th percentile, 11.0-47.7 µmol/hr/L).
Among the four DBS samples obtained from each patient under ERT, one sample gave an enzyme activity value (IDUA activity, 3.04 µmol/hr/L) well below the activity range in normal samples, two other samples gave values (6.38 and 7.42 µmol/hr/L) lower than the lowest activity (8.98 µmol/hr/L), and the other sample gave a value (13.57 µmol/hr/L) between the lowest and 25%
activity values (Fig. 5). We confirmed that the MPSI patients un- der ERT had appropriate IDUA activity.
DISCUSSION
In comparison with the most advanced method previously re- ported on two-dimensional chromatography techniques spec- Fig. 2. Collision-induced dissociation of the product (A) and internal
standard (B) with collision energies of 17 and 15 eV, respectively.
100
%
200 250 300 350 400 450 200 250 300 350 400 450
m/z 225.2
313.2
301.0
413.3 Daughters of 413 ES+4.98e6
A 100
%
200 250 300 350 400 450 200 250 300 350 400 450
m/z 299.2
399.2
Daughters of 399 ES+7.6e6
B
trometry [8], the method described herein achieved a distinct improvement: simple and conventional one-dimensional liquid
chromatography was enough to reliably measure the products from significant matrix effects after a simple one-step extraction Fig. 3. Representative multiple reaction monitoring (MRM) chromatograms of product (left panel) and internal standard (right panel) in dou- ble blank (A), blank (B), calibration standard (C), and CDC-control DBS samples at base (D) and high (E) levels.
Abbreviations: CDC, Centers for Disease Control and Prevention; DBS, dried blood spot.
%
1
%
1
1.00 1.10 1.20 1.30 1.40 1.50 1.60 1.70 1.80 1.90 2.00 1.00 1.10 1.20 1.30 1.40 1.50 1.60 1.70 1.80 1.90 2.00 MRM of 2 Channels ES ·
413.2>313.15 (MPS1_P) 2.33e4
MRM of 2 Channels ES · 399.2>299.15 (MPS1_IS) 2.33e4
A Time
%
1
%
1
1.00 1.10 1.20 1.30 1.40 1.50 1.60 1.70 1.80 1.90 2.00 1.00 1.10 1.20 1.30 1.40 1.50 1.60 1.70 1.80 1.90 2.00 MRM of 2 Channels ES ·
413.2>313.15 (MPS1_P) 4.14e4
MRM of 2 Channels ES · 399.2>299.15 (MPS1_IS) 4.14e4
B Time
%
1
%
1
1.00 1.10 1.20 1.30 1.40 1.50 1.60 1.70 1.80 1.90 2.00 1.00 1.10 1.20 1.30 1.40 1.50 1.60 1.70 1.80 1.90 2.00 MRM of 2 Channels ES ·
413.2>313.15 (MPS1_P) 4.35e4
MRM of 2 Channels ES · 399.2>299.15 (MPS1_IS) 4.35e4
C Time
%
1
%
1
1.00 1.10 1.20 1.30 1.40 1.50 1.60 1.70 1.80 1.90 2.00 1.00 1.10 1.20 1.30 1.40 1.50 1.60 1.70 1.80 1.90 2.00 MRM of 2 Channels ES ·
413.2>313.15 (MPS1_P) 4.73e4
MRM of 2 Channels ES · 399.2>299.15 (MPS1_IS) 4.73e4
D Time
%
1
%
1
1.00 1.10 1.20 1.30 1.40 1.50 1.60 1.70 1.80 1.90 2.00 1.00 1.10 1.20 1.30 1.40 1.50 1.60 1.70 1.80 1.90 2.00 MRM of 2 Channels ES ·
413.2>313.15 (MPS1_P) 6.17e4
MRM of 2 Channels ES · 399.2>299.15 (MPS1_IS) 6.17e4
E Time 1.66
1.66
1.66
1.66
1.62 1.62 1.62
1.62
Table 2. Intra- and inter-day precision of IDUA activity (µmol/hr/L) in blank and four-level CDC-control DBS samples measured by the de- veloped LC-MS/MS method (three runs, three replicates per run)
Level Intra-day (day 1, n=3) Intra-day (day 2, n=3) Intra-day (day 3, n=3) Inter-day (3 days, n=9)
Mean±SD RSD (%) Mean±SD RSD (%) Mean±SD RSD (%) Mean±SD RSD (%)
Blank 6.5±0.3 4.3 8.2±0.4 4.9 8.8±0.7 7.9 7.8±1.1 14.5
Base 7.3±0.3 3.8 9.8±1.6 16.5 9.8±0.4 4.5 9.0±1.5 17.0
Low 8.9±0.7 7.7 11.4±0.4 3.7 11.4±0.6 5.3 10.5±1.3 12.7
Medium 23.8±0.8 3.5 32.7±4.3 13.3 29.3±1.3 4.5 28.6±4.5 15.9
High 41.8±1.1 2.6 48.7±1.4 2.9 48.1±2.6 5.3 46.2±3.7 7.9
Abbreviations: IDUA, α-L-iduronidase; CDC, Centers for Disease Control and Prevention; DBS, dried blood spot; LC-MS/MS, liquid chromatography-tandem mass spectrometry; RSD, relative standard deviation.
and 3-hr incubation without further purification, e.g., LLE. The LC-MS/MS method yielded acceptable results in terms of intra- and inter-day precisions and correlation between our evaluated activities and CDC-reported activities.
In previous studies, a clean-up procedure, (e.g., LLE, prior to mass spectrometric detection) was essential to reduce the ma- trix effect by removing endogenous polar substances [4, 5]. The simplified sample preparation procedures, with LLE excluded, were enabled by the application of liquid chromatographic sep- aration after 16-hr incubation [6, 7], or two-dimensional liquid chromatographic clean-up, i.e., TurboFlow® chromatography- UHPLC, after 3-hr incubation [8]. Mechtler et al. [8] performed two-dimensional LC to remove contaminating materials and, at the same time, detect a smaller amount of products generated by a 3-hr incubation in a time frame less than 16 hr. In this study, we significantly reduced the matrix effect-induced ioniza-
tion suppression by simply diluting the sample residue after 3-hr incubation with aqueous solution prior to LC-MS/MS (Fig.
6). Despite the fact that serial dilution of sample residue de- creased the concentrations of product and internal standard, the sensitivities of product and internal standard inversely in- creased to about 100-fold dilution. Finally, the sample residue was diluted 500-fold with water-acetonitrile (93:7, v/v) prior to LC-MS/MS analysis to make it roughly equal to responses of IS in the calibration standard. Moreover, holding mobile phase B (0.1% formic acid in acetonitrile) 7% for 0.5 min before the start of its gradient elution demonstrated higher stability and re- producibility of product and internal standard responses, be- cause polar interference was eluted early and had less effect on ionization suppression.
Fig. 5. IDUA activity values in DBS samples obtained from patients under medical treatment and normal controls. The lower and upper line of the box indicates the 2.5th and 97.5th percentile value, re- spectively, and the horizontal line inside the box indicates median value in normal samples.
Abbreviations: ERT, enzyme replacement therapy; IDUA, α-L-iduronidase;
DBS, dried blood spot.
80 70 60 50 40 30 20 10 0
Patients under ERT Normal controls
IDUA activity (μmol/hr/L blood)
Fig. 4. Correlative regression analysis of IDUA activity in CDC-control samples: the calculated value (by the developed method) vs. CDC- reported value. The calculated activity (µmol/hr/L)±SD were 1.13
±0.92 for base, 2.71±0.61 for low, 20.76±3.90 for medium, and 38.36±2.83 for high levels.
Abbreviations: IDUA, α-L-iduronidase; CDC, Centers for Disease Control and Prevention.
45 40 35 30 25 20 15 10 5 0
0 2 4 6 8 10 12 14 16
CDC-reported activity (μmol/hr/L) CDC-reported activity (μmol/hr/L)
Calculated activity (μmol/hr/L)
y=3.2612+1.4703 R2=0.9976
The negative difference in the calculated value between the CDC-report and calculated activities, i.e., CDC-method (used to report CDC-activity values) and our method (developed in this study), was inversely proportional to the response ratio (P/IS) with a correlation value of 0.9961 (r2). From the logarithmic curve, we assumed that the CDC-method might provide dramati- cally more ionization suppression with a lower amount of product in comparison with our method. Unlike the CDC-reported values of medium and high CDC-control samples, however, the reported values of negative SD for the base and low CDC-control samples
were the same as each mean activity value (µmol/hr/L) and lower than each positive SD: 0.08, +0.51/–0.08 and 0.39, +0.72/–0.39 (mean, +/–SD), respectively. Negative activities were frequently obtained from a lower response ratio (P/IS) in the base- and low- level samples than in blank samples (incubated S-IS standard) by a matrix effect. Thus, our developed method reduced ioniza- tion suppression (by matrix effect) relative to the CDC-method.
The analytical method developed in this study was simple, fast, robust and reproducible for measurement of IDUA activity in DBS with LC-MS/MS. Compared to previous studies, this Fig. 6. Multiple reaction monitoring (MRM) chromatograms of product (left panel) and internal standard (right panel) in sample residues di- luted 1- (A), 10- (B), 100- (C) and 1000-fold (D) in aqueous solution.
%
1
%
1
%
1
%
1
×1
×1/10
×1/100
×1/1000
%
1
%
1
%
1
%
1
%
1
%
1
%
1
%
1 0 0.2 0.4 0.6 0.8 1.0 1.2 1.4
0 0.2 0.4 0.6 0.8 1.0 1.2 1.4
0 0.2 0.4 0.6 0.8 1.0 1.2 1.4
0 0.2 0.4 0.6 0.8 1.0 1.2 1.4
0 0.2 0.4 0.6 0.8 1.0 1.2 1.4
0 0.2 0.4 0.6 0.8 1.0 1.2 1.4
0 0.2 0.4 0.6 0.8 1.0 1.2 1.4
0 0.2 0.4 0.6 0.8 1.0 1.2 1.4 MRM of 3 Channels ES ·
413.2>313.15 (MPS1_P) 1.52e6 Area
MRM of 3 Channels ES · 413.2>313.15 (MPS1_P) 2.5e6 Area
MRM of 3 Channels ES · 413.2>313.15 (MPS1_P) 2.79e6 Area
MRM of 3 Channels ES · 413.2>313.15 (MPS1_P) 5.43e5 Area 0.81
48650
0.81 90878
0.80 76501
80 11098
0.77 18184
0.77 20075
0.77 39012
0.77 2114
MRM of 3 Channels ES · 399.2>299.15 (MPS1_IS) 6.75e5 Area
MRM of 3 Channels ES · 399.2>299.15 (MPS1_IS) 7.29e5 Area
MRM of 3 Channels ES · 399.2>299.15 (MPS1_IS) 1.75e6 Area
MRM of 3 Channels ES · 399.2>299.15 (MPS1_IS) 9.15e4 Area
A
B
C
D
method has advantages in terms of sample preparation and liq- uid chromatography. Therefore, injection of sample residue, simple 500-fold dilution after short-term incubation, and the use of conventional LC required no further sample preparation or complex liquid chromatographic separation to decrease matrix effect-induced ionization suppression. The developed method was verified to give acceptable reproducibility, reliability consid- ering precision, and correlation between the calculated and the CDC-reported activities. Furthermore, we showed that this method is applicable to MPSI (Hurler) screening.
Authors’ Disclosures of Potential Conflicts of Interest
No potential conflicts of interest relevant to this article were re- ported.
Acknowledgements
This study was supported by a grant from the Korea Health Technology R&D Project, Ministry of Health and Welfare, Re- public of Korea (A120030).
REFERENCES
1. Giugliani R, Federhen A, Rojas MV, Vieira T, Artigalás O, Pinto LL, et al.
Mucopolysaccharidosis I, II, and VI: Brief review and guidelines for treat- ment. Genet Mol Biol 2010;33:589-604.
2. Tylki-Szymanska A, Marucha J, Jurecka A, Syczewska M, Czartoryska B.
Efficacy of recombinant human alpha-L-iduronidase (laronidase) on re- stricted range of motion of upper extremities in mucopolysaccharidosis type I patients. J Inheri Metab Dis 2010;33:151-7.
3. Martins AM, Dualibi AP, Norato D, Takata ET, Santos ES, Valadares ER, et al. Guidelines for the management of mucopolysaccharidosis type I.
J Pediatr 2009;155(4S):S32-46.
4. Blanchard S, Sadilek M, Scott CR, Turecek F, Gelb MH. Tandem mass spectrometry for the direct assay of lysosomal enzymes in dried blood spots: application to screening newborns for mucopolysaccharidosis I.
Clin Chem 2008;54:2067-70.
5. Duffey TA, Bellamy G, Elliott S, Fox AC, Glass M, Turecek F, et al. A tan- dem mass spectrometry triplex assay for the detection of Fabry, Pompe, and mucopolysaccharidosis-I (Hurler). Clin Chem 2010;56:1854-61.
6. Spáčil Z, Elliott S, Reeber SL, Gelb MH, Scott CR, Tureček F. Compara- tive triplex tandem mass spectrometry assays of lysosomal enzyme ac- tivities in dried blood spots using fast liquid chromatography: application to newborn screening of Pompe, Fabry, and Hurler diseases. Anal Chem 2011;83:4822-8.
7. Spáčil Z, Tatipaka H, Barcenas M, Scott CR, Turecek F, Gelb MH. High- throughput assay of 9 lysosomal enzymes for newborn screening. Clin Chem 2013;59:502-11.
8. Mechtler TP, Metz TF, Müller HG, Ostermann K, Ratschmann R, De Je- sus VR, et al. Short-incubation mass spectrometry assay for lysosomal storage disorders in newborn and high-risk population screening. J Chro- matogr B Analyt Technol Biomed Life Sci 2012;908:9-17.