ISSN 2234-3806 • eISSN 2234-3814
http://dx.doi.org/10.3343/alm.2012.32.6.420
Elecsys Hepatitis B Surface Antigen Quantitative Assay: Performance Evaluation and Correlation with Hepatitis B Virus DNA during 96 Weeks of Follow-up in Chronic Hepatitis B Patients
Hyun Ji Lee, M.D.1, Shine Young Kim, M.D.1, Sun Min Lee, M.D.1, Jeong Heo, M.D.2, Hyung Hoi Kim, M.D.1,3, Chulhun L. Chang, M.D.1, Eun Yup Lee, M.D.1, and Han Chul Son, M.D.1
Departments of Laboratory Medicine1 and Internal Medicine2, Pusan National University School of Medicine; Medical Research Institute3, Pusan National University Hospital, Busan, Korea
Background: Treatment for chronic hepatitis B aims to suppress virus replication and virus sequestration in hepatocytes. Covalently closed circular (ccc) DNA is the template for transcription of viral genes and is responsible for viral persistence. However, limited data are available for quantification of hepatitis B surface antigen (HBsAg) in Korea.
Methods: We evaluated the Elecsys HBsAg II quant assay (Roche Diagnostics, USA) for within-run, between-run, and between-day precisions, linearity, carryover, and clinical specificity. In total, 156 serum samples were evaluated for correlation between HBsAg and hepatitis B virus (HBV) DNA. Serial samples were obtained from 10 patients at 0, 12, 24, 48, 72, and 96 weeks during follow-up.
Results: The assay detected HBsAg in a linear range of 0.5-48,696 IU/mL. Within-run, be- tween-run, and between-day CVs were 2.9-4.1%, 0-1.5%, and 1.5-4.9%, respectively.
Cross-reactivity between potentially interfering substances was absent, and the carryover rate was 0.00002%. The correlation of measurements between the Elecsys assay and HBV DNA PCR was weak (r=0.438, P =0.002). For predicting virologic response, cutoff values of 10,275 IU/mL and 3,846 IU/mL at 12 and 24 weeks after treatment initiation showed positive predictive values of 77.1% and 85% and negative predictive values of 84.6% and 50%, respectively.
Conclusions: The Elecsys HBsAg II quant assay showed good performance for precision, linearity, carryover rate, and specificity. HBsAg level at baseline, 12 weeks, and 24 weeks after treatment initiation can predict virologic response, and the assay can be used for HBsAg quantification in clinical practice.
Key Words: HBsAg, Quantification, Hepatitis B virus, Chronic hepatitis B
Received: January 12, 2012 Revision received: August 10, 2012 Accepted: September 19, 2012 Corresponding author: Hyung Hoi Kim Department of Laboratory Medicine and Medical Research Institute, Pusan National University Hospital, 179 Gudeok-ro, Seo-gu, Busan 602-739, Korea
Tel: +82-51-240-7403 Fax: +82-51-247-6560 E-mail: hhkim@pusan.ac.kr
© The Korean Society for Laboratory Medicine.
This is an Open Access article distributed under the terms of the Creative Commons Attribution Non-Commercial License (http://creativecom- mons.org/licenses/by-nc/3.0) which permits unrestricted non-commercial use, distribution, and reproduction in any medium, provided the original work is properly cited.
INTRODUCTION
The hepatitis B virus (HBV) is a small DNA virus belonging to the Hepadnaviridae family. The viral genome has 4 open reading frames (ORFs: S, C, P, and X) and the virus replicates through
an RNA intermediate using a viral polymerase with reverse-tran- scriptase activity. Upon entry into the cell, HBV sheds its protein coat and the relaxed, partially double-stranded genome is trans- ported into the nucleus. In the nucleus, the DNA genomes are converted to a covalently closed circular (ccc) form, which serves
as the transcriptional template for host RNA polymerase II. The cccDNA resides in an infected hepatocyte nucleus in the form of a stable, resistant, and enduring non-integrated minichromo- some, where it acts as a template for the transcription of viral genes and is responsible for viral persistence [1, 2]. Several studies have shown a clear correlation between levels of serum hepatitis B surface antigen (HBsAg) and cccDNA [3-5].
Currently, 2 automated diagnostic assays are available for quantification of HBsAg. The most widely used is the Architect HBsAg assay (Abbott Diagnostics, Abbott Park, IL, USA), and the most recently developed is the Elecsys HBsAg II quant as- say (Roche Diagnostics, Indianapolis, IN, USA) [6, 7]. The aim of the present study was to evaluate the performance of the Elecsys HBsAg II quant assay and the correlation of its results with the level of HBV DNA in follow-up patients with chronic hepatitis B (CHB) virus infection.
METHODS
1. HBsAg quantitative assay
HBsAg was quantified using the Elecsys HBsAg II quant assay.
HBsAg testing was performed according to the manufacturer’s instructions and with test kits from a single lot. Detection of HB- sAg by Elecsys uses a sandwich principle: first, a complex is formed with 2 monoclonal HBsAg-specific antibodies, 1 of which is biotinylated, and the other labeled with a ruthenium complex.
After addition of streptavidin-coated microparticles, the com- plexes bind to the solid phase through interaction of biotin and streptavidin. The mixture is subsequently aspirated into a mea- suring cell, where application of a voltage induces chemilumi- nescent emission, which is measured by a photomultiplier. All samples were tested at a 1:400 dilution. The Elecsys HBsAg II quant assay is calibrated to give results in terms of international units per milliliter (IU/mL).
2. HBV DNA quantification
COBAS AmpliPrep/COBAS TaqMan™ HBV (CAP/CTM HBV) (Roche Diagnostics, Mannheim, Germany) is an automated real-time PCR test based on a dual-labeled hybridization probe targeting the pre-core/core region associated with an HBV DNA automated extraction based on the affinity of DNA for silica gel- covered magnetic beads. The procedure starts with 1,050 μL of plasma and consists of subsequent steps of lysis with chaotropic agents and proteinase K, glass-particle DNA capture, and purifi- cation. During the processing step, an internal quantification standard is added to the sample. After DNA elution at a high
temperature (80˚C), a robotic arm loads the nucleic acids in mi- crovials containing the PCR master mix prepared by the same robotic arm. The real-time PCR test is performed by the Cobas TaqMan™ 48 using a TaqMan assay, simultaneously amplifying 2 targets: HBV DNA and the HBV quantification standard (QS), which is a noninfectious construct with primer-binding regions identical to those of the HBV target sequence but with known copy number and added after preparation of sample. Results are expressed as HBV-DNA IU/mL.
3. Performance evaluation of the HBsAg quantitative assay
1) PrecisionPrecision was determined according to CLSI document EP5-A2 [8], using positive control material (Level 2) and pooled serum of patients in which the results of the HBsAg qualitative assay were highly reactive. Each of 2 level samples was tested in 2 runs per day, in duplicate, for 20 days, for evaluating between- run and between-day precision. Intra-assay precision was as- sessed by testing the samples every 30 min 10 times, with repli- cation, on 1 day.
2) Linearity
Low level (0.50 IU/mL) and high level (48,696 IU/mL) of HBsAg from patients were mixed in the following ratios: 0:4, 1:3, 2:2, 3:1, and 4:0. The 5 dilution levels were assessed in replicate by CLSI EP6-A [9].
3) Carryover
The carryover rate was determined by 4 consecutive analyses of 2 samples at different levels (high-level quality control material and pooled serum), according to CLSI EP 10-A2 [10].
4) Limit of detection
The low limit of detection (LOD) was determined according to CLSI EP 17-A [11]. Mean value and SD were obtained by 20 consecutive analyses of HBsAg-negative and unspiked speci- mens (for the Roche HBsAg Qualitative assay) from healthy adults. Low LOD is defined as the mean plus 2 SD. Roche HB- sAg II control Lot 16561101 (Roche Diagnostics) level I and level II were mixed for the spiked sample. SDspk was used to obtain 20 replicates of this spiked sample. Biological LOD was deter- mined as the summation of low LOD and 2SDspk.
5) Potential interfering substances
Potential interference was assessed using 40 HBsAg-negative and unspiked specimens (for the Roche HBsAg Qualitative as-
say). Serum samples from the following categories were tested:
viral infection (HAV, HCV, HIV, CMV, VZV, and HSV), autoimmu- nity (rheumatoid factor, antinuclear antibodies [ANA]), and other conditions (immunoglobulin from monoclonal and polyclonal gammopathy or multiple myeloma).
4. Correlation between HBsAg quantitative assay and HBV DNA quantification
During the study period from January 2006 to October 2009, patients diagnosed with CHB were enrolled (n=57; 21 women, 36 men) in this study. The median patient age was 45 yr (range, 18-68 yr). The patients were treated with adefovir (n=30) and entecavir (n=27). In total, 156 serum samples from HBV chronic carriers were obtained from 57 patients. From 10 patients, sam- ples were obtained according to the study protocol at weeks 0, 12, 24, 48, 72, and 96. The results of HBsAg quantification were analyzed for correlation with quantification of HBV DNA. The usefulness of the HBsAg level during treatment as a predictor of sustained virological response was analyzed. Virologic response was defined as undetectable serum HBV DNA (<12 IU/mL) at 96 weeks after the start of the treatment. One participant showed levels below the detection limit for HBV DNA titer. For this par- ticipant, a level equal to the limit of detection divided by the square root of 2 was imputed [12].
5. Statistical analysis
Statistical tests were performed using SPSS software (version 18.0; SPSS, Inc., Chicago, IL, USA). The Spearman correlation coefficient was used to estimate the correlation between serum HBV DNA and HBsAg. The Mann-Whitney U test was used to compare means between responders and non-responders at 12 weeks, 24 weeks after the start of the treatment, and baseline.
The repeated measures ANOVA was used for comparisons of the HBV DNA and HBsAg of 10 patients from serial samples taken during the 96 weeks of the study. The receiver-operating characteristic (ROC) curve was employed to identify an absolute HBsAg level associated with a high rate of response post-treat- ment. A P value of <0.05 was considered statistically significant.
The P level was adjusted using a Bonferroni correction proce- dure for correlated dependent measures.
RESULTS
1. Precision and linearity
A precision study was performed as described in CLSI protocol EP5-A2. The within-run, between-run, and between-day CVs for
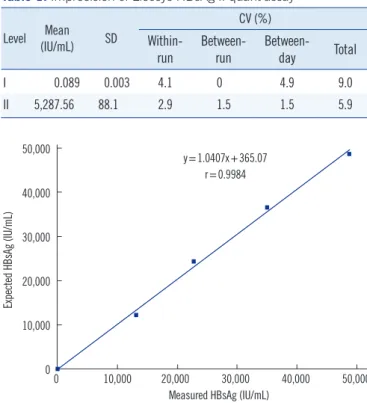
the 2 levels are listed in Table 1. The range from 0.5 to 48,696 IU/mL showed a clinically relevant linearity (y=1.0407x + 365.07, r=0.9984) (Fig. 1).
2. Cross-reactivity and carryover
To evaluate the cross-reactivity of the HBsAg assay, 40 serum specimens from hospital patients with medical conditions unre- lated to HBV infection and specimens containing potentially in- terfering substances were evaluated. Cross-reactivity was not observed. The carryover rate was 0.00002%.
3. LOD
The lower LOD of the Elecsys HBsAg II quant assay with 20 consecutive analyses of HBsAg negative and unspiked speci- mens (for the Roche HBsAg Qualitative assay) from healthy adults was 0.564 (IU/mL). Biological LOD was 0.570 (IU/mL).
4. Correlation between Elecsys HBsAg II quant assay and the level of HBV DNA
The first follow-up samples from 46 patients were evaluated for a simple correlation between HBsAg and HBV DNA. The corre- lation between measurements conducted with the Elecsys and HBV DNA PCR assays is shown Fig. 2; the correlation between Table 1. Imprecision of Elecsys HBsAg II quant assay
Level Mean (IU/mL) SD
CV (%) Within-
run
Between- run
Between- day Total
I 0.089 0.003 4.1 0 4.9 9.0
II 5,287.56 88.1 2.9 1.5 1.5 5.9
Fig. 1. Linearity range of the Elecsys HBsAg II quant assay.
Abbreviation: HBsAg, hepatitis B surface antigen.
Expected HBsAg (IU/mL)
50,000 40,000 30,000 20,000 10,000
00 10,000 20,000 30,000 40,000 50,000 Measured HBsAg (IU/mL)
y=1.0407x+365.07 r=0.9984
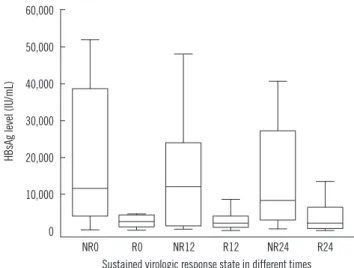
the assays was weak (r =0.438, P =0.002). Mean changes in the HBV DNA and HBsAg of 10 patients in serial samples taken during the 96 weeks showed a significant difference between the 2 groups (repeated measures ANOVA, P =0.002). A signifi- cant difference was not observed with serial follow-up within each group (repeated measures ANOVA, F [1.4, 25.2]=1.438, P =0.251) or with interactions between the time and groups (repeated measures ANOVA, F [1.4, 25.2] =1.435, P =0.252) (Fig. 3). HBsAg levels at baseline, 12 weeks after the start of the treatment, and 24 weeks after the start of the treatment, were lower in patients achieving a sustained virologic response
(5,224.10±7,495.27, 3,335.08±3,565, 4,523.26±5,036.56 IU/
mL) than in non-responders (20,016.2±19,434.11, 15,775.89± 15,489.65, 14,803.45±14,901.75 IU/mL; Mann-Whitney test, P =0.009, P =0.002, P <0.001, respectively; Fig. 4).
ROC analysis was used to identify baseline HBsAg levels as- sociated with achieving a sustained virologic response 96 weeks after the start of the treatment. A lower level (3,749 IU/mL) at baseline was identified that resulted in a positive predictive value
Fig. 4. HBsAg level at pretreatment and 12 weeks, 24 weeks after treatment initiation according to achieving a sustained virologic re- sponse.
Abbreviations: HBsAg, hepatitis B surface antigen; NR0, non-responder at baseline; R0, responder at baseline; NR12, non-responder at 12 weeks af- ter treatment initiation; R12, responder at 12 weeks after treatment initia- tion; NR24, non-responder at 24 weeks after treatment initiation; R24, re- sponder at 24 weeks after treatment initiation.
HBsAg level (IU/mL)
60,000 50,000 40,000 30,000 20,000 10,000
0
NR0 R0 NR12 R12 NR24 R24 Sustained virologic response state in different times
Fig. 5. ROC analysis to identify cutoff level of HBsAg to predict viro- logic response at baseline, 12 weeks, and 24 weeks after the start of the treatment .
Abbreviation: HBsAg, hepatitis B surface antigen.
Baseline 12 weeks 24 weeks
True virologic response (Sensitivity)
100 80 60 40 20
0
0 20 40 60 80 100 False virologic response (100-Specificity)
Fig. 3. Serial concentration curves of HBsAg levels and HBV DNA levels in 10 follow-up patients.
Abbreviations: HBsAg, hepatitis B surface antigen; HBV, hepatitis B virus.
Mean change in HBsAg (IU/mL) and HBV DNA (Log IU/mL) level from baseline HBV-DNA (Log IU/mL)
20,000
15,000
10,000
5,000
0
7 6 5 4 3 2 1
0 12 24 48 72 96 0 Weeks
HBsAg (IU/mL) HBV DNA (Log IU/mL)
Fig. 2. Correlation between HBsAg measurements using the Elec- sys HBsAg II quant assay and the level of HBV DNA in the first fol- low-up samples from 46 patients.
Abbreviations: HBV, hepatitis B virus; HBsAg, hepatitis B surface antigen.
HBV-DNA (Log IU/mL)
10.00
8.00
6.00
4.00
2.00
0.00
0 10,000 20,000 30,000 40,000 50,000 HBsAg concentration (IU/mL)
r=0.438 P =0.002
(PPV) of 72% for achieving a sustained virologic response after the start of the treatment and a negative predictive value (NPV) of 81%. Cutoff values at 12 weeks and 24 weeks after the start of the treatment of 10,275 IU/mL and 3,846 IU/mL showed PPVs of 77.1% and 85% and NPVs of 84.6% and 50%, respectively (Fig. 5).
DISCUSSION
The goal of treatment of CHB is to suppress replication of HBV.
Because the duration of treatment is long, prediction of the re- sponse to treatment during the course of treatment is necessary.
Theoretically, cccDNA is the best indicator of transcriptional ac- tivity of HBV in hepatocytes, and the level of cccDNA at the end of the treatment is associated with a sustained virological re- sponse following treatment cessation [13, 14]. According to pre- vious studies, the level of HBsAg correlates with the level of cccDNA [3-5]. Until the development of automated quantifica- tion of HBsAg, measurement of HBsAg levels was laborious and needed serial dilution, lacked standardization, and was difficult to use in clinical practice [11]. Recently, an automated method for quantification of HBsAg has been developed, and the clini- cal use of HBsAg has now been highlighted [11]. There are 2 automated quantification assays for HBsAg. Milan et al. [6] and Karsten et al. [7] reported that the correlation between the as- says was excellent (r=0.96 and 0.97, respectively; P <0.001).
In clinical use, quantification of HBV DNA by PCR can moni- tor the response to treatment. Several studies have shown the presence of a good correlation between HBsAg and HBV DNA levels [15, 16], but others have shown the absence of a correla- tion [17]. Rather than a simple correlation between HBsAg and HBV DNA levels, the correlation between mean changes in HB- sAg and HBV DNA level is important [16, 17]. However, serial changes in HBsAg and HBV DNA of each patient during treat- ment do not always correlate well [16, 18, 19]. The pattern of changes in HBsAg and HBV DNA may differ owing to differences in disease status, in particular the presence of HBeAg and anti- HBe-antibodies, and the mechanism of action of the drug used [17, 20]. Therapy with interferon (IFN) gamma clears HBV-in- fected hepatocytes noncytolytically and leads to a greater reduc- tion in HBsAg. Adefovir or entecavir are nucleoside analogues that target the HBV reverse transcriptase and selectively inhibit virion production. The efficacy of these drugs for lowering HB- sAg and cccDNA levels is poorer than that of IFN therapy [13].
The patients involved in our study were treated with adefovir or entecavir. None were treated with IFN. Additionally, the disease
status of the patients differed; some achieved seroconversion of HBeAg, whereas others did not. These differences led to the discordance between changes in HBsAg and HBV DNA levels during the 96 weeks of follow-up for each patient.
Quantification of HBsAg and HBV DNA levels enabled pre- diction of response to treatment. Even though the cut off value for the HBsAg level at baseline or the reduced levels from base- line differed between studies, the initial HBsAg level and re- duced HBsAg levels could predict the response according to type of treatment. A lower HBsAg level at baseline or a greater reduction in HBsAg level from the baseline at 12 or 24 weeks after the start of the treatment was correlated with achievement of a sustained virological response [13, 14, 18, 20-24]. In our study, the level of HBsAg at pretreatment, 12 weeks, and 24 weeks after the start of the treatment was useful for the predic- tion of response to treatment. Thus, serial follow-up for HBsAg is useful for defining the level at baseline and analyzing the level of decline at a given time point, but not for determining a simple correlation with HBV DNA level.
According to our study, the Elecsys HBsAg II quant assay shows good performance in precision, linearity, carryover rate, and specificity. The level of HBsAg at baseline, 12 weeks, and 24 weeks after the start of the treatment is useful for predicting virologic response in patients with CHB virus infection. There- fore, the Elecsys HBsAg II quant assay can be applied for HB- sAg quantification in clinical practice.
Authors’ Disclosures of Potential Conflicts of Interest
No potential conflicts of interest relevant to this article were re- ported.
REFERENCES
1. Lin LY, Wong VW, Zhou HJ, Chan HY, Gui HL, Guo SM, et al. Relation- ship between serum hepatitis B virus DNA and surface antigen with co- valently closed circular DNA in HBeAg- negative patients. J Med Virol 2010;82:1494-500.
2. Lee WM. Hepatitis B virus infection. N Engl J Med 1997;337:1733-45. 3. Nguyen T, Thompson AJ, Bowden S, Croagh C, Bell S, Desmond PV, et
al. Hepatitis B surface antigen levels during the natural history of chron- ic hepatitis B: a perspective on Asia. J Hepatol 2010;52:508-13. 4. Jaroszewicz J, Calle Serrano B, Wursthorn K, Deterding K, Schlue J,
Raupach R, et al. Hepatitis B surface antigen (HBsAg) levels in the nat- ural history of hepatitis B virus (HBV)-infection: a European perspective.
J Hepatol 2010;52:514-22.
5. Thompson AJ, Nguyen T, Iser D, Ayres A, Jackson K, Littlejohn M, et al.
Serum hepatitis B surface antigen and hepatitis B e antigen titers: dis-
ease phase influences correlation with viral load and intrahepatic hepa- titis B virus markers. Hepatology 2010;51:1933-44.
6. Sonneveld MJ, Rijckborst V, Boucher CA, Zwang L, Beersma MF, Han- sen BE, et al. A comparison of two assays for quantification of Hepatitis B surface Antigen in patients with chronic hepatitis B. J Clin Virol 2011; 51:175-8.
7. Wursthorn K, Jaroszewicz J, Zacher BJ, Darnedde M, Raupach R, Mederacke I, et al. Correlation between the Elecsys HBsAg II assay and the Architect assay for the quantification of hepatitis B surface antigen (HBsAg) in the serum. J Clin Virol 2011;50:292-6.
8. National Committee for Clinical Laboratory Standards. Evaluation of pre- cision performance of puantitative measurement methods: Approved guideline, EP5-A2. Wayne, PA: National Committee for Clinical Labora- tory Standards, 2004.
9. Tholen DW. Evaluation of linearity using the newly approved NCCLS EP6-A protocol. Clin Lab News 2004;30:10-2.
10. National Committee for Clinical Laboratory Standards. Preliminary eval- uation of quantitative clinical laboratory methods: Approved guideline, EP10-A2. Second edition. Wayne, PA: National Committee for Clinical Laboratory Standards, 2002.
11. National Committee for Clinical Laboratory Standards. Protocols for de- termination of limits of detection and limits of quantitation: Approved guideline EP17-A. Wayne, PA: National Committee for Clinical and Lab- oratory Standards, 2004.
12. Glass DC and Gray CN. Estimating mean exposures from censored data: exposure to benzene in the Australian petroleum industry. Ann Occup Hyg 2001;45:275-82.
13. Chan HL, Thompson A, Martinot-Peignoux M, Piratvisuth T, Cornberg M, Brunetto MR, et al. Hepatitis B surface antigen quantification: why and how to use it in 2011-a core group report. J Hepatol 2011;55:1121-31. 14. Moucari R and Marcellin P. Quantification of hepatitis B surface anti-
gen: a new concept for the management of chronic hepatitis B. Liver Int 2011;31(S1):122-8.
15. Deguchi M, Yamashita N, Kagita M, Asari S, Iwatani Y, Tsuchida T, et al.
Quantitation of hepatitis B surface antigen by an automated chemilumi-
nescent microparticle immunoassay. J Virol Methods 2004;115:217-22. 16. Ozaras R, Tabak F, Tahan V, Ozturk R, Akin H, Mert A, et al. Correlation
of quantitative assay of HBsAg and HBV DNA levels during chronic HBV treatment. Dig Dis Sci 2008;53:2995-8.
17. Weigand J, Wedemeyer H, Finger A, Heidrich B, Rosenau J, Michel G, et al. A decline in hepatitis B virus surface antigen (hbsag) predicts clearance, but does not correlate with quantitative hbeag or HBV DNA levels. Antivir Ther 2008;13:547-54.
18. Chen J, Wang Z, Guo Y, Peng J, Sun J, Ahmed CS, et al. Serum HBsAg changes in HBeAg positive chronic hepatitis B patients with continuous viral load reductions during treatment with adefovir or peg-interferon-al- pha-2a. Antiviral Res 2009;81:88-91.
19. Moucari R, Mackiewicz V, Lada O, Ripault MP, Castelnau C, Martinot- Peignoux M, et al. Early serum HBsAg drop: a strong predictor of sus- tained virological response to pegylated interferon alfa-2a in HBeAg- negative patients. Hepatology 2009;49:1151-7.
20. Cho YK and Song BC. New insight for HBV DNA and HBsAg quantita- tion during antiviral therapy in patients with chronic hepatitis B. Korean J Gastroenterol 2011;57:144-9.
21. Chan HL, Wong VW, Tse AM, Tse CH, Chim AM, Chan HY, et al. Serum hepatitis B surface antigen quantitation can reflect hepatitis B virus in the liver and predict treatment response. Clin Gastroenterol Hepatol 2007;5:1462-8.
22. Piratvisuth T, Marcellin P, Popescu M, Kapprell HP, Rothe V, Lu ZM.
Hepatitis B surface antigen: association with sustained response to pe- ginterferon alfa-2a in hepatitis B e antigen-positive patients. Hepatology Int 2011 [Epub ahead of print].
23. Lee MH, Lee DM, Kim SS, Cheong JY, Cho SW. Correlation of serum hepatitis B surface antigen level with response to entecavir in naïve pa- tients with chronic hepatitis B. J Med Virol 2011;83:1178-86.
24. Cai W, Xie Q, An B, Wang H, Zhou X, Zhao G, et al. On-treatment se- rum HBsAg level is predictive of sustained off-treatment virologic re- sponse to telbivudine in HBeAg-positive chronic hepatitis B patients. J Clin Virol 2010;48:22-6.