Background and Purpose Interarm differences in the systolic and diastolic blood pres- sures (IASBD and IADBD, respectively) are found in various populations, including stroke patients, but their significance for stroke outcomes has rarely been reported. We aimed to de- termine the associations of IASBD and IADBD with early neurological deterioration (END), functional outcome, and mortality.
Methods This study included 1,008 consecutive noncardioembolic cerebral infarction pa- tients who were admitted within 24 hours of onset and had automatic measurements of blood pressures in the bilateral arms. END was assessed within 72 hours of stroke onset according to predefined criteria. A poor functional outcome was defined as a score on the modified Rankin Scale ≥3 at 3 months after the index stroke. All-cause mortality was also investigated during a median follow-up of 24 months. The absolute difference of blood pressure measurements in both arms were used to define IASBD and IADBD.
Results END occurred in 15.3% (155/1,008) of the patients. A multivariate analysis including sex, age, and variables for which the p value was <0.1 in a univariate analysis revealed that IASBD
≥10 mm Hg was significantly associated with END [odds ratio (OR)=1.75, 95% CI=1.02–
3.01]. IADBD ≥10 mm Hg was also related to END (OR=3.11, 95% CI=1.61–5.99). Moreover, having both IASBD ≥10 mm Hg and IADBD ≥10 mm Hg was related to a poor functional out- come (OR=2.67, 95% CI=1.36–5.35) and mortality (hazard ratio=7.67, 95% CI=3.76–12.83) even after adjusting for END.
Conclusions This study suggests that an interarm blood pressure difference of ≥10 mm Hg could be a useful indicator for the risks of END, poor functional outcome, and mortality.
Key Words interarm blood pressure differences, ankle-brachial index, stroke, early neurological deterioration, functional outcome, mortality.
Interarm Blood Pressure Difference is Associated
with Early Neurological Deterioration, Poor Short-Term Functional Outcome, and Mortality in Noncardioembolic Stroke Patients
INTRODUCTION
Early neurological deterioration (END) is generally defined as neurological worsening within 72 hours after an acute ischemic stroke.1 The main causes of END in acute ischemic stroke are symptomatic hemorrhage, hemorrhagic transformation, stroke recurrence, sei- zure, metabolic encephalopathy, pneumonia, and cardiac arrest.2 The incidence of END in acute ischemic stroke reportedly varies from 16% to 38% depending on the stroke severity scale and time frame used.3,4 However, regardless of the definition, END is associated with a poor prognosis for ischemic stroke patients,5 and so identifying factors associated with END is important for improving the prognosis of acute stroke.
Yoonkyung Changa,b Jinkwon Kimc Min-Ho Kimd Yong-Jae Kima Tae-Jin Songa
a Department of Neurology, College of Medicine,
Ewha Woman’s University, Seoul, Korea
b Department of Neurology,
College of Medicine, Korea University Guro Hospital, Seoul, Korea
c Department of Neurology, CHA Bundang Medical Center, CHA University, Seongnam, Korea
d Department of Biostatistics,
Ewha Institute of Convergency Medicine, Seoul, Korea
pISSN 1738-6586 / eISSN 2005-5013 / J Clin Neurol 2018;14(4):555-565 / https://doi.org/10.3988/jcn.2018.14.4.555
Received May 3, 2018 Revised July 16, 2018 Accepted July 18, 2018 Correspondence Tae-Jin Song, MD, PhD Department of Neurology, College of Medicine, Ewha Woman’s University,
1071 Anyangcheon-ro, Yangcheon-gu, Seoul 07985, Korea
Tel +82-2-2650-2677 Fax +82-2-2650-5958 E-mail [email protected]
cc This is an Open Access article distributed under the terms of the Creative Commons Attribution Non-Com- mercial License (https://creativecommons.org/licenses/by-nc/4.0) which permits unrestricted non-commercial use, distribution, and reproduction in any medium, provided the original work is properly cited.
JCN
Open Access ORIGINAL ARTICLEInterarm BP and Stroke Progression
JCN
Blood pressure parameters are common risk factors for vascular disease, including stroke. Current hypertension guidelines advocate checking the blood pressure in both arms,6 due to the possibility of differences in the measured blood pressures. Such interarm blood pressure differences (IABDs) have been found in several studies. In general, IABD ≥10 mm Hg has been found in about 4% of patients without any vas- cular disease, 13% of patients with hypertension, 7% of pa- tients with diabetes mellitus, and 9–10% of patients with stroke;
however, the methods used to measure IABD have differed between these studies.7-9
IABD is a clinically important indicator that is easy to mea- sure in the clinic. IABD is associated with significant athero- sclerosis and other types of stenosis in the large arteries, in- cluding the aorta and its major branches.10 Because progressed atherosclerosis is related to poor prognosis in stroke patients,11 IABD could be associated with poor clinical outcomes after acute ischemic stroke, particularly END. However, there are few reports on the association between IABD and END. More- over, the clinical significance of IABD for stroke outcomes has also rarely been reported. In this study we hypothesized that increased interarm differences in the systolic and dia- stolic blood pressures (IASBD and IADBD, respectively) are related to END, poor functional outcome, and mortality.
METHODS
Study population
Between January 2011 and August 2016, 1,425 consecutive patients with a first-ever transient ischemic attack or acute ce- rebral infarction were admitted to our stroke center within 24 hours after symptom onset or the last normal time.12 The medi- cal history, demographic characteristics, vascular risk factors, neurological manifestations, and neuroimaging data were collected in our registry during their admission. Chest X-rays, laboratory blood tests, and 12-lead electrocardiography were routinely performed in all of the admitted stroke patients.
Brain CT and/or MRI and vascular imaging [magnetic reso- nance angiography (MRA), CT angiography (CTA), or digi- tal subtraction angiography (DSA)] were also performed. The ankle-brachial index (ABI) was also routinely measured with an automated device between 3 and 7 days after admission to investigate underlying peripheral arterial occlusive diseases.8
Among the 1,425 initially included patients, patients with transient ischemic attack (n=102), potential cardiac source of embolism (PCSE) [n=182; sick sinus syndrome (n=5), paroxysmal atrial fibrillation (n=40), or persistent atrial flut- ter/fibrillation (n=121), or other PCSE (n=16)], stroke due to other determined causes (rare causes, n=21), or incomplete stroke evaluation (n=10) were excluded. Patients with PCSE
were excluded because arrhythmias—which are the main component of PCSE (predominantly atrial fibrillation)—are a frequent cause of the failure to accurately or consistently mea- sure blood pressure and the brachial-ankle pulse wave veloci- ty (baPWV).8,13 Patients who did not receive brain MRI (n=
19) or for whom the quality of MRI images was poor (n=4) were excluded. In addition, patients missing ABI data (n=38) or with an abnormal ABI result (ABI <0.9, n=41) were also excluded due to the possibility of inaccurate blood pressure and baPWV measurements.14 This study finally included 1,008 patients (Supplementary Fig. 1 in the online-only Data Sup- plement) with no history of coarctation of the aorta or car- diac valvular disease pathologies.
The Supplementary Material (in the online-only Data Sup- plement) and a previous study8,15 provide detailed definitions of vascular risk factors, including the body mass index (BMI), hypertension, diabetes mellitus, hyperlipidemia, smoking, al- cohol intake, history of coronary artery disease, metabolic syndrome, and left ventricular hypertrophy. Stroke was classi- fied according to the Trial of Org 10,172 in Acute Stroke Treat- ment classification system.16 The degree of intracranial cerebral atherosclerosis (ICAS) stenosis was measured as described previously,17,18 and the presence of ICAS was defined as a
≥50% decrease in the luminal diameter.17,18 Extracranial cere- bral atherosclerosis (ECAS) was investigated in the common carotid arteries, subclavian arteries, and proximal internal carotid arteries up to the bifurcation level,19 with its presence defined by a ≥50% decrease in the luminal diameter.19 Extra- cranial vertebral arteries with suspecting hypoplasia were not considered as ECAS because MRA and CTA cannot clearly differentiate a normal variant of vertebral artery hypoplasia from acquired stenosis.17 If one artery had multiple stenotic lesions, the most-severe lesion was selected. The presence of ICAS and ECAS was independently investigated by two neu- rologists (T.J.S. and Y.C.) who were blinded to clinical infor- mation. The kappa value for the interobserver agreement regarding the presence of ICAS was 0.936. Consensus was reached in cases of discrepancy when detecting ICAS and ECAS. High-grade white-matter hyperintensities (HGWM- Hs) were defined as a Fazekas score of 3 in the periventricu- lar white matter or ≥2 in the deep white matter in FLAIR or T2-weighted brain MRI images.20 Blood laboratory findings at admission (white blood cell count, hemoglobin, and plate- let count) and after an 8-hour fast (glucose and lipid profile) were used. The Institutional Review Board approved our study (IRB No. 2017-04-017-001) without the need to obtain informed consent because of its retrospective and observa- tional design.
Chang Y et al.
JCN
Definition of END
The presence and type of END were prospectively confirmed by the agreement of more than three stroke neurologists at a weekly stroke conference. END was defined as at least one of the following three criteria being met within 72 hours af- ter admission: 1) increase in the total National Institutes of Health Stroke Scale (NIHSS) score since admission of at least 2 points, 2) subscore for the level of consciousness on the NIHSS of 1 or more, or 3) any other new neurological deficit.21 The causes of END were symptomatic hemorrhagic transfor- mation, stroke progression, stroke recurrence, and other med- ical complications (e.g., acute myocardial infarction).22 Outcome measures
The score on the modified Rankin Scale (mRS) was checked at 3 months after the index stroke by a stroke specialist and/
or well-trained stroke nurse. The functional outcome at 3 months after the index stroke was dichotomized into a good outcome (mRS score <3) or a poor outcome (mRS score ≥3).
We also recorded the date of all-cause mortality for all of our patients using data from mRS during follow up and the Ko- rean National Statistical Office, which are based on death cer- tificates and are known to be reliable.23 The censoring date was set as December 31, 2016.
Measuring blood pressure in both arms and IABDs The systolic and diastolic blood pressures are measured in the supine position with a device designed to automatically and simultaneously assess the ABI (VP-1000, Colin, Koma- ki, Japan). Pressure cuffs were wrapped on both the brachi- al and posterior tibial arteries to measure the arterial blood pressure using the oscillometric method.24 Large IASBD and IADBD values were defined as absolute differences ≥10 mm Hg, which is a frequently used cutoff.8,25
Statistical analysis
Statistical analyses were performed with the Windows SPSS software package (version 21.0, IBM Corp., Armonk NY, USA) and the R package for Windows (version 3.0.2, R Foun- dation for Statistical Computing, Vienna, Austria). Continu- ous variables are expressed as mean±SD values, categorical variables as frequency (percentage) values, and ordinal vari- ables as median [interquartile range] values. The demographic characteristics and clinical variables were compared according to the presence of END using the independent t-test, Mann- Whitney U test, chi-square test, and Fisher’s exact test. The relationships of IASBD and IADBD with END were investi- gated using multivariate binary logistic regression with END as the dependent variable. The association of IABD with END was tested with clinical models (models 1 and 2) and a gen-
eral statistical method (model 3). Model 1 was adjusted for traditional cardiovascular risk factors (sex, age, BMI, hyper- tension, diabetes mellitus, hypercholesterolemia, smoking, al- cohol intake, coronary artery disease, metabolic syndrome, left ventricular hypertrophy, and brachial-ankle pulse wave veloc- ity) and NIHSS score. In model 2, the odds ratios (ORs) of IABD were adjusted for model 1 plus significant laboratory and imaging factors (white blood cell count, total cholester- ol, low-density lipoprotein, thrombolysis, cerebral athero- sclerosis, and HGWMHs). Model 3 included covariates that were associated with END in the univariate logistic regression (p<0.1). The association between IABD and END was further investigated by analyzing a smoothed spline plot produced using a generalized additive regression model.
Uni- and multivariate logistic regression analyses were performed to investigate factors associated with a poor func- tional outcome. The association between the IABD score and mortality was analyzed using the Kaplan-Meier product-limit method with a log-rank test and multivariate Cox propor- tional-hazards regression. In addition to age and sex, variables with p<0.1 in the univariate analysis were entered in the mul- tivariate analyses. There was no statistical interaction for a poor functional outcome or mortality between IABD (IASBD and IADBD) and END. To investigate the improvement in the prediction performance obtained by adding IABD for END, functional outcome, and mortality, continuous net re- classification improvement and integrated discrimination im- provement between the multivariate models with and without IABD were computed. For sensitivity analyses, we performed further multivariate analyses for IASBD ≥5 mm Hg, IASBD
≥15 mm Hg, IADBD ≥5 mm Hg, IADBD ≥15 mm Hg, and increased IASBD or IADBD.8 Subgroup analyses were per- formed to investigate whether the relationship between IABD and END differed according to sex, age, BMI, hypertension, diabetes mellitus, hypercholesterolemia, smoking, alcohol in- take, coronary artery disease, metabolic syndrome, left ventric- ular hypertrophy, prior statin use, antihypertensive treatment before the ABI examination, NIHSS score, cerebral atheroscle- rosis, HGWMHs, thrombolytic therapy, or stroke subtype (la- cune or nonlacune). A two-tailed p value of <0.05 was de- fined as statistically significant.
RESULTS
Demographic characteristics and comparisons of patients with and without END
The demographic characteristics and risk factors other than age did not differ significantly between the 1,008 patients who were final included in this study and the 417 patients who were excluded (Supplementary Table 1 in the online-on-
Interarm BP and Stroke Progression
JCN
ly Data Supplement). The included patients were aged 63.4±
11.4 years, and 62.8% (633/1,008) of them were male. END oc- curred in 15.3% (155/1,008) of the patients. The causes of END were symptomatic hemorrhage/hemorrhagic transfor- mation (8.3%, 13/155), stroke progression (72.2%, 112/155), stroke recurrence (9.6%, 15/155), other known causes [8.4%, 13/155; gastrointestinal bleeding (n=4), drug side effects (n=
3), pneumonia (n=3), cardiac arrest or myocardial infarc- tion (n=2), and sepsis (n=1)], and unknown causes (1.3%, 2/155). Compared to those without END, patients with END were older (65.5±9.9 vs. 63.0±11.6 years) and more often had a history of smoking (36.8% vs. 28.8%), coronary artery dis- ease (23.9% vs. 17.9%), left ventricular hypertrophy (14.2%
vs. 9.3%), higher NIHSS score [4 (2–7) vs. 2 (1–4)], cerebral atherosclerosis (51.6% vs. 39.9%), HGWMHs (32.9% vs.
26.1%), and receiving thrombolytic therapy (18.7% vs. 7.3%).
The white blood cell counts and brachial-ankle pulse wave velocities were also higher in patients with END than in those without END. The prevalence of END was lower in patients with prior statin use (Table 1). In total, 144 (11.3%) patients received antihypertensive treatment before the ABI exami- nation, with 95 patients (65.9%) taking only intravenous la- betalol, 23 patients (15.9%) taking intravenous perdipine and labetalol, 11 patients (7.6%) taking both oral antihyperten- sive agents and intravenous antihypertensive agents, and 15 patients (10.4%) taking only oral antihypertensive agents.
After excluding 35 patients in whom subclavian artery ste- nosis could not be evaluated accurately (mainly due to arti- facts), contrast-enhanced MRA, CTA, or DSA identified subclavian artery stenosis in 41patients (4.2%) of the re- maining 973 patients. All patients with subclavian artery ste- nosis had IASBD ≥10 mm Hg and/or IADBD ≥10 mm Hg.
Association between IABD and END
IASBD ≥10 mm Hg and IADBD ≥10 mm Hg were found in 104 (10.3%) and 53 (5.3%) patients, respectively. Among the 25 patients with IASBD ≥10 mm Hg and END, 22 patients (88.0%) had stroke progression and 3 patients (12.0%) had stroke recurrence. Moreover, among the 19 patients with IAD- BD ≥10 mm Hg and END, 15 patients (78.9%) had stroke progression and 4 patients (21.1%) had stroke recurrence.
The results of a multivariate analysis of the association be- tween IABD and END using clinical models (models 1 and 2) are presented in Table 2. In model 3, the multivariate anal- ysis controlled for sex, age, and the factors that were signifi- cant (p<0.1) in the univariate analysis: smoking, coronary ar- tery disease, prior stain use, left ventricular hypertrophy, NIHSS score, cerebral atherosclerosis, HGWMHs, throm- bolytic therapy, white blood cell count, and brachial-ankle pulse wave velocity. This model demonstrated that IASBD
≥10 mm Hg was significantly related to END (OR=1.75, 95%
CI=1.02–3.01, p= 0.041). The probability of END increased significantly when IASBD increased by 1 mm Hg (OR=1.04, 95% CI=1.01–1.08, p=0.025). IADBD ≥10 mm Hg was also significantly associated with END (OR=3.11, 95% CI=1.61–
5.99, p=0.001), and an IADBD increase of 1 mm Hg signifi- cantly increased the probability of ICAS (OR=1.10, 95% CI=
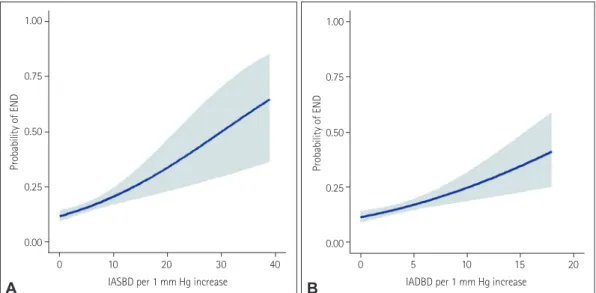
1.05–1.15, p=0.001). Patients who had both IASBD ≥10 mm Hg and IADBD ≥10 mm Hg tended to have END (OR=2.19, 95% CI=0.91–5.26, p=0.079). Fig. 1 illustrates the estimated probability of END according to IASBD and IADBD as con- tinuous variables, which indicates that the association of both IASBD and IADBD with END can be detected by simple vi- sual inspection.
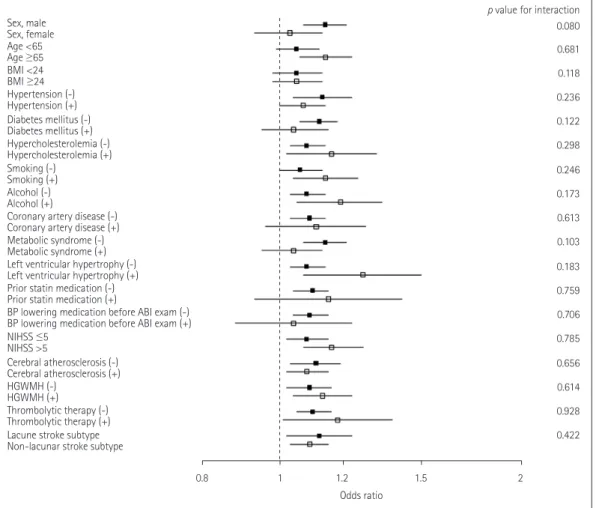
Association of IABD with END in subgroup populations
For the association of IABD with END, no subgroups had significant differences except IASBD for those aged 65 years or older having a history of hypertension (Figs. 2 and 3). A 1-mm Hg increase in IASBD was not associated with END in patients younger than 65 years (OR=0.98, 95% CI=0.92–
1.05) or those with hypertension (OR=1.01, 95% CI=0.97–
1.06). However, a 1-mm Hg increase in IASBD was associat- ed with END in patients aged 65 years or older (OR=1.13, 95% CI=1.05–1.20) and those without hypertension (OR=
1.18, 95% CI=1.09–1.28) (p for interaction=0.012 and 0.002, respectively).
Association between IABD and stroke outcome The association between IABD and stroke outcome based on the mRS score at 3 months after the index stroke was in- vestigated in 92.2% patients (929/1,008). The functional out- come was poor in 23.1% of the patients (215/929). Regarding mortality, 71 patients (7.0%) died during a median follow-up of 24 months (interquartile range=15–37 months). IASBD
≥10 mm Hg and IADBD ≥10 mm Hg were independently associated with a poor functional outcome (OR=1.95, 95%
CI=1.32–2.88, p=0.003; and OR=2.32, 95% CI=1.12–2.79, p=
0.004; respectively) after adjusting for sex, age, hypertension, metabolic syndrome, thrombolytic therapy, END, NIHSS score, stroke subtype, cerebral atherosclerosis, HGWMHs, and brachial-ankle pulse wave velocity (Table 3). The Kaplan- Meier curve demonstrated that the occurrence of mortality was significantly affected by both IASBD ≥10 mm Hg (p=
0.001) and IADBD ≥10 mm Hg (p=0.001) (Fig. 4). IASBD
≥10 mm Hg and IADBD ≥10 mm Hg were also related to mortality [hazard ratio (HR)=1.78, 95% CI=1.15–3.28, p=
0.029; and HR=3.14, 95% CI=1.25–4.41, p=0.012; respective- ly) after adjusting for sex, age, hypertension, diabetes melli-
Chang Y et al.
JCN
Table 1. Comparison of clinical characteristics according to presence of END
Total (n=1,008) No END (n=853) END (n=155) p Demographic characteristics
Sex, male 633 (62.8) 540 (63.3) 93 (60.0) 0.433
Age, years 63.4±11.4 63.0±11.6 65.5±9.9 0.012
BMI, kg/m2 23.8±3.3 23.8±3.4 23.9±3.2 0.834
Risk factors
Hypertension 636 (63.1) 543 (63.7) 93 (60.0) 0.385
Diabetes mellitus 335 (33.2) 279 (32.7) 56 (36.1) 0.406
Hypercholesterolemia 215 (21.3) 175 (20.5) 40 (25.8) 0.139
Smoking 303 (30.1) 246 (28.8) 57 (36.8) 0.047
Alcohol intake 139 (13.8) 116 (13.6) 23 (14.8) 0.681
Coronary artery disease 190 (18.8) 153 (17.9) 37 (23.9) 0.082
Metabolic syndrome 423 (42.0) 356 (41.7) 67 (43.2) 0.729
Left ventricular hypertrophy 101 (10.0) 79 (9.3) 22 (14.2) 0.060
Prior medication
Antithrombotic 155 (15.4) 135 (15.8) 20 (12.9) 0.353
Antihypertensive 542 (53.8) 462 (54.2) 80 (51.6) 0.558
Statin 144 (14.3) 131 (15.4) 13 (8.4) 0.023
Antihypertensive treatment before ABI examination 114 (11.3) 98 (11.5) 16 (10.3) 0.673
NIHSS score 2 [1–4] 2 [1–4] 4 [2–7] 0.001
Stroke subtype 0.146
Large-artery atherosclerosis 313 (31.1) 253 (29.7) 60 (38.7)
Small-vessel occlusion 272 (27.0) 235 (27.5) 37 (23.9)
Undetermined negative 348 (34.5) 302 (35.4) 46 (29.7)
Undetermined multiple causes 75 (7.4) 63 (7.4) 12 (7.7)
Cerebral atherosclerosis 0.050
ECAS 131 (13.0) 108 (12.7) 23 (14.8)
ICAS 221 (21.9) 178 (20.9) 43 (27.7)
Both ECAS and ICAS 68 (6.7) 54 (6.3) 14 (9.0)
HGWMHs 274 (27.2) 223 (26.1) 51 (32.9) 0.082
Thrombolytic therapy 91 (9.0) 62 (7.3) 29 (18.7) 0.001
Blood laboratory findings
Fasting glucose, mg/dL 117.0±40.6 117.3±39.6 115.2±46.0 0.551
White blood cell count, ×103/µL 8.1±3.0 8.2±3.1 7.7±2.5 0.029
Hemoglobin, mg/dL 13.7±2.0 13.8±2.0 13.5±2.0 0.146
Platelet count, ×103/µL 245.4±77.8 245.2±78.0 246.1±77.3 0.903
Total cholesterol, mg/dL 175.9±43.7 176.2±43.6 174.4±44.6 0.638
Triglycerides, mg/dL 119.8±76.3 119.3±75.6 122.7±80.5 0.607
High-density lipoprotein, mg/dL 42.3±11.2 42.4±11.3 41.6±10.9 0.809
Low-density lipoprotein, mg/dL 110.6±38.2 110.9±37.8 109.4±40.4 0.666
ABI parameters
Arm SBP, mm Hg 152.3±27.6 149.9±22.3 148.5±22.5 0.476
Arm DBP, mm Hg 84.6±15.4 85.8±12.4 85.6±11.8 0.882
baPWV, m/s 19.7±4.9 19.6±4.9 21.5±4.9 0.042
Pulse rate, beats/min 70.4±11.8 72.3±10.9 68.8±12.4 0.874
ABI 1.1±0.1 1.1±0.1 1.0±0.2 0.671
IASBD
≥5 mm Hg 377 (37.4) 305 (35.8) 72 (46.5) 0.011
≥10 mm Hg 104 (10.3) 79 (9.3) 25 (16.1) 0.010
≥15 mm Hg 18 (1.8) 10 (1.2) 8 (5.2) 0.003
Interarm BP and Stroke Progression
JCN
tus, metabolic syndrome, thrombolytic therapy, END, NIHSS score, stroke subtype, cerebral atherosclerosis, HGWMHs, and brachial-ankle pulse wave velocity (Table 3). Furthermore, the associations of IABD with END, poor functional outcome, and mortality were consistent after including the cardioem- bolic stroke subtype (Supplementary Table 2 and 3 in the on- line-only Data Supplement).
Predictability of IABD for END, poor functional outcome, and mortality
In terms of the predictability of IABD for END, an increase in IASBD of 1 mm Hg increased the continuous net reclassifi- cation improvement and integrated discrimination improve- ment by 0.015 (p=0.012) and 0.187 (p=0.001), respectively;
the corresponding values for an increase in IADBD of 1 mm Hg were 0.030 (p=0.001) and 0.280 (p=0.001).
In terms of the predictability of IABD for a poor functional outcome at 3 months after the index stroke, an increase in IASBD of 1 mm Hg increased the continuous net reclassifi- cation improvement and integrated discrimination improve- ment by 0.073 (p=0.009) and 0.195 (p=0.001), respectively;
the corresponding values for an increase in IADBD of 1 mm Hg were 0.032 (p=0.003) and 0.276 (p=0.001).
In terms of the predictability of IABD for mortality, an in- crease in IASBD of 1 mm Hg increased the continuous net reclassification improvement and integrated discrimination improvement by 0.104 (p=0.032) and 0.192 (p=0.002), respec- tively; the corresponding values for an increase in IADBD of Table 1. Comparison of clinical characteristics according to presence of END (continued)
Total (n=1,008) No END (n=853) END (n=155) p
Absolute difference, mm Hg 4.3±4.6 4.0±4.2 5.6±6.6 0.024
IADBD
≥5 mm Hg 271 (26.9) 209 (24.5) 62 (40.0) 0.001
≥10 mm Hg 53 (5.3) 34 (4.0) 19 (12.3) 0.001
≥15 mm Hg 18 (1.8) 9 (1.1) 9 (5.8) 0.001
Absolute difference, mm Hg 3.3±3.4 3.1±2.9 4.7±5.2 0.023
Both IASBD ≥5 mm Hg and IADBD ≥5 mm Hg 160 (15.9) 117 (13.7) 43 (27.7) 0.001
Both IASBD ≥10 mm Hg and IADBD ≥10 mm Hg 30 (3.0) 19 (2.2) 11 (7.1) 0.003
Data are n (%), mean±SD, or median [interquartile range] values.
ABI: ankle-brachial index, baPWV: brachial-ankle pulse wave velocity, BMI: body mass index, DBP: diastolic blood pressure, ECAS: extracranial cerebral atherosclerosis, END: early neurological deteriorat, HGWMHs: high-grade white matter hyperintensities, IADBD: interarm diastolic blood pressure dif- ference, IASBD: interarm systolic blood pressure difference, ICAS: intracranial cerebral atherosclerosis, NIHSS: National Institutes of Health Stroke Scale, SBP: systolic blood pressure.
Table 2. Adjusted ORs and CIs of the IABDs for END in multivariate71 logistic regression
Model 1 Model 2 Model 3
IASBD
≥5 mm Hg 1.54 (1.05–2.24)* 1.50 (1.02–2.21)* 1.43 (0.99–2.07)†
≥10 mm Hg 2.03 (1.18–3.49)* 1.82 (1.04–3.16)* 1.75 (1.02–3.01)*
≥15 mm Hg 3.27 (1.15–9.27)* 2.81 (0.98–8.19)† 3.02 (1.05–8.68)*
Per 1-mm Hg increase 1.05 (1.01–1.09)* 1.04 (1.00–1.08)* 1.04 (1.00–1.08)*
IADBD
≥5 mm Hg 1.92 (1.32–2.80)* 1.91 (1.30–2.80)* 1.94 (1.32–2.81)*
≥10 mm Hg 3.61 (1.89–6.89)* 3.23 (1.67–6.25)* 3.11 (1.61–5.99)*
≥15 mm Hg 5.46 (1.94–15.41)* 4.85 (1.68–13.92)* 4.89 (1.72–13.88)*
Per 1-mm Hg increase 1.10 (1.05–1.16)* 1.10 (1.05–1.15)* 1.10 (1.05–1.15)*
Both IASBD ≥5 mm Hg and IADBD ≥5 mm Hg 2.27 (1.47–3.50)* 2.25 (1.45–3.50)* 2.22 (1.44–3.42)*
Both IASBD ≥10 mm Hg and IADBD ≥10 mm Hg 2.83 (1.20–6.69)* 2.38 (0.98–5.78)† 2.19 (0.91–5.26)† Data are OR (95% CI) values. The ORs of IABPs in model 1 were adjusted sex, age, body mass index, hypertension, diabetes mellitus, hypercholesterol- emia, smoking, alcohol intake, coronary artery disease, metabolic syndrome, left ventricular hypertrophy, National Institutes of Health Stroke Scale score, and brachial-ankle pulse wave velocity. In model 2, the ORs of IABPs were adjusted for model 1 plus significant laboratory and imaging factors (white blood cell count, total cholesterol, low-density lipoprotein, thrombolysis, cerebral atherosclerosis, and high-grade white matter hyperintensi- ties). Model 3 included sex, age, and covariates that were significantly associated with END in univariate logistic regression (p<0.1).
*p<0.05, †p<0.1.
END: early neurological deteriorat, IABP: interarm blood pressure difference, OR: odds ratio, IADBD: interarm diastolic blood pressure difference, IAS- BD: interarm systolic blood pressure difference.
Chang Y et al.
JCN
1.00
0.75
0.50
0.25
0.00
Probability of END
0 5 10 15 20 IADBD per 1 mm Hg increase
1.00
0.75
0.50
0.25
0.00
Probability of END
0 10 20 30 40 IASBD per 1 mm Hg increase
A B
Fig. 1. Relationship between END and the IABD according to the IASBD (A) and the IADBD (B). Blue lines and gray shadows indicate the estimated probabilities and 95% CIs, respectively, for the development of END according to IASBD (A) or IADBD (B) based on the generalized additive model with splines. END: early neurological deterioration, IABD: interarm blood pressure difference, IADBD: interarm difference in the diastolic blood pres- sure, IASBD: interarm difference in the systolic blood pressure.
Fig. 2. Association of interarm BP difference with early neurological deterioration according to interarm difference in the systolic blood pressure subgroups. Subgroups were divided according to the median values of continuous or ordinal variables. p values are for interactions between sub- groups. ABI: ankle-brachial index, BMI: body mass index, BP: blood pressure, HGWMH: high-grade white-matter hyperintensity, NIHSS: National In- stititues of Health Stroke Scale.
Sex, male Sex, female Age <65 Age ≥65 BMI <24 BMI ≥24 Hypertension (-) Hypertension (+) Diabetes mellitus (-) Diabetes mellitus (+) Hypercholesterolemia (-) Hypercholesterolemia (+) Smoking (-)
Smoking (+) Alcohol (-) Alcohol (+)
Coronary artery disease (-) Coronary artery disease (+) Metabolic syndrome (-) Metabolic syndrome (+) Left ventricular hypertrophy (-) Left ventricular hypertrophy (+) Prior statin medication (-) Prior statin medication (+)
BP lowering medication before ABI exam (-) BP lowering medication before ABI exam (+) NIHSS ≤5
NIHSS >5
Cerebral atherosclerosis (-) Cerebral atherosclerosis (+) HGWMH (-)
HGWMH (+) Thrombolytic therapy (-) Thrombolytic therapy (+) Lacune stroke subtype Non-lacunar stroke subtype
0.941 0.012 0.628 0.002 0.264 0.865 0.631 0.887 0.190 0.252 0.286 0.260 0.117 0.103 0.159 0.918 0.685 0.238 p value for interaction
0.8 1 1.2 1.5 2 Odds ratio
Interarm BP and Stroke Progression
JCN
1 mm Hg were 0.142 (p=0.001) and 0.232 (p=0.015).
DISCUSSION
The key findings of our study are that IASBD ≥10 mm Hg and IADBD ≥10 mm Hg were associated with END, poor functional outcome, and mortality even after adjusting for stroke severity (NIHSS score), thrombolysis, and brachial-an- kle pulse wave velocity, which were closely related to the stroke prognosis. These associations were consistent whether IABD was examined as a binary or continuous variable. Our find- ings further suggest that IASBD and IADBD are of additional benefit in predicting the occurrence of the END, poor short- term functional outcome, and mortality.
IABD is independently associated with all-cause mortality and cardiovascular mortality,26 including in cohorts without known cardiovascular disease.27 Moreover, previous studies involving elderly hypertensive patients have found the risks of cardiovascular disease and mortality to be relatively high
in patients with IASBD ≥10 mm Hg.28 A cohort study of medicines at a renal clinic found that increased IASBD was related to an increased risk of mortality.29 On the other hand, the Framingham Heart Study found that increased IABD was not associated with mortality despite the risk of cardio- vascular disease being increased in a long-term follow-up of 3,390 patients without a history of cardiovascular disease.30
Few previous studies have investigated IABD and stroke outcomes. Previous studies of acute ischemic stroke have found both IASBD and IADBD to be associated with long- term mortality.9 Cerebral artery stenosis (which is closely re- lated to recurrent stroke), stroke progression, and END were found to be independently associated with IABD in patients with noncardioembolic stroke.31 Our findings support the results of these previous studies; moreover, because END could produce a poor long-term prognosis in stroke patients, our results may provide additional evidence for the associa- tion between IABD and a poor long-term prognosis. Our study further suggests that bilateral brachial blood pressure
0.080 0.681 0.118 0.236 0.122 0.298 0.246 0.173 0.613 0.103 0.183 0.759 0.706 0.785 0.656 0.614 0.928 0.422 p value for interaction Sex, male
Sex, female Age <65 Age ≥65 BMI <24 BMI ≥24 Hypertension (-) Hypertension (+) Diabetes mellitus (-) Diabetes mellitus (+) Hypercholesterolemia (-) Hypercholesterolemia (+) Smoking (-)
Smoking (+) Alcohol (-) Alcohol (+)
Coronary artery disease (-) Coronary artery disease (+) Metabolic syndrome (-) Metabolic syndrome (+) Left ventricular hypertrophy (-) Left ventricular hypertrophy (+) Prior statin medication (-) Prior statin medication (+)
BP lowering medication before ABI exam (-) BP lowering medication before ABI exam (+) NIHSS ≤5
NIHSS >5
Cerebral atherosclerosis (-) Cerebral atherosclerosis (+) HGWMH (-)
HGWMH (+) Thrombolytic therapy (-) Thrombolytic therapy (+) Lacune stroke subtype Non-lacunar stroke subtype
0.8 1 1.2 1.5 2 Odds ratio
Fig. 3. Association of interarm BP difference with early neurological deterioration according to interarm difference in the diastolic blood pressure subgroups. Subgroups were divided according to the median values of continuous or ordinal variables. p values are for interactions between sub- groups. ABI: ankle-brachial index, BMI: body mass index, BP: blood pressure, HGWMH: high-grade white-matter hyperintensity, NIHSS: National Instititues of Health Stroke Scale.
Chang Y et al.
JCN
measurements provide an easy screening tool for estimating the probability of END in acute noncardioembolic stroke patients.
We found that IASBD ≥5 mm Hg was not significantly associated with END, whereas IASBD ≥5 mm Hg was pre- viously found to be associated with the presence of periph- eral arterial disease and cardiovascular mortality in patients taking aspirin for asymptomatic atherosclerosis, and was also related to multiorgan damage in patients with type 2 diabe- tes mellitus.7,32 These differences from our results may be due to differences in the sample sizes, demographic characteris-
tics, risk factors, study populations, or methods. In contrast, IADBD ≥5 mm Hg was independently related to END in our study, whereas a study of patients with type 2 diabetes melli- tus found that IADBD was not associated with end-organ damage.32 Since IADBD may vary across each measurements and differences between IASBD and IADBD may not be large (the mean difference was less than 3 mm Hg in our study), caution is needed when interpreting the relationship between IADBD and END.
Our subgroup analysis showed that increased IASBD was associated with being aged 65 years or older and not having
0 20 40 60
All-cause mortality All-cause mortality
Months after index stroke
0 20 40 60 Months after index stroke 100
90 80 70 60 50 40 30 20 10 0
100 90 80 70 60 50 40 30 20 10 0
Survival probability (%) Survival probability (%)
IASBD <10 mm Hg
IASBD ≥10 mm Hg IADBD <10 mm Hg
IADBD ≥10 mm Hg
A B
Fig. 4. Kaplan-Meier survival plots of noncardioembolic stroke patients vs. IASBD (A) and IADBD (B). These curves show that the occurrence of all- cause mortality depends on IASBD (p=0.001) (A) and IADBD (p=0.001) (B). IADBD: interarm difference in the diastolic blood pressure, IASBD: inter- arm difference in the systolic blood pressure.
Table 3. Results from the multivariate analyses of the functional outcome at 3 months and long-term all-cause mortality after the index stroke ac- cording to IASBD and IADBD
IABD, mm Hg Poor functional outcome (mRS score ≥3)* All-cause mortality†
OR (95% CI) p HR (95% CI) p
IASBD
≥5 1.13 (0.85–1.51) 0.390 1.15 (0.66–1.98) 0.574
≥10 1.95 (1.32–2.88) 0.003 1.78 (1.15–3.28) 0.029
≥15 2.22 (1.24–3.97) 0.007 3.15 (1.53–5.94) 0.012
Per 1-increase 1.03 (1.01–1.07) 0.004 1.04 (1.01–1.08) 0.005
IADBD
≥5 1.24 (0.91–1.70) 0.162 1.61 (1.02–3.12) 0.047
≥10 2.32 (1.12–2.79) 0.004 3.14 (1.25–4.41) 0.012
≥15 3.82 (1.32–6.38) 0.041 6.32 (3.41–9.45) 0.021
Per 1-increase 1.05 (1.01–1.10) 0.014 1.10 (1.04–1.17) 0.001
Both IASBD ≥5 and IADBD ≥5 1.24 (0.86–1.81) 0.234 1.64 (0.94–2.78) 0.087
Both IASBD ≥10 and IADBD ≥10 2.67 (1.36–5.35) 0.010 7.67 (3.76–12.83) 0.018
*Adjusted for sex, age, hypertension, metabolic syndrome, thrombolytic therapy, END, NIHSS score, stroke subtype, cerebral atherosclerosis, HGWMHs, and brachial-ankle pulse wave velocity, †Adjusted for sex, age, hypertension, diabetes mellitus, metabolic syndrome, thrombolytic therapy, END, NIHSS score, stroke subtype, cerebral atherosclerosis, HGWMHs, and brachial-ankle pulse wave velocity.
CI: confidence intervals, END: early neurological deterioration, HGWMH: high-grade white-matter hyperintensity, , HR: hazard ratio, IADBD: interarm dia- stolic blood pressure difference, IASBD: interarm systolic blood pressure difference, mRS: modified Rankin Scale, NIHSS: National Instititues of Health Stroke Scale, OR: odds ratio.
Interarm BP and Stroke Progression
JCN
hypertension, but not with being younger than 65 years or not having a history of hypertension. We were unable to de- velop any appropriate hypotheses for explaining these results.
In patients with noncardioembolic stroke younger than 65 years or with a history of hypertension, factors other than IASBD may affect END. Additional research is needed to understand these results.
In our study, having both IASBD ≥10 mm Hg and IADBD
≥10 mm Hg was associated with a poor functional outcome at 3 months after the index stroke and also with mortality.
Previous studies involving stroke patients have found both IASBD ≥10 mm Hg and IADBD ≥10 mm Hg to be related to all-cause mortality and cardiovascular mortality.9 A pre- vious meta-analysis found that IASBD ≥15 mm Hg was as- sociated with increased risks of cardiovascular mortality and all-cause mortality.26 Our study supports these previous stud- ies and suggests the new information that IABD ≥10 mm Hg is associated with a poor short-term functional outcome in stroke patients. Considering our findings and previous stud- ies, IABD ≥10 mm Hg could be a useful indicator for the risks of poor functional outcome and mortality.
Several mechanisms could be hypothesized for explain- ing the relationships of IABD with the occurrence of END, poor functional outcome, and mortality. A large IABD was found to be related to progressed atherosclerosis and steno- sis of the aorta and its large branches.10 Thus, large differenc- es in blood pressure may reduce the blood flow and the per- fusion of brain tissue,33 with this hemodynamic dysfunction or hypoperfusion possibly playing a role in END and a poor prognosis.34 Furthermore, progressed systemic atherosclero- sis is related to early mortality in stroke patients.11 Also, a previous study revealed that IADBD due to ischemia in one arm was associated with flow-mediated dilatation in the arm, which is an index of endothelial dysfunction or injury.35 An- other study found that an elevated plasma level of 20-hy- droxyeicosatetraenoic acid, which is a biomarker for endo- thelial dysfunction, was related to END in acute ischemic stroke.36
Increased arterial stiffness could also explain our results.
A population-based study found that large IABDs were re- lated to arterial stiffness.37 Another study found that the bra- chial-ankle pulse wave velocity was higher in patients with IABD ≥10 mm Hg than in those with IABD <10 mm Hg.8 Arterial stiffness as indicated by the baPWV is independent- ly associated with END, poor functional outcome, and mor- tality in patients with acute cerebral infarction.38-40
This study was subject to some limitations. Although con- secutive patients were included and ABI was routinely per- formed, selection bias might have been present due to the retrospective design of the study. Even though an adjusted
stroke severity scale (NIHSS) was used, spasticity or flaccidity of the muscle or muscle tone—which could affect IABD—was not evaluated. Making accurate automatic, simultaneous, and multiple IABD measurements is recommended. Although the measurements were made in this study simultaneously with an automatic device, the consistency of the measure- ments is difficult to determine because IABD was measured once only.
In conclusions, this study has demonstrated that IASBD
≥10 mm Hg and IADBD ≥10 mm Hg are independently as- sociated with END, poor functional outcome, and mortality.
The findings suggest that IABD ≥10 mm Hg could be a use- ful indicator for the risks of END, poor functional outcome, and mortality.
Supplementary Materials
The online-only Data Supplement is available with this arti- cle at https://doi.org/10.3988/jcn.2018.14.4.555.
Conflicts of Interest
The authors have no financial conflicts of interest.
Acknowledgements
Tae-Jin Song provided financial support in the form of a Basic Science Re- search Program through the National Research Foundation of Korea funded by the Ministry of Education (2015R1D1A1A01057934, 2018R1 D1A1B07040959).
REFERENCES
1. Weimar C, Mieck T, Buchthal J, Ehrenfeld CE, Schmid E, Diener HC, et al. Neurologic worsening during the acute phase of ischemic stroke. Arch Neurol 2005;62:393-397.
2. Thanvi B, Treadwell S, Robinson T. Early neurological deterioration in acute ischaemic stroke: predictors, mechanisms and management.
Postgrad Med J 2008;84:412-417.
3. Ois A, Martinez-Rodriguez JE, Munteis E, Gomis M, Rodríguez- Campello A, Jimenez-Conde J, et al. Steno-occlusive arterial disease and early neurological deterioration in acute ischemic stroke. Cere- brovasc Dis 2008;25:151-156.
4. Dávalos A, Toni D, Iweins F, Lesaffre E, Bastianello S, Castillo J. Neu- rological deterioration in acute ischemic stroke: potential predictors and associated factors in the European cooperative acute stroke study (ECASS) I. Stroke 1999;30:2631-2636.
5. Seners P, Turc G, Oppenheim C, Baron JC. Incidence, causes and predictors of neurological deterioration occurring within 24 h fol- lowing acute ischaemic stroke: a systematic review with pathophysi- ological implications. J Neurol Neurosurg Psychiatry 2015;86:87-94.
6. Mancia G, Fagard R, Narkiewicz K, Redón J, Zanchetti A, Böhm M, et al. 2013 ESH/ESC Guidelines for the management of arterial hy- pertension: the Task Force for the management of arterial hyperten- sion of the European Society of Hypertension (ESH) and of the Eu- ropean Society of Cardiology (ESC). J Hypertens 2013;31:1281-1357.
7. Clark CE, Taylor RS, Shore AC, Campbell JL. Prevalence of systolic in- ter-arm differences in blood pressure for different primary care popu- lations: systematic review and meta-analysis. Br J Gen Pract 2016;66:
e838-e847.
8. Chang Y, Choi GS, Lim SM, Kim YJ, Song TJ. Interarm systolic and diastolic blood pressure difference is diversely associated with cere-
Chang Y et al.
JCN
bral atherosclerosis in noncardioembolic stroke patients. Am J Hy- pertens 2017;31:35-42.
9. Kim J, Song TJ, Song D, Lee HS, Nam CM, Nam HS, et al. Interarm blood pressure difference and mortality in patients with acute isch- emic stroke. Neurology 2013;80:1457-1464.
10. Clark CE, Aboyans V. Interarm blood pressure difference: more than an epiphenomenon. Nephrol Dial Transplant 2015;30:695-697.
11. Roquer J, Ois A, Rodríguez-Campello A, Gomis M, Munteis E, Jimé- nez-Conde J, et al. Atherosclerotic burden and early mortality in acute ischemic stroke. Arch Neurol 2007;64:699-704.
12. Song TJ, Cho HJ, Chang Y, Choi K, Jung AR, Youn M, et al. Low plasma proportion of omega 3-polyunsaturated fatty acids predicts poor outcome in acute non-cardiogenic ischemic stroke patients. J Stroke 2015;17:168-176.
13. Stergiou GS, Kollias A, Destounis A, Tzamouranis D. Automated blood pressure measurement in atrial fibrillation: a systematic review and meta-analysis. J Hypertens 2012;30:2074-2082.
14. Motobe K, Tomiyama H, Koji Y, Yambe M, Gulinisa Z, Arai T, et al.
Cut-off value of the ankle-brachial pressure index at which the accu- racy of brachial-ankle pulse wave velocity measurement is dimin- ished. Circ J 2005;69:55-60.
15. Song TJ, Chang Y, Shin MJ, Heo JH, Kim YJ. Low levels of plasma omega 3-polyunsaturated fatty acids are associated with cerebral small vessel diseases in acute ischemic stroke patients. Nutr Res 2015;35:
368-374.
16. Adams HP Jr, Bendixen BH, Kappelle LJ, Biller J, Love BB, Gordon DL, et al. Classification of subtype of acute ischemic stroke. Defini- tions for use in a multicenter clinical trial. TOAST. Trial of Org 10172 in Acute Stroke Treatment. Stroke 1993;24:35-41.
17. Song TJ, Kim YD, Yoo J, Kim J, Chang HJ, Hong GR, et al. Associa- tion between aortic atheroma and cerebral small vessel disease in pa- tients with ischemic stroke. J Stroke 2016;18:312-320.
18. Samuels OB, Joseph GJ, Lynn MJ, Smith HA, Chimowitz MI. A stan- dardized method for measuring intracranial arterial stenosis. AJNR Am J Neuroradiol 2000;21:643-646.
19. North American Symptomatic Carotid Endarterectomy Trial Collab- orators, Barnett HJM, Taylor DW, Haynes RB, Sackett DL, Peerless SJ, et al. Beneficial effect of carotid endarterectomy in symptomatic pa- tients with high-grade carotid stenosis. N Engl J Med 1991;325:445- 20. Fazekas F, Chawluk JB, Alavi A, Hurtig HI, Zimmerman RA. MR 453.
signal abnormalities at 1.5 T in Alzheimer’s dementia and normal aging. AJR Am J Roentgenol 1987;149:351-356.
21. Chung JW, Kim N, Kang J, Park SH, Kim WJ, Ko Y, et al. Blood pres- sure variability and the development of early neurological deteriora- tion following acute ischemic stroke. J Hypertens 2015;33:2099-2106.
22. Lovett JK, Coull AJ, Rothwell PM. Early risk of recurrence by sub- type of ischemic stroke in population-based incidence studies. Neu- rology 2004;62:569-573.
23. Kim HC, Choi DP, Ahn SV, Nam CM, Suh I. Six-year survival and causes of death among stroke patients in Korea. Neuroepidemiology 2009;32:94-100.
24. Yamashina A, Tomiyama H, Takeda K, Tsuda H, Arai T, Hirose K, et
al. Validity, reproducibility, and clinical significance of noninvasive brachial-ankle pulse wave velocity measurement. Hypertens Res 2002;
25:359-364.
25. Verberk WJ, Kessels AG, Thien T. Blood pressure measurement method and inter-arm differences: a meta-analysis. Am J Hypertens 2011;24:1201-1208.
26. Clark CE, Taylor RS, Shore AC, Ukoumunne OC, Campbell JL. Asso- ciation of a difference in systolic blood pressure between arms with vascular disease and mortality: a systematic review and meta-analysis.
Lancet 2012;379:905-914.
27. Aboyans V, Criqui MH, McDermott MM, Allison MA, Denenberg JO, Shadman R, et al. The vital prognosis of subclavian stenosis. J Am Coll Cardiol 2007;49:1540-1545.
28. Clark CE, Taylor RS, Shore AC, Campbell JL. The difference in blood pressure readings between arms and survival: primary care cohort study. BMJ 2012;344:e1327.
29. Agarwal R, Bunaye Z, Bekele DM. Prognostic significance of between- arm blood pressure differences. Hypertension 2008;51:657-662.
30. Weinberg I, Gona P, O’Donnell CJ, Jaff MR, Murabito JM. The sys- tolic blood pressure difference between arms and cardiovascular dis- ease in the Framingham Heart Study. Am J Med 2014;127:209-215.
31. Lee SJ, Lee DG. Distribution of atherosclerotic stenosis determining early neurologic deterioration in acute ischemic stroke. PLoS One 2017;
12:e0185314.
32. Spannella F, Giulietti F, Fedecostante M, Ricci M, Balietti P, Cocci G, et al. Interarm blood pressure differences predict target organ damage in type 2 diabetes. J Clin Hypertens (Greenwich) 2017;19:472-478.
33. Ochoa VM, Yeghiazarians Y. Subclavian artery stenosis: a review for the vascular medicine practitioner. Vasc Med 2011;16:29-34.
34. Huang YC, Tsai YH, Lee JD, Weng HH, Lin LC, Lin YH, et al. He- modynamic factors may play a critical role in neurological deteriora- tion occurring within 72 hrs after lacunar stroke. PLoS One 2014;9:
e108395.
35. Hu W, Li J, Su H, Wang J, Xu J, Liu Y, et al. The inter-arm diastolic blood pressure difference induced by one arm ischemia: a new approach to assess vascular endothelia function. PLoS One 2014;9:e84765.
36. Yi X, Han Z, Zhou Q, Lin J, Liu P. 20-Hydroxyeicosatetraenoic acid as a predictor of neurological deterioration in acute minor ischemic stroke. Stroke 2016;47:3045-3047.
37. Canepa M, Milaneschi Y, Ameri P, AlGhatrif M, Leoncini G, Spall- arossa P, et al. Relationship between inter-arm difference in systolic blood pressure and arterial stiffness in community-dwelling older adults.
J Clin Hypertens (Greenwich) 2013;15:880-887.
38. Saji N, Kimura K, Kawarai T, Shimizu H, Kita Y. Arterial stiffness and progressive neurological deficit in patients with acute deep sub- cortical infarction. Stroke 2012;43:3088-3090.
39. Kim J, Song TJ, Kim EH, Lee KJ, Lee HS, Nam CM, et al. Brachial- ankle pulse wave velocity for predicting functional outcome in acute stroke. Stroke 2014;45:2305-2310.
40. Kim J, Song TJ, Song D, Lee KJ, Kim EH, Lee HS, et al. Brachial-an- kle pulse wave velocity is a strong predictor for mortality in patients with acute stroke. Hypertension 2014;64:240-246.