Original Article
Comparison of total plasma lysophosphatidic acid and serum CA-125 as a tumor marker in the diagnosis and
follow-up of patients with epithelial ovarian cancer
Tugan Bese1, Merve Barbaros2, Elif Baykara3, Onur Guralp2, Salih Cengiz3, Fuat Demirkiran1, Cevdet Sanioglu1, Macit Arvas1
1Division of Gynecologic Oncology, Department of Obstetrics and Gynecology, 2Department of Obstetrics and Gynecology, Cerrahpaşa Medical School, 3Institute of Forensic Sciences, Istanbul University, Istanbul, Turkey
Objective: To evaluate the role of lysophosphatidic acid (LPA) as a tumor marker in diagnosis and follow-up of patients with epithelial ovarian cancer.
Methods: Eighty-seven epithelial ovarian cancer patients, 74 benign ovarian tumor patients, and 50 healthy women were enrolled in the study. Twenty-nine of 87 epithelial ovarian cancer patients were followed up for 6 cycles of paclitaxel-carboplatin chemotherapy. CA-125 and total plasma LPA levels were measured preoperatively and before each chemotherapy cycle.
Results: Preoperative total plasma LPA and serum CA-125 levels were significantly higher in patients with epithelial ovarian cancer compared to patients with benign ovarian tumors and healthy women. Cut-off value for LPA was determined as 1.3 μmol/L and sensitivity, specificity, positive predictive value and negative predictive value were 95%, 92%, 95% and 92%, respectively. Mean total plasma LPA level of 29 patients who received chemotherapy was 7.21±6.63 μmol/L preoperatively and 6.84±6.34 μmol/L, 6.34±5.92 μmol/L, 6.14±5.79 μmol/L, 5.86±5.68 μmol/L, 5.23±5.11 μmol/L and 5.21±5.32 μmol/L in measurements held just before the 1st, 2nd, 3rd, 4th, 5th and 6th chemotherapy cycles, respectively (ANOVA, p=0.832). Total plasma LPA levels decreased slightly with chemotherapy administration and there was a weak negative correlation (Spearman, rs=−0.151, p=0.034), compared to a significant negative correlation in CA-125 (Spearman, rs=−0.596, p<0.001).
Conclusion: LPA is a better biomarker for diagnosis of epithelial ovarian cancer compared to CA-125. However, measurement of total plasma LPA levels during chemotherapy administration have no superiority to the serum CA-125 levels.
Key Words: Lysophosphatidic acid, CA-125, Epithelial ovarian cancer, Follow-up, Chemotherapy, Tumor marker
Received August 9, 2010, Accepted September 13, 2010 Correspondence to Tugan Bese
Division of Gynecologic Oncology, Department of Obstetrics and Gynecology, Cerrahpasa Medical School, Istanbul University, Dr.
Rifat Pasa Sok. No 19-1 D.2, Goztepe, Istanbul, Turkey Tel: 0090533-430-70-44, Fax: 0090212-347-84-81 E-mail: [email protected]
INTRODUCTION
Lysophosphatidic acid (1-acyl-2-hydroxy-sn-glycero-3-phos- phate, LPA), is the simplest glycerophospholipid, which me- diates a wide range of biological actions. It consists of various species with both saturated and unsaturated fatty acid tails. It is a normal constituent of serum that is released by activated platelets during platelet aggregation.1,2 LPA is present in mammalian serum in an active form (bound to albumin) at concentrations of 1-5 μM, but is not detectable in platelet- poor plasma or whole blood, suggesting that LPA is produced
during blood clotting.2,3
In early investigations, LPA, a multifunctional phospholipid mediator, was identified as a smooth muscle contracting sub- stance in vitro by Vogt et al.4 Afterwards, Xu et al.5 described the purification, characterization, and identification of an ovarian cancer activating factor in ascites from ovarian cancer patients. This factor was composed of various species of LPA.
LPA is suggested to display a broad spectrum of biological activities. Its principal effects are growth-related, such as in- duction of cellular proliferation and suppression of apoptosis.
It decreases the sensitivity to chemotherapeutic drugs and in- creases the invasiveness of ovarian cancer cells.6-9 LPA exerts these effects via kinases and tyrosin phosphorylation. LPA al- so increases the levels of growth factors such as vascular endo- thelial growth factor (VEGF) and interleukin (IL)-8; as such, it increases the neovascularization and worsens the prognosis in ovarian malignancies.10
These all suggest that LPA may be particularly important for initiation and progression of ovarian cancer.
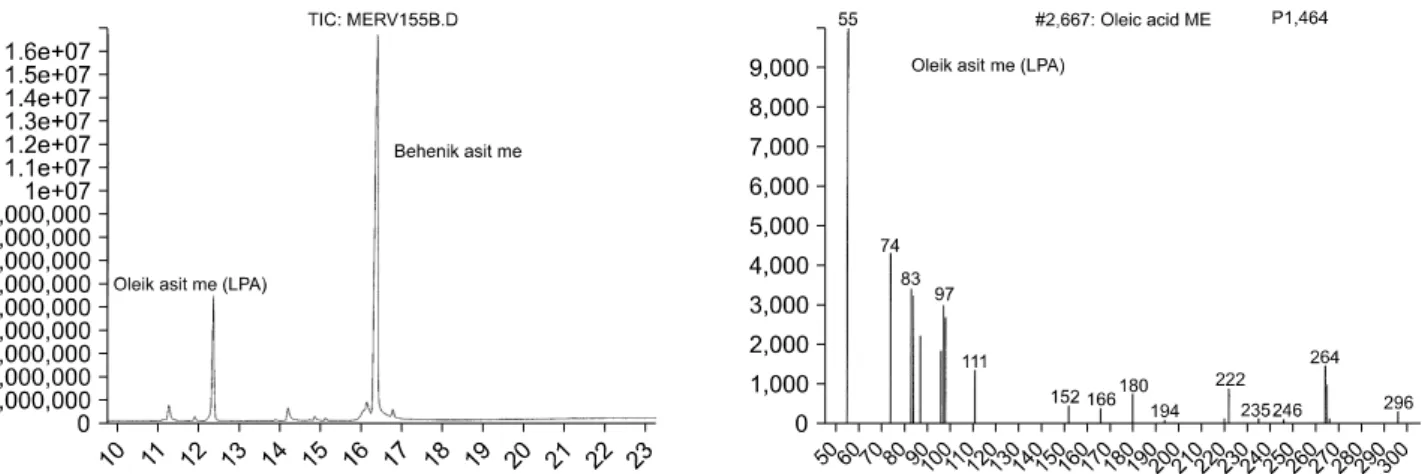
Fig. 1. An example for representation of lysophosphatidic acid (LPA) by gas chromotography and mass spectrophotometry.
The aim of this study is to measure total plasma LPA levels in epithelial ovarian carcinoma (EOC) patients and to demon- strate if LPA is as beneficial as CA-125 as a tumor marker in the diagnosis and follow-up of the disease.
MATERIALS AND METHODS
Eighty-seven EOC patients and 74 benign ovarian tumor pa- tients (operated on in Istanbul University, Cerrahpasa Medical Faculty, Gynecology and Obstetrics Department, Gynecologic Oncology Division), and 50 healthy women were enrolled in this study. Patients with the diagnosis of germ cell tumors and sex cord stromal tumors were not included into the study group. Of 87 EOC patients, 10 patients had stage 1, 63 patients had stage 3, and 14 patients had stage 4 disease.
Initial serum CA-125 and total plasma LPA levels were measured in all patients with an ovarian mass and a planned operation. After the pathologic examination, 87 patients were diagnosed as EOC. Out of 87 EOC patients who needed che- motherapy, 29 patients could be followed up in our clinic dur- ing chemotherapy administration.
Serum CA-125 and total plasma LPA levels were measured before each chemotherapy cycle in 29 of 87 patients. LPA anal- ysis was performed by using the biochemical method of Xu et al.3 Since LPA is mainly produced as a result of platelet activa- tion, we first aimed to eliminate the LPA production from the platelets and then to measure LPA level which is thought to be produced only from the ovarian cancer cells. In order to pre- vent platelet activation and phospholipase activity, 5 mL ve- nous blood was taken preoperatively from all patients, and these samples were collected into EDTA containing tubes.
Whole blood was centrifuged at 580 rpm for 5 minutes; after- wards, in order to remove remaining platelets, supernatant was centrifuged at 8,000 rpm for another 5 minutes. The plas- ma samples were then stored at −80oC deep freeze (NuAire Inc., 51006537, Plymouth, USA). Analyses of total plasma LPA levels were performed in Istanbul University, Laboratory of Institute of Forensic Sciences.
For analyzing CA-125 levels, another 5 mL venous blood from each patient was taken into another tube preoperatively. Analy- sis of serum CA-125 was performed in Cerrahpasa Medical Faculty, Fikret Biyal Laboratory with a CA-125 II kit that utilised the RIA technique (Centocor Ortho Biotech Inc., Horsham, PA, USA). Cut-off value for CA-125 was accepted as 35 U/mL.
Patients received 6 doses of chemotherapy with 175 mg/m2/3 hours paclitaxel + carboplatin area under the curve (AUC) 6.
All the patients in the study group had their serum CA-125 and total plasma LPA levels measured before each chemotherapy administration.
1. Analysis of total plasma LPA
For total plasma LPA analysis, first the lipids were extracted, then LPA was separated from other lipids by thin layer chro- matography; and finally, after hydrolysis and derivatization, the analysis was performed by gas chromatography and mass spectrophotometry (GC-MS).
First of all, 750 μL plasma, 1.5 mL chloroform-methanol mixture (1:2, v/v) and 0.4 mL acetic acid buffer solution were added into a glass tube and vortexed. Then, 0.5 mL chloro- form and 0.5 mL distilled water were added and vortexed again. The mixture was centrifuged at 4,000 rpm for 3 minutes.
The lower layer (organic) was transferred into a micro-cen- trifuge tube and evaporated. Then 50 μL methanol-chloro- form (2:1, v/v) was added onto the residue and loaded onto the thin layer, mobile phase as follows:
Chloroform/methanol/%20 ammonium hydroxide (60:35:
8).
The standard LPA and other phospholipids were detected by spraying % 0.1 (ANSA) 8-anilino-1-naphthalene sulphonic acid in H2O onto the layer and observing the spots with UV light at 366 nm wavelength. The LPA spots were then scraped from the silica layer and transferred into clean glass tubes with 100 μL 0.000059 M behenic acid/hexane.
Two hundred μL 0.5 M hydrochloric acid (HCl) was added and the mixture was incubated in the oven for 45 minutes at 110oC. Then 200 μL 1 M ethanolic potasium hydroxide was
Table 1. LPA and CA-125 levels in EOC, benign ovarian tumors and healthy controls
No. Mean LPA*
(μmol/L) Mean CA-125† (U/mL)
EOC 87 4.29±4.52 764.63±1183.44
Benign ovarian tumor 74 1.57±0.92 38.14±69.40 Healthy women 50 0.6±0.42 23.90±16.73 EOC: epithelial ovarian cancer, LPA: lysophosphatidic acid.
*Mean LPA levels were significantly different between the groups (ps<0.001).
†Mean CA-125 level in EOC patients was significantly higher than the level in healthy women or in patients with benign ovarian tu- mor (ps<0.001). However, the levels were not significantly differ- ent between the patients with benign ovarian tumor and healthy women (p=0.69).
Fig. 2. Receiver operating characteristic (ROC) curve for lysophos- phatidic acid (LPA) (The best cut-off value is 1.3 μmol/L).
added, and again the mixture was incubated in the oven for 45 minutes at 110oC. After it returned to room temperature, 50 μL 10 M HCl was added and vortexed. The mixture was ex- tracted with 750 μL pentane. Following centrifugation at 6,000 rpm for 3 minutes, organic phase (upper) was trans- ferred into a micro-centrifuge tube. The solution was again extracted using 250 μL pentane and upper layer was added to the previous one. After evaporation, 200 μL boron trichlo- ride-methanol was added and it was derivatized in the oven at 80oC for 45 minutes. At room temperature 40 μL chloroform was added and incubated for 10 minutes. One μL of this sol- ution was injected into GC- MS (Fig. 1).
2. Equipment
One point five mL micro-centrifuge tubes; glass tubes; vor- tex; Nüve FN 400 oven; Heraeus Megafuge 10 R centrifuge;
Scaltec SBA 31 analytical balance; 25, 100, 250 mL volumetric flasks; HP GC-MS (HP 6890 GC /HP 5973 MSD); Merck/DC- Alufolien 20×20 cm; Kieselgel 60 F254.
3. Chemicals
Merck (Merck & Co. Inc., Whitehouse Station, NJ, USA)/
Methanol (CH3OH), extra pure; Merck/Chloroform (CHCl3) extra pure; J.T. Baker (Phillipsburg, NJ, USA)/n-pentane (CH3
(CH2)3CH3), min 95%; Sigma (Sigma-Aldrich, St. Louis, USA)/
Boron trichloride-methanol 10%; Riedel de Haen (Seelze, Germany)/acetic acid, 100%, glacial (CH3COOH); Delta kimya San. (Istanbul, Turkey)/absolute ethyl alcohol 99%, 5(C2H3
OH); Sigma (Sigma-Aldrich, St.Louis, USA)/Behenic acid (C22
H44O2); Sigma (Sigma-Aldrich, St.Louis, MO, USA)/L-α-LPA, oleoyl (C18:1, cis-9), (oleoyl-sn-glycero-3- phosphate) sodium salt min 98%; Prolabo (Leicestershire, UK)/Potassium hydrox- ide KOH, pellets min 84%; Merck/HCl 37% extra pure.
4. Statistical analyses
All data obtained from patients were evaluated by using SPSS ver. 11.0 (SPSS Inc., Chicago, IL, USA). In comparison of groups, one way variance analysis (ANOVA), Spearman’s cor- relation analysis, Mann Whitney U-tests, and the Kruskal Wallis test were used. Two-sided p-value of <0.05 was con- sidered to be statistically significant.
RESULTS
Mean age was 58.1±11.9, 45.9±14.7 and 48.2±5.1 in ovarian cancer patients, benign ovarian tumor patients and healthy women group, respectively (ANOVA, p<0.001). Three hun- dred eighty LPA measurements were performed in 211 cases.
LPA could not be detected in plasma in 26 of 380 (6.8%) measurements. Total plasma LPA levels which were below the level of detection were assumed to be 0.1 μmol/L for statistical analysis. The mean preoperative total plasma LPA was 4.29±4.52 μmol/L for EOC patients (n=87) and 1.57±0.92 μmol/L for benign ovarian tumor patients (n=74) (Mann
Whitney U, p<0.001). The mean preoperative total plasma LPA was 0.6±0.42 μmol/L in healthy women. Mean total plas- ma LPA were found to be higher in patients with both EOC and benign ovarian tumors compared to the healthy women (Mann Whitney U, p<0.001 and p<0.001, respectively). Mean total plasma LPA and serum CA-125 levels are given in Table 1.
In order to find a cut-off value, plasma LPA levels were ana- lysed by receiver operating characteristic (ROC) curve (Fig. 2).
Cut-off values and sensitivity and specificity levels are listed in Table 2. The best cut-off value according to our study popula- tion was selected as 1.3 μmol/L.
When we take the cut-off value as 1.3 μmol/L, 83 of 87 (95%) EOC patients had their plasma LPA levels equal to or above that value; whereas 46 of 50 (92%) healthy women had LPA levels below 1.3 μmol/L. Therefore, for the cut-off value of 1.3 μmol/L sensitivity, specificity, positive predictive value and negative predictive value were 95%, 92%, 95% and 92%, respectively.
Twenty-nine patients with EOC were followed during che-
Fig. 3. Change of the total plasma lysophosphatidic acid (LPA) levels during chemotherapy administration.
Fig. 4. Mean total plasma lysophosphatidic acid (LPA) values before each chemotherapy administration.
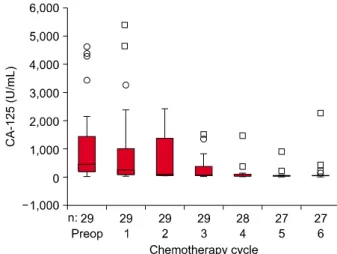
Fig. 5. Change of serum CA-125 levels during chemotherapy admi- nistration.
Table 2. Sensitivity, specificity, PPV and NPV according to various cut-off values in EOC patients compared to healthy women
Sensitivity (%)
Specificity (%)
PPV (%)
NPV (%) Cut-off for LPA
1.2 μmol/L 98 86 92 95
1.3 μmol/L 95 92 95 92
1.4 μmol/L 92 94 96 87
1.5 μmol/L 88 100 100 83
Cut-off for CA-125
35 U/mL 83 72 84 70
PPV: positive predictive value; NPV: negative predictive value, EOC:
epithelial ovarian carcinoma, LPA: lysophosphatidic acid.
motherapy administration. A correlation analysis was per- formed in order to observe how total plasma LPA levels changed in time with the administration of chemotherapy.
Total plasma LPA levels decreased slightly with each chemo- therapy cycle and there was a weak negative correlation (Spearman, rs=−0.151, p=0.034) (Fig. 3).
Mean preoperative total plasma LPA level of the 29 patients who received chemotherapy was 7.21±6.63 μmol/L. Mean total plasma LPA levels were 6.84±6.34 μmol/L before the first chemotherapy (n=29), 6.34±5.92 μmol/L before the second chemotherapy (n=29), 6.14±5.79 μmol/L before the third chemotherapy (n=29), 5.86±5.68 μmol/L before the fourth chemotherapy (n=28), 5.23±5.11 μmol/L before the fifth chemotherapy (n=27), and 5.21±5.32 μmol/L before the sixth chemotherapy (n=27).
As the group variance with the Levene test was not sig- nificantly different (p=0.808), ANOVA was performed in or- der to compare means of total plasma LPA before each chemo- therapy administration. Means of total plasma LPA were not significantly different from each other (p=0.832) (Fig. 4).
A correlation analysis was performed in order to observe how serum CA-125 levels changed with each chemotherapy
cycle. Serum CA-125 levels showed a significant negative cor- relation with chemotherapy administration (Spearman, rs =
−0.596, p<0.001) (Fig. 5).
Before the operation, mean serum CA-125 of 29 patients was 1,134.9±1,462.8 U/mL. Mean serum CA-125 was 958.2±
1,428.6 U/mL before the first chemotherapy (n=29), 631.4±
860.1 U/mL before the second chemotherapy (n=29), 253.6±
392 U/mL before the third chemotherapy (n=29), 108.7±
281.9 U/mL before the fourth chemotherapy (n=28), 64.6±
177.5 U/mL before the fifth chemotherapy (n=27), and 127±
437.5 U/mL before the sixth chemotherapy (n=27) (Fig. 6).
In order to evaluate whether there was a difference among the means of serum CA-125 measured before each chemo- therapy administration, the homogenity of groups was as- sessed by the Levene test which revealed that variance was statistically different (p<0.001). Therefore, the non-para- metric Kruskal-Wallis test was used for comparison. Medians of serum CA-125 were significantly different (p<0.001). In
Fig. 6. Mean serum CA-125 values before each chemotherapy admi- nistration.
Table 3. Significances (p-values) of the comparisons of the medians of serum CA-125
Preop. 1.CT 2.CT 3.CT 4.CT 5.CT 6.CT Preop. 0.290 0.024 0.000 0.000 0.000 0.000 1.CT 0.290 0.126 0.003 0.000 0.000 0.000 2.CT 0.024 0.126 0.051 0.001 0.000 0.000 3.CT 0.000 0.003 0.051 0.142 0.031 0.021 4.CT 0.000 0.000 0.001 0.142 0.350 0.296 5.CT 0.000 0.000 0.000 0.031 0.350 0.703 6.CT 0.000 0.000 0.000 0.021 0.296 0.703 CT: chemotherapy.
p: 0.05/21=0.0024.
order to investigate which group causes statistical differences among medians of CA-125, the Mann Whitney U-test was used. P value was accepted as 0.05/21=0.0024. Results of this analysis are presented in Table 3.
DISCUSSION
One of the most convenient methods in the follow-up of the patients with ovarian cancer and evaluation of response to the treatment is to monitor the levels of the tumor markers.11,12 Bast et al.13 reported a new monoclonal antibody, OC125, which is an IgG1 immunoglobulin and reacts with an antigenic determinant named CA-125 in 1981. Serum CA-125 levels were elevated in 82% of advanced stage EOC patients.14 Serum CA-125 is the most commonly used marker for diagnosis of EOC as well as monitoring and evaluating the response to treatment.15 The CA-125 assay has been assumed to correlate with the primary cytoreductive surgery outcomes, clinical re- sponse, and progression during chemotherapy. In our study, both preoperative CA-125 and total plasma LPA levels were significantly higher in EOC patients compared to healthy women and patients with benign ovarian tumors; moreover
elevated preoperative mean serum CA-125 decreased sig- nificantly after the third chemotherapy administration. Lavin et al.16 reported that persistence of elevated serum CA-125 lev- els despite the 3rd chemotherapy administration, would show the poor responders. Dalen et al.17 also reported that patients who have high preoperative CA-125 levels and whose CA-125 levels did not return to normal levels after the 3rd cycle of che- motherapy, would have poor prognosis.
The first clinical study in the literature about total plasma LPA and gynecologic malignancies was published by Xu et al.,3 in 1998. Their study group consisted of 84 patients with various gynecologic malignancies (ovarian, endometrial, cer- vical, primary peritoneal surfaces cancer). This group was compared with another group composed of healthy women (n=48), benign gynecologic diseases (myoma uteri, adnexal mass and endometriosis, n=17), and non-gynecologic malig- nancies (lymphoma, breast cancer, n=16). As a result of their study, for detection of malignancy they determined the cut-off value of total plasma LPA as 1.3 μmol/L. Sensitivity and spe- cificity for detecting gynecologic cancers were 95% and 89%, respectively. In their study, 47 of 48 (98%) patients with ovar- ian cancer and 80 of 84 (95%) women with any gynecologic malignancy had elevated levels of LPA; whereas no patients with breast cancer or leukemia showed elevated plasma LPA levels. In our study, we also determined the most appropriate cut-off value of LPA as 1.3 μmol/L. However, Xu et al.3 in- cluded all gynecologic malignancies; in contrast, we included only EOC patients.
Our study is the first clinical study in the literature that eval- uates the change of total plasma LPA and serum CA-125 levels with each chemotherapy cycle. Total plasma LPA levels de- creased slightly with chemotherapy administration, but this decline was not statistically significant. Contrarily, serum CA-125 levels significantly decreased in response to chemo- therapy administration. Therefore we suggest that, as a fol- low-up parameter, total plasma LPA is not as beneficial as CA-125. We had published a similar study before in which we compared serum CA-125 and IGF-1 levels and their changes with each chemotherapy cycle. As is the case in LPA, measure- ment of serum IGF–1 levels had not brought any additional ben- efit compared to CA-125 in the follow-up of EOC patients.18 Some studies reported that plasma LPA levels were in- creased in malignant effusions in patients with cancer, partic- ularly in ovarian cancer patients.19,20 Baker et al.21 found that LPA levels in malignant effusions including ovarian cancer were significantly increased compared to controls. However, the plasma concentrations of neither individual LPA species (LPA 16:0, 18:2, 18:1, 18:0, 20:4) nor total LPA levels differed between ovarian cancer patients and controls. Pozlep et al.22 also stated that LPA analysis did not differentiate benign from malignant ovarian tumors.
In contrast to two latter studies, Sedláková et al.23 published a study in which plasma LPA levels were found to be elevated in patients with ovarian cancer and stated that it could be a
useful marker in EOC, particularly in the early stages of the disease, although CA-125 levels were not evaluated in their study. These aforementioned clinical studies did not compare LPA with other tumor markers and did not evaluate the changes after chemotherapy and clinical responses.
We also determined that initial total plasma LPA levels were significantly higher in EOC patients compared to patients with benign ovarian tumors and healthy women. Therefore, total plasma LPA is a useful marker for diagnostic purposes.
However, since total plasma LPA levels did not significantly change after the administration of chemotherapy, LPA does not seem to be a good indicator for monitorization of response to chemotherapy.
Yu et al.24 discussed the relevance of LPA to the pathogenesis of ovarian cancer in their study. They summarized the issue as:
LPA promotes growth and survival of ovarian cancer cells;8,25-29 ovarian cancer cells can produce LPA, forming an autocrine loop mediating growth, survival, and motility of tumor cells; LPA action increases expression of angiogenic and metastatic fac- tors such as IL-6, IL-8, VEGF, uPA, and Cox-2;10,30-34 exogenous LPA can increase growth and metastasis of ovarian cancer cells;8 ovarian cancer cells can induce LPA production by mesothelial cells, thereby increasing invasion and metastasis;34 expression of LPP3, an enzyme that dephosphorylates LPA, reduces growth and survival of ovarian cancer cells in nude mice;35 and inhibitors of autotaxin, the main enzyme producing LPA, de- crease metastatic potential in some tumor models.36
Although the role of LPA in pathogenesis and metastasis of ovarian cancer is very well-known as mentioned above, still we have no data that LPA is superior to CA-125 in the follow-up of patients with ovarian cancer. Our study is the first clinical study in the literature that evaluates serum CA-125 and total plasma LPA levels concomitantly and evaluates the changes of LPA levels after each chemotherapy administration.
In the literature there is no clinical trial which investigates the association between initial total plasma LPA values and treatment outcomes and survival. Further studies are needed to evaluate this issue.
In conclusion, LPA is a better biomarker for diagnosis of EOC compared to CA-125. Total plasma LPA as well as CA-125 significantly increase in EOC patients compared to patients with benign ovarian masses and healthy subjects. On the other hand, in the follow-up of EOC patients, measure- ment of total plasma LPA levels during chemotherapy admin- istration have no superiority to serum CA-125 levels.
CONFLICT OF INTEREST
The authors declare there are no conflicts of interest relevant to this article.
REFERENCES
1. Aoki J, Taira A, Takanezawa Y, Kishi Y, Hama K, Kishimoto T, et
al. Serum lysophosphatidic acid is produced through diverse phospholipase pathways. J Biol Chem 2002; 277: 48737-44.
2. Eichholtz T, Jalink K, Fahrenfort I, Moolenaar WH. The bio- active phospholipid lysophosphatidic acid is released from acti- vated platelets. Biochem J 1993; 291(Pt 3): 677-80.
3. Xu Y, Shen Z, Wiper DW, Wu M, Morton RE, Elson P, et al.
Lysophosphatidic acid as a potential biomarker for ovarian and other gynecologic cancers. JAMA 1998; 280: 719-23.
4. Vogt W. Pharamacologically active acidic phospholipids and glycolipids. Biochem Pharmacol 1963; 12: 415-20.
5. Xu Y, Gaudette DC, Boynton JD, Frankel A, Fang XJ, Sharma A, et al. Characterization of an ovarian cancer activating factor in ascites from ovarian cancer patients. Clin Cancer Res 1995; 1:
1223-32.
6. Mills GB, May C, McGill M, Roifman CM, Mellors A. A putative new growth factor in ascitic fluid from ovarian cancer patients:
identification, characterization, and mechanism of action. Cancer Res 1988; 48: 1066-71.
7. Mills GB, May C, Hill M, Campbell S, Shaw P, Marks A. Ascitic fluid from human ovarian cancer patients contains growth fac- tors necessary for intraperitoneal growth of human ovarian ad- enocarcinoma cells. J Clin Invest 1990; 86: 851-5.
8. Xu Y, Fang XJ, Casey G, Mills GB. Lysophospholipids activate ovarian and breast cancer cells. Biochem J 1995; 309(Pt 3):
933-40.
9. Furui T, LaPushin R, Mao M, Khan H, Watt SR, Watt MA, et al.
Overexpression of edg-2/vzg-1 induces apoptosis and anoikis in ovarian cancer cells in a lysophosphatidic acid-independent manner. Clin Cancer Res 1999; 5: 4308-18.
10. Schwartz BM, Hong G, Morrison BH, Wu W, Baudhuin LM, Xiao YJ, et al. Lysophospholipids increase interleukin-8 ex- pression in ovarian cancer cells. Gynecol Oncol 2001; 81: 291- 300.
11. Bast RC Jr, Klug TL, Schaetzl E, Lavin P, Niloff JM, Greber TF, et al. Monitoring human ovarian carcinoma with a combination of CA 125, CA 19-9, and carcinoembryonic antigen. Am J Obstet Gynecol 1984; 149: 553-9.
12. Brioschi PA, Irion O, Bischof P, Bader M, Forni M, Krauer F.
Serum CA 125 in epithelial ovarian cancer: a longitudinal study.
Br J Obstet Gynaecol 1987; 94: 196-201.
13. Bast RC Jr, Feeney M, Lazarus H, Nadler LM, Colvin RB, Knapp RC. Reactivity of a monoclonal antibody with human ovarian carcinoma. J Clin Invest 1981; 68: 1331-7.
14. Bast RC Jr, Klug TL, St John E, Jenison E, Niloff JM, Lazarus H, et al. A radioimmunoassay using a monoclonal antibody to monitor the course of epithelial ovarian cancer. N Engl J Med 1983; 309: 883-7.
15. Paulsen T, Marth C, Kaern J, Nustad K, Kristensen GB, Trope C.
Effects of paclitaxel on CA-125 serum levels in ovarian cancer patients. Gynecol Oncol 2000; 76: 326-30.
16. Lavin PT, Knapp RC, Malkasian G, Whitney CW, Berek JC, Bast RC Jr. CA 125 for the monitoring of ovarian carcinoma during primary therapy. Obstet Gynecol 1987; 69: 223-7.
17. Dalen A, Favier J, Burges A, Hasholzner U, de Bruijn HW, Dobler-Girdziunaite D, et al. Prognostic significance of CA 125 and TPS levels after 3 chemotherapy courses in ovarian cancer patients. Gynecol Oncol 2000; 79: 444-50.
18. Bese T, Nomir SK. The importance of serum insulin-like growth factor-I level determination in the follow-up of patients with ep- ithelial ovarian cancer. Eur J Gynaecol Oncol 2001; 22: 372-6.
19. Westermann AM, Havik E, Postma FR, Beijnen JH, Dalesio O, Moolenaar WH, et al. Malignant effusions contain lysophospha- tidic acid (LPA)-like activity. Ann Oncol 1998; 9: 437-42.
20. Xiao YJ, Schwartz B, Washington M, Kennedy A, Webster K, Belinson J, et al. Electrospray ionization mass spectrometry
analysis of lysophospholipids in human ascitic fluids: compar- ison of the lysophospholipid contents in malignant vs non- malignant ascitic fluids. Anal Biochem 2001; 290: 302-13.
21. Baker DL, Morrison P, Miller B, Riely CA, Tolley B, Westermann AM, et al. Plasma lysophosphatidic acid concentration and ovar- ian cancer. JAMA 2002; 287: 3081-2.
22. Pozlep B, Meleh M, Kobal B, Verdenik I, Osredkar J, Kralj LZ, et al. Use of lysophosphatidic acid in the management of benign and malignant ovarian tumors. Eur J Gynaecol Oncol 2007; 28:
394-9.
23. Sedláková I, Vávrová J, Tosner J, Hanousek L. Lysophosphatidic acid: an ovarian cancer marker. Eur J Gynaecol Oncol 2008; 29:
511-4.
24. Yu S, Murph MM, Lu Y, Liu S, Hall HS, Liu J, et al. Lysophos- phatidic acid receptors determine tumorigenicity and aggressi- veness of ovarian cancer cells. J Natl Cancer Inst 2008; 100:
1630-42.
25. Fang X, Gaudette D, Furui T, Mao M, Estrella V, Eder A, et al.
Lysophospholipid growth factors in the initiation, progression, metastases, and management of ovarian cancer. Ann N Y Acad Sci 2000; 905: 188-208.
26. Fang X, Schummer M, Mao M, Yu S, Tabassam FH, Swaby R, et al. Lysophosphatidic acid is a bioactive mediator in ovarian cancer. Biochim Biophys Acta 2002; 1582: 257-64.
27. Goetzl EJ, Dolezalova H, Kong Y, Hu YL, Jaffe RB, Kalli KR, et al. Distinctive expression and functions of the type 4 endothe- lial differentiation gene-encoded G protein-coupled receptor for lysophosphatidic acid in ovarian cancer. Cancer Res 1999; 59:
5370-5.
28. Eder AM, Sasagawa T, Mao M, Aoki J, Mills GB. Constitutive and lysophosphatidic acid (LPA)-induced LPA production: role of phospholipase D and phospholipase A2. Clin Cancer Res
2000; 6: 2482-91.
29. Luquain C, Singh A, Wang L, Natarajan V, Morris AJ. Role of phospholipase D in agonist-stimulated lysophosphatidic acid synthesis by ovarian cancer cells. J Lipid Res 2003; 44: 1963-75.
30. Fang X, Yu S, Bast RC, Liu S, Xu HJ, Hu SX, et al. Mechanisms for lysophosphatidic acid-induced cytokine production in ovar- ian cancer cells. J Biol Chem 2004; 279: 9653-61.
31. Hu YL, Tee MK, Goetzl EJ, Auersperg N, Mills GB, Ferrara N, et al. Lysophosphatidic acid induction of vascular endothelial growth factor expression in human ovarian cancer cells. J Natl Cancer Inst 2001; 93: 762-8.
32. Pustilnik TB, Estrella V, Wiener JR, Mao M, Eder A, Watt MA, et al. Lysophosphatidic acid induces urokinase secretion by ovarian cancer cells. Clin Cancer Res 1999; 5: 3704-10.
33. Symowicz J, Adley BP, Woo MM, Auersperg N, Hudson LG, Stack MS. Cyclooxygenase-2 functions as a downstream media- tor of lysophosphatidic acid to promote aggressive behavior in ovarian carcinoma cells. Cancer Res 2005; 65: 2234-42.
34. Ren J, Xiao YJ, Singh LS, Zhao X, Zhao Z, Feng L, et al.
Lysophosphatidic acid is constitutively produced by human per- itoneal mesothelial cells and enhances adhesion, migration, and invasion of ovarian cancer cells. Cancer Res 2006; 66: 3006-14.
35. Tanyi JL, Morris AJ, Wolf JK, Fang X, Hasegawa Y, Lapushin R, et al. The human lipid phosphate phosphatase-3 decreases the growth, survival, and tumorigenesis of ovarian cancer cells: vali- dation of the lysophosphatidic acid signaling cascade as a target for therapy in ovarian cancer. Cancer Res 2003; 63: 1073-82.
36. Baker DL, Fujiwara Y, Pigg KR, Tsukahara R, Kobayashi S, Murofushi H, et al. Carba analogs of cyclic phosphatidic acid are selective inhibitors of autotaxin and cancer cell invasion and metastasis. J Biol Chem 2006; 281: 22786-93.