논문접수일:2007년 11월 13일 채택일:2007년 12월 4일 교신저자:이규완, 136-705 서울시 성북구 안암동 5가 126-1
고려대학교 의과대학 산부인과학교실 전화:02) 920-5333ㆍ전송:02) 921-5357 E-mail:[email protected]
This study was supported by the Brain Korea Project 21.
Protein expression patterns of epithelial ovarian cancers characterized by proteomic analysis
Seon Young Park1, Jae Yun Song1, Jae Kwan Lee1, Nak Woo Lee1, Hak Hyun Jung2, Kyu Wan Lee1 Departments of 1Obstetrics and Gynecology, 2Otolaryngology-Head and Neck Surgery, Korea University
College of Medicine, Seoul, Korea
Objective:The purpose of the present study is to identify the expression profiles of proteins in human epithelial ovarian cancers, as compared with those seen in normal ovarian tissues, via proteomic analysis.
Methods:Three epithelial ovarian cancer tissues and three normal ovarian tissues were intraoperatively obtained. We performed two- dimensional electrophoresis in order to separate tissue proteins by molecular weight, and then compared protein expression patterns. 21 up-regulated spots were identified by MALDI-TOF in epithelial ovarian cancers. Then, the expression of some of the up-regulated proteins was evaluated at the mRNA level via RT-PCR, in both the epithelial ovarian cancer tissues and the normal ovarian tissues.
Results:Proteomic analysis revealed about 200 up-regulated spots in epithelial ovarian cancer tissues, of which 21 were selected and identified by MALDI-TOF. 16 proteins were matched to MLC3nm, MACMARCKS, MYL2, S100A14, MIA, VHL, GUCA1B, RABL2A, BRMS1, IFI30, VILIP1, MAPRE1, NME5, DIO2, KLK 2, and CPA2. The up-regulation of these proteins was also evaluated at the mRNA level via RT-PCR, which revealed that MACMARCKS, S100A14, GUCA1B, RABL2A, VILIP1, MAPRE1, NME5, DIO2, and KLK2 were distinctly up-regulated in the cancer tissues. Five protein spots could not be matched, even with RT-PCR.
Conclusion:This proteomic analysis may constitute a powerful tool for the identification and characterization of many promising candidate proteins related to epithelial ovarian cancers.
Key Words : Ovarian cancer, Protein expression, Tumor marker
INTRODUCTION
Epithelial ovarian cancer remains the major cause of death from gynecological malignancies in the United States. Advanced stage, high grade, and significant residual tumors after initial surgery may be factors associated with poor prognosis.1 Although ovarian cancer treatment has advanced considerably in the last 20 years, the long-term survival rates of patients with stage III and IV tumors has not changed appreciably.2 However, the identification of some biomarkers, associated with tumor cell biology, may prove helpful in the earlier diagnosis of cancer, as well as
the prediction of prognoses.
Most cells contain thousands of proteins and some over-expressed proteins in cancer cells can be released into the bloodstream, where they can be measured. The serum CA 125 antigen level is currently accepted as a serum marker for ovarian cancer, and is detectable in 80% of patients.3 Although it remains the most reliable marker in the monitoring of the course of epithelial ovarian cancer, the CA 125 assay is fairly inadequate screening test for malignancy, and lacks the sensitivity required for early diagnosis. This is because it is detected primarily in conjunction with advanced papillary serous ovarian tumors, as well as some mucinous tumors.4,5 Two additional serum markers, OVX1 and macrophage-colony stimulating factor (M-CSF or colony stimulating factor-1), may prove to be useful as alternative markers, and are associated with the aggressiveness of ovarian cancers.6,7 However, a tumor
marker specific to epithelial ovarian cancer has not yet been identified, and the development and therapeutic targets if such a marker remain quite unclear.
Malignant transformation of normal ovarian epithelial cells may be induced by genetic disruptions in proli- feration, apoptosis, senescence, or DNA repair mecha- nisms.8 Such phenomena may be detected and classified by the evaluation of differential protein or gene expression in cancer tissues. Proteomics may also play a critical role in the rapid identification of new protein targets, and help to elucidate the underlying molecular events associated with the development and progression of cancer. Proteomic analysis using 2-D gel revealed three candidate proteins (52kDa FK506 binding protein, Rho G-protein dissociation ihibitor, glyoxalase I) invasive papillary serous ovarian carcinoma tissue, as compared with normal ovarian tissue, and suggested the possibility of early detection and the development of therapeutic targets.9 Recently, it was reported that Surface-Enhanced Laser Desorption/Ionization Time of Flight (SELDI-TOF) analysis of serum in ovarian cancer patients may be useful with regard to early diagnosis, but the actual proteins expressed have not yet been the focus of serious study.10
The aim of this study is to compare the protein expression profiles between epithelial ovarian cancer tissues and normal ovarian tissues, in order to identify proteins related to the cancer, via the proteomic analysis of two-dimensional electrophoresis and Matrix-Assisted Laser Desorption and Ionization Time of Flight Mass Spectrometry (MALDI-TOF MS). Candidate proteins are also identified at the mRNA level by RT-PCR. These candidate proteins may provide useful information regarding the possibility of serum markers in the detection of epithelial ovarian cancer.
MATERIALS AND METHODS
1. Sample preparation
Three with cervical squamous cell carcinoma samples (T3) acquired during surgery and three normal cervical
tissue samples acquired during uterine myoma surgery were obtained at operation and stored at -70oC. Histo- pathological diagnosis was initially performed, after which the cancer tissues and normal cervical tissues were used for proteomic analyses. Some of these tissue samples were also used in other molecular works.
Each sample was mixed and homogenized with a sample buffer (5 M urea, 2 M thiourea, 2 mM TBP, 2% CHAPS, 2% sulfobetadine, 0.5% carrier ampholytes, 40 mM Tris, protease inhibitor, then brought up to a total volume of 0.5 ml with water). After ultracentrifugation, the supernatants of both samples were collected. The protein concentration of each sample was quantified by the Bradford method, using a Bio-Rad protein assay kit (BIO-RAD, Hercules, CA, USA). After five minutes of incubation at room temperature, the absorbance of each sample was measured at 595 nm, and the protein quantity was calculated.
2. Two-dimensional electrophoresis and image analysis Isoelectric focusing (IEF) instrumentation, immobilized pH gradient gel (IPG) strips (17 cm, pH3-10 or 17 cm, pH4-7), and related reagents were purchased from Bio-Rad (Hercules, CA, USA). IPG strips were rehydrated, and focused for an automated overnight run in ceramic strip holders, using an 8-hour rehydration period, followed by 1 hour each at 500, 1000, and 2000 V, respectively, followed by 5000 V, for a total of 50 kVh. Immediately prior to the loading of focused IPG strips on the two-dimensional gels, the strips were incubated in equilibrium buffer (6M urea, 10% sodium dodecylsulfate
<SDS>, pH8.8 Tris, glycerol, dithiothreitol <DTT>) for 15 minutes, followed by 15 minutes of incubation in the same solution, except that the DTT was replaced by iodoace- tamide. Two-dimensional SDS-PAGE 12% gels (Acrylamide/
bis <30% T, 2.67% C>, distilled water, 1.5 M Tris-HCl pH8.8, 10% SDS, 10% ammonium persulfate, 0.1%
tetra-methyl-ethylenediamine <TEMED>) were then cast with the glass plate sandwiches from the BIO-RAD Protean II xi chambers (20×20 cm, 1.5 mm thickness, Hercules, CA, USA). The SDS-equilibrated IPG gels were sealed on
top of the two-dimensional gels using 0.5% agarose with bromophenol blue. SDS gels were then run until the tracking dye was within 1 cm of the bottom of the gel.
Silver staining was used to visualize the proteins, and the gel images were scanned. Silver staining was perfor- med, as described by Hochstrasser et al.11 The scanned 2-D gels were then analyzed using the Progenesis workstation (version 2003.03, Nonlinear Dynamics, USA) image analysis software. After standardization and warping of all the spots using image analysis, the unique spots, as well as those which exhibited three-fold or higher increase in normalized volume, as compared to their normal coun- terpart images, were selected as significant spots for further analysis. Three serous ovarian cancer gels were compared with three normal ovarian tissue gels as controls and protein spots which had been up or down-regulated in the epithelial ovarian carcinoma samples by more than 3-folds according to densitometry, were then used for protein analysis.
3. Identification of proteins by MALDI-TOF
The selected spots were subjected to in-gel trypsin digestion and analysis using MALDI-TOF MS. The stained protein spots of interest were excised, and small pieces of these gels were destained with 20 mM potassium ferri- cyanide and 100 mM sodium thiosulfate. The protein spots were then washed in distilled water. After being allowed to react with 150μl of 200 mM ammonium bicarbonate for 20 minutes, the spots were again washed in distilled water. They were dehydrated repeatedly with acetonitrile, and dried in a speed vacuum for 30 minutes. After being allowed to react with 30μl of 50 mM ammonium bicarbonate and 5μl of trypsin (0.1μg/μl), they were reactivated for 12-16 hours at 37oC, and then with 100μl of a 50 mM ammonium bicarbonate solution in a shaker for 1 hour at 37oC. After centrifugation, each supernatant was dehydrated with 100μl acetonitrile for 10 minutes at 37oC. Each supernatant collected after this repeated dehy- dration process was then dried for more than 6 hours.
MALDI-TOF analysis was ultimately performed on these
dried samples.
Alpha-cyano-1-hydroxycinnamic acid (Sigma, St. Louis, MO, USA) was used as a matrix. Oneμl of the matrix (10 mg/mL) and 1μl of the eluted peptides were deposited on a MALDI plate for MALDITOF-MS analysis. The tryptic peptides were separated and analyzed by MALDITOF MS, in order to obtain the mass fingerprints of the peptide fragments from the proteins separated on the 2D gels.
MALDITOF MS was conducted using a Voyager-DE-STR time of flight (TOF) mass spectrometer (Perseptive Biosy- stem, MA, USA) equipped with a model VSL-337ND nitrogen laser (Laser science, MA, USA; 337 nm, 3 ns pulse length) and a dual microchannel plate detector (Galileo, MA, USA). The acceleration voltage in the ion source was 20,000 V. Reflector mode and delayed extrac- tion conditions were used in this study. Protein identifi- cation was based on comparison of the peptide masses of the MALDI-TOF spectra experimentally derived from the isolated proteins by enzymatic digestion with the corres- ponding theoretical peptide masses calculated for all the protein sequences present in the NCBI protein databases.
This comparison was conducted using Sequest software.
4. Investigation of mRNA expression by RT-PCR RT-PCR was then performed to confirm the expression of up-regulated proteins in cervical cancers. The total RNA was extracted from frozen sample of each group using TRIZOL Reagent (Life Technologies, Gaithersburg, MD, USA). 200μl of chloroform (Sigma, St. Louis, MO, USA) was added to each sample for 10 minutes, and centri- fugation progressed for 15 minutes at 4oC. The superna- tants from each sample were isolated and 500μl of isopropanol was added. After 10 minutes incubation at room temperature and 10 minutes centrifugation at 4oC, the isopropanol was removed and 1 ml of 75% cold ethanol was added. 8 more minutes of centrifugation were conducted at 4oC, and the cold ethanol was removed. After drying for 5 minutes at room temperature, the pellet was melted with 50μl of DEPC.
After preparation, 2μg of total RNA was added to 0.5μg
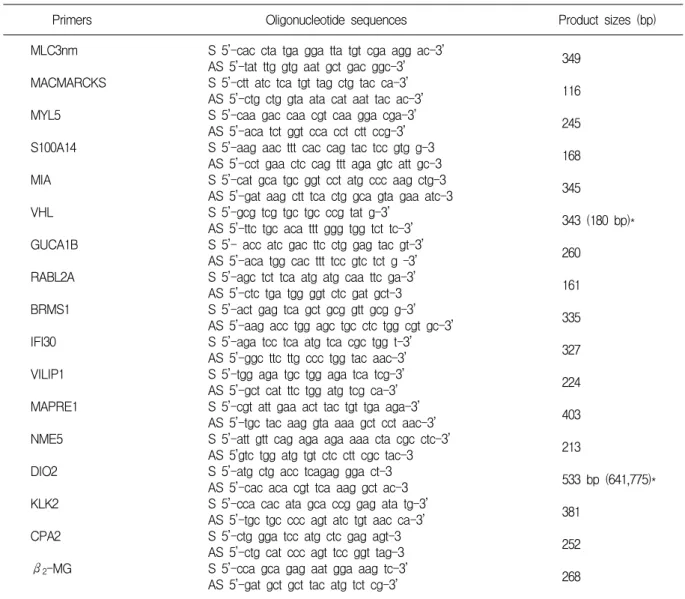
Table 1. Oligonucleotide primer sequence and product size for PCR amplification
Primers Oligonucleotide sequences Product sizes (bp)
MLC3nm MACMARCKS MYL5 S100A14 MIA VHL GUCA1B RABL2A BRMS1 IFI30 VILIP1 MAPRE1 NME5 DIO2 KLK2 CPA2 β2-MG
S 5’-cac cta tga gga tta tgt cga agg ac-3’
AS 5’-tat ttg gtg aat gct gac ggc-3’
S 5’-ctt atc tca tgt tag ctg tac ca-3’
AS 5’-ctg ctg gta ata cat aat tac ac-3’
S 5’-caa gac caa cgt caa gga cga-3’
AS 5’-aca tct ggt cca cct ctt ccg-3’
S 5’-aag aac ttt cac cag tac tcc gtg g-3 AS 5’-cct gaa ctc cag ttt aga gtc att gc-3 S 5’-cat gca tgc ggt cct atg ccc aag ctg-3 AS 5’-gat aag ctt tca ctg gca gta gaa atc-3 S 5’-gcg tcg tgc tgc ccg tat g-3’
AS 5’-ttc tgc aca ttt ggg tgg tct tc-3’
S 5’- acc atc gac ttc ctg gag tac gt-3’
AS 5’-aca tgg cac ttt tcc gtc tct g –3’
S 5’-agc tct tca atg atg caa ttc ga-3’
AS 5’-ctc tga tgg ggt ctc gat gct-3 S 5’-act gag tca gct gcg gtt gcg g-3’
AS 5’-aag acc tgg agc tgc ctc tgg cgt gc-3’
S 5’-aga tcc tca atg tca cgc tgg t-3’
AS 5’-ggc ttc ttg ccc tgg tac aac-3’
S 5’-tgg aga tgc tgg aga tca tcg-3’
AS 5’-gct cat ttc tgg atg tcg ca-3’
S 5’-cgt att gaa act tac tgt tga aga-3’
AS 5’-tgc tac aag gta aaa gct cct aac-3’
S 5’-att gtt cag aga aga aaa cta cgc ctc-3’
AS 5’gtc tgg atg tgt ctc ctt cgc tac-3 S 5’-atg ctg acc tcagag gga ct-3 AS 5’-cac aca cgt tca aag gct ac-3 S 5’-cca cac ata gca ccg gag ata tg-3’
AS 5’-tgc tgc ccc agt atc tgt aac ca-3’
S 5’-ctg gga tcc atg ctc gag agt-3 AS 5’-ctg cat ccc agt tcc ggt tag-3 S 5’-cca gca gag aat gga aag tc-3’
AS 5’-gat gct gct tac atg tct cg-3’
349 116 245 168 345
343 (180 bp)*
260 161 335 327 224 403 213
533 bp (641,775)*
381 252 268
s; sense, as; antisense, *isoforms, β-MG; microglobulin of the oligo (dT)12-18 or random hexamer (Life Tech- nologies, Gaithersburg, MD, USA) for 10 minutes at 70oC, and the total RNA per reaction was reverse- transcribed into the cDNA using Moloney murine leukemia virus reverse transcriptase and 1X buffer (50 mM Tris-HCl, pH 8.3, 75 mM KCl, 3 mM MgCl2, 10 mM DTT) for 1 hour at 42oC. Denaturation was performed for 5 minutes at 95oC, in order to halt the activity of the reverse transcriptase after the reaction. The primer sequences and product sizes are listed in Table 1.
The PCR cycle progressed as follows: (1) 94oC for 30 seconds, (2) 54-64oC for 30 seconds, and (3) 72oC for 1
minute 30 seconds. This protocol was repeated for 30 cycles (β2 microglobulin) or 35 cycles (other genes) and prolonged for 4 minutes at 72oC. The control PCR reaction containing the taq polymerase and primer combination, but with no template, was used as a negative PCR control. The PCR products were then separated on a 1.5% agarose gel, and visualized via ethidium bromide staining.
RESULTS
1. Two-dimensional electrophoresis and image analysis More than 2000 protein spots in both epithelial ovarian
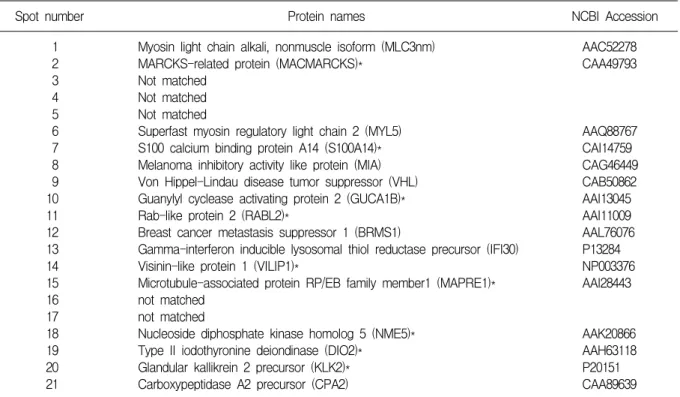
Table 2. Protein spot identification from the proteome of epithelial ovarian cancer
Spot number Protein names NCBI Accession
1 2 3 4 5 6 7 8 9 10 11 12 13 14 15 16 17 18 19 20 21
Myosin light chain alkali, nonmuscle isoform (MLC3nm) MARCKS-related protein (MACMARCKS)*
Not matched Not matched Not matched
Superfast myosin regulatory light chain 2 (MYL5) S100 calcium binding protein A14 (S100A14)*
Melanoma inhibitory activity like protein (MIA) Von Hippel-Lindau disease tumor suppressor (VHL) Guanylyl cyclease activating protein 2 (GUCA1B)*
Rab-like protein 2 (RABL2)*
Breast cancer metastasis suppressor 1 (BRMS1)
Gamma-interferon inducible lysosomal thiol reductase precursor (IFI30) Visinin-like protein 1 (VILIP1)*
Microtubule-associated protein RP/EB family member1 (MAPRE1)*
not matched not matched
Nucleoside diphosphate kinase homolog 5 (NME5)*
Type II iodothyronine deiondinase (DIO2)*
Glandular kallikrein 2 precursor (KLK2)*
Carboxypeptidase A2 precursor (CPA2)
AAC52278 CAA49793
AAQ88767 CAI14759 CAG46449 CAB50862 AAI13045 AAI11009 AAL76076 P13284 NP003376 AAI28443
AAK20866 AAH63118 P20151 CAA89639
*up regulated proteins by RT-PCR
Fig. 1. Comparison of 2-D PAGE proteins separated from epithelial ovarian cancer tissues and normal ovarian tissues. 21 over-expressed protein spots (spot number 1-21) were analyzed by MALDI-TOF MS. The spots corresponded to MLC3nm (1), MACMARCKS (2), MYL2 (6), S100A14 (7), MIA (8), VHL (9), GUCA1B (10), RABL2A (11), BRMS1 (12), IFI30 (13), VILIP1 (14), MAPRE1 (15), NME5 (18), DIO2 (19), KLK 2 (20), and CPA2 (21), but 5 spots (3, 4, 5, 16, 17) could not be matched. MW; molecular weight.
cancers and normal ovaries were identified via 2-D electrophoresis. After filtering and editing the images, 1400
spots were detected in the epithelial ovarian cancer samples, and 1250 spots in the normal ovary, within the size range of 24-116 kDa and a pH range of 4-7. The spots which exhibited unique expression and three-fold or higher increase in normalized volume compared to their coun- terpart images were selected as significant spots. As the result of a comparative analysis of those spots between both groups, about 200 spots were determined to have been up-regulated in the epithelial ovarian cancer tissues.
Among these spots, 21 spots were also identified to have been up-regulated by more than 3 folds in density than normal ovary were selected (Fig. 1). These spots were determined to be acidic proteins which were aligned at the molecular weight level of 24 to 95 kDa over a pH-region of 4.8 to 6.7. This expression pattern was reproducible in each cancer sample.
2. Identification of proteins by MALDI-TOF
Among 21 up-regulated proteins in the epithelial ovarian cancer samples, 16 were matched to the nonmuscle isoform
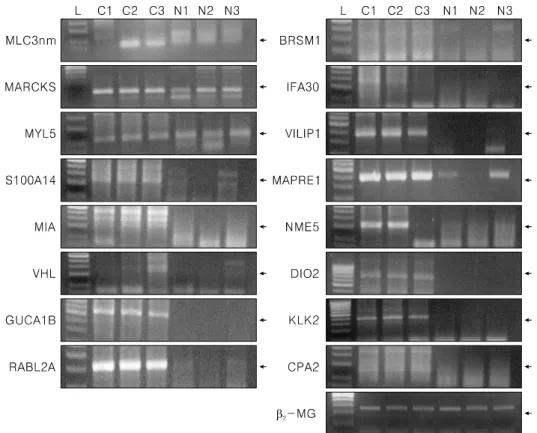
Fig. 2. RT-PCR revealed that the expression of MLC3nm, MACMARCKS, MYL2, S100A14, MIA, VHL, GUCA1B, RABL2A, BRMS1, IFI30, VILIP1, MAPRE1, NME5, DIO2, KLK 2, and CPA2 was observed mostly in epithelial ovarian cancer tissues, but MACMARKS, GYCA1B, RABL2A, VILIP1, MAPRE1, NME5, and DIO2 were markedly up-regulated in epithelial ovarian cancer tissues compared with three normal ovarian tissues. β2-microglobulin was evenly expressed in both groups. L; ladder (100 bp), epithelial ovarian cancer (C1-C3), normal ovarian tissue (N1-N3).
of myosin light chain alkali (MLC3nm), MARCKS-related protein (MACMARCKS), superfast muosin regulatory light chain 2 (MYL5), S100 calcium binding protein A14 (S100A14), melanoma inhibitory activity like protein (MIA), Von Hippel-Lindau disease tumor suppressor (VHL), guanylyl cyclease activating protein 2 (GUCA1B), Rab-like protein 2 (RABL2A), breast cancer metastasis suppressor 1 (BRMS1), gamma-interferon inducible lyso- somal thiol reductase precursor (IFI30), visinin-like protein 1 (VILIP1), microtubule-associated protein RP/EB family member1 (MAPRE1), nucleoside diphosphate kinase homolog 5 (NME5), type II iodothyronine deiondinase (DIO2), glandular kallikrein 2 precursor (KLK2), and carboxypeptidase A2 precursor (CPA2) (Fig. 1, Table 2).
Five of these could not be matched, even after the PCR amplification of possible genes (data not shown).
2. Identification of expression at mRNA levels by RT-PCR
RT-PCR was performed for MLC3nm, MACMARCKS, MYL2, S100A14, MIA, VHL, GUCA1B, RABL2A, BRMS1, IFI30, VILIP1, MAPRE1, NME5, DIO2, KLK 2, and CPA2 on both epithelial ovarian cancer tissues and normal ovarian tissues. However, the levels of expression of MACMARKS, GUCA1B, RABL2A, VILIP1, MAPRE1, NME5, DIO2, and KLK2 were much higher in the epithelial ovarian cancer tissues than in the normal ovarian tissues, and the expression levels of the remainder were found to be slightly higher in the epithelial ovarian cancer tissues (Fig. 2). (2-microglobulin was evenly expressed between both groups.
3. Identification of serum marker proteins by proteomics Proteomic analysis of serum before surgery in epithelial
ovarian cancer patients and the serum of normal women revealed no differences in protein spots (data not shown).
Serum proteomic analysis also yielded no specific findings, due to the paucity of proteins in the serum.
DISCUSSION
In the present study, we identified 16 candidate proteins (MLC3nm, MACMARCKS, MYL2, S100A14, MIA, VHL, GUCA1B, RABL2A, BRMS1, IFI30, VILIP1, MAPRE1, NME5, DIO2, KLK 2, and CPA2) which were determined by proteomic analysis to be related to the pathogenesis of epithelial ovarian cancer. Among these 16 proteins, RT-PCR revealed that MACMARCKS, S100A14.
GUCA1B, RABL2A, VILIP1, MAPRE1, NME5, DIO2, and KLK2 were distinctly up-regulated in epithelial ovarian cancer tissuesin comparison with normal ovarian tissues.
MACMARCKS (MLP) is a MARCKS-related protein.
MARCKS is a widely expressed and prominent substrate for protein kinase C, and it may act as a regulator of cell proliferation by virtue of its cross-linking properties with calmudulin, actin, and synapsin.12 The over-expression of MARCKS in mutant pancreatic cell lines was identified by differential display.13 MAC-MARCKS, which is expressed at high levels in the testis and uterus, may perform functions similar to that of MARCKS, since it shares a great deal of homology with MARCKS.14
The S100 family, comprised of at least 21 genes, has been implicated in the regulation of a variety of intra- and extracelluar activities. Its deregulated expression has been observed in human diseases, including cancers. Expression of the S100 protein was observed by immunohistoche- mistry in most serous epithelial ovarian cancer tissues, and recent microarray of ovarian carcinoma cells revealed that S100A1 could be one of its biomarkers.15,16 S100A14 is also a member of a subfamily of proteins, all of which are related by Ca++-binding motifs to the EF-hand Ca++- binding protein superfamily. Although S100A2 was deter- mined to be down-regulated in esophageal cancer, with a
possible role as a tumor suppressor gene, S100A14 was also found to be overexpressed in ovary, breast, and uterine tumors, and underexpressed in kidney, rectum, and colon tumors. Its functional identification may be related to distinct regulation, with potentially important functions in malignant transformation.17,18 Recently, a proteomic ana- lysis of ovarian cancer samples revealed that S100A4 was present, and its role appeared to be somewhat correlated with the invasion and metastasis of ovarian cancer.10 In the present study, S100A14 can be used as a biomarker in epithelial ovarian cancer, and additional studies are necessary for the assessment of its role in epithelial ovarian cancer.
Guanylate cyclase activating proteins are related to the Ca(2+)-binding proteins which activate photoreceptor guanylate cyclase, and its mutation is associated with retinal dystrophy.19 Although the role of GUCA1B in epithelial ovarian cancer remains unclear, it may be related to the production of serous components, as GUCA1B is an endogenous ligand of the intestinal receptor guanylate cyclase-C (GC-C), and stimulates an increase in cyclic GMP, inducing chloride secretion via the cystic fibrosis transmembrane conductance regulator.20
Rab proteins are small GTPases of the Ras superfamily, which are involved in the regulation of intracellular membrane trafficking. They regulate transport vesicles between subcellular compartments, or to and from the plasma membrane, via the cycling of GDP/GTP exchange.
Rab-like protein consists of RABL2A and RABL2B, and is are ubiquitously expressed as a 2.5 transcript in adult and fetal tissues, with high levels of expression in the adult heart, brain, kidney, and pancreas than in the placenta, lung, liver, and skeletal muscle.21 A number of cancers (prostate, liver, breast) as well as vascular, lung, and thyroid diseases have been associated with select over- expressed rab GTPases, and the therapeutic down- regulation of rab protein expression has been suggested in the treatment of some cancer or thyroid adenomas.22 VILIP1 (VSNL1), a calcium-binding protein, is expre- ssed in the central nervous system. It plays a crucial role
in the regulation of cAMP cell signaling. Mouse skin tumor cell lines were also found to express high levels of VILIP1 in less-aggressive SCC and papilloma cell lines, and disappeared in high-grade SCC.23 This suggests that VILIP1 plays an important role in the regulation of tumor invasiveness. Its role in ovarian cancer, however, remains unclear.
The MAPRE genes encode for the EB1 family protein.
Yeast EB1 protein had been demonstrated to play important roles in microtubule dynamic regulation, cytokinesis, mitotic spindle positioning, and episome segregation. Mammalian EB1 may play a physiological role, which connects the APC (adenomatous polyposis coli) tumor suppressor gene to cellular division, coordinating the control of normal growth and differentiation processes in the colonic epithelium.24 Three MAPRE genes (MAPRE1, MAPRE2, and MAPRE3) were also identified, but their role in ovarian cancer remain unclear.
The nucleoside diphosphate (NDP) kinases are ubi- quitous enzymes, which catalyze the transfer of gamma- phosphates, via a phosphohistidine intermediate, between nucleoside and dioxynucleoside tri- and diphosphates.
These enzymes are products of the NM23 gene family. As members of the human NDP kinase family, NME5 is expressed at high level in the in testes, and has also been characterized from pregnant uterine tissue, as well as from tumors of the ovary and parathyroid.25 It is not present in mature ovaries. This strongly suggests that NME5 may be used as a biomarker for cancers.
DIO2 is responsible for this 'local' production of T3, and its expression in the placenta and several fetal tissues during the early development of rats suggests that it may play a role in the prevention of premature exposure of developing tissues to adult levels of thyroid hormones.26 Its transcripts have also been detected in the human brain, heart, kidney, lung, and trachea.27 Its role in epithelial ovarian cancer, however, remains unclear.
The human kallikrein gene family currently consists of at least 15 members (KLK1-15). Glandular kallikreins are secreted serine proteases and consist of 3 genes (KLK1-3).
Prostate-specific antigen (KLK3) is the most reliable cancer biomarker identified to date, as it is characterized by its small molecular weight, secretion into various biological fluids, presence in serum, and high specificity for some tissues.28 KLK2 is also a distinct group of serine proteases with molecular masses of 25,000 to 40,000, and the ability to release vasoactive peptides from kininogen in vitro, although the kininogenase activity of different kallikreins is highly variable. KLK2 is considered to be a biomarker for prostate and breast cancer.29 Three kalli- kreins (KLK4, KLK5, and KLK15) in ovarian cancer constitute markers for poor prognosis, two (KLK6 and KLK7) are overexpressed in ovarian cancers, and three (KLK8, KLK9, KLK14) are markers for favorable prognoses.29 In the present study, the KLK2 precursor was identified, and the matched peptides by MALDI-TOF covered only 14% of the protein. Therefore, this KLK2 precursor may be a kallikrein, as the kallikrein family shares significant homology with regard to peptide sequences.
This proteomic analysis may constitute a powerful tool for the identification and characterization of many promising candidate proteins, which are related to epithelial ovarian cancers. However, its utility as a serum marker require further study, including protein chips or ELISA, as proteomic analysis generates protein data in cancer tissue, and is not used in the acquisition of serum data.
REFERENCES
1. Puls LE, Duniho T, Hunter JE, Kryscio R, Blackhurst D, Gallion H. The prognostic implication of ascites in advanced-stage ovarian cancer. Gynecol Oncol 1996; 61:
109-12.
2. Engel J, Eckel R, Schubert-Fritschle G, Kerr J, Kuhn W, Diebold J, et al. Moderate progress for ovarian cancer in the last 20 years: Prolongation of survival, but no improvement in the cure rate. Eur J Cancer 2002; 38:
2435-45.
3. Bast RC Jr, Klug TL, St. John E, Jenison E, Niloff JM, Lazarus H, et al. A radioimmunoassay using a mono- clonal antibody to monitor the course of epithelial
ovarian cancer. N Engl J Med 1983; 309: 883-7.
4. Maggino T, Gadducci A. Serum markers as prognostic factors in epithelial ovarian cancer: an overview. Eur J Gynaecol Oncol 2000; 21: 64-9.
5. Verheijen RH, von Mensdorff-Pouilly S, van Kamp GJ, Kenemans P. CA 125: fundamental and clinical aspects.
Semin Cancer Biol 1999; 9: 117-24.
6. Bast RC, Xu FJ, Woolas RP, Yu Y, Conway M, O'Briant K, et al. Complementary and coordinate markers for detection of epithelial ovarian cancers. In: Sharp F, editor. Ovarian cancer 3. London: Chapman and Hall 1995: 189-92.
7. Kacinski BM, Stanley ER, Carter D, Chambers JT, Chambers SK, Kohorn EI, et al. Circulating levels of CSF-1 (M-CSF) a lymphohematopoietic cytokine may be a useful marker of disease status in patients with malignant ovarian neoplasms. Int J Radiat Oncol Biol Phys 1929; 17: 159-69.
8. Wenham RM, Lancaster JM, Berchuck A. Molecular aspects of ovarian cancer. Best Pract Res Clin Obstet Gynaecol 2002; 16: 483-97.
9. Jones MB, Krutzsch H, Shu H, Zhao Y, Liotta LA, Kohn EC, et al. Proteomic analysis and identification of new biomarkers and therapeutic targets for invasive ovarian cancer. Proteomics 2002; 2: 76-84.
10. Bandera CA, Ye B, Mok SC. New technologies for the identification of markers for early detection of ovarian cancer. Curr Opin Obstet Gynecol 2003; 15: 51-5.
11. Hochstrasser DF, Patchornik A, Merril CR. Development of polyacrylamide gels that improve the separation of proteins and their detection by silver staining. Anal Biochem 1988; 173: 412-23.
12. Zhao Y, Neltner BS, Davis HW. Role of MARCKS in regulating endothelial cell proliferation. Am J Physiol Cell Physiol 2000; 279: C1611-20.
13. Gardner-Thorpe J, Ito H, Ashley SW, Whang EE.
Differential display of expressed genes in pancreatic cancer cells. Biochem Biophys Res Commun 2002; 293:
391-5.
14. Lobach DF, Rochelle JM, Watson ML, Seldin MF, Blackshear PJ. Nucleotide sequence, expression, and chromosomal mapping of Mrp and mapping of five related sequences. Genomics 1993; 17: 194-204.
15. Lin M, Hanai J, Wada A, Ozaki M, Nasu K, Okamoto S, et al. S-100 protein in ovarian tumors. A comparative immunohistochemical study of 135 cases. Acta Pathol Jpn 1991; 41: 233-9.
16. Hibbs K, Skubitz KM, Pambuccian SE, Casey RC, Burleson KM, Oegema TR Jr, et al. Differential gene expression in ovarian carcinoma: identification of potential biomarkers. Am J Pathol 2004; 165: 397-414.
17. Ji J, Zhao L, Wang X, Zhou C, Ding F, Su L, et al.
Differential expression of S100 gene family in human
esophageal squamous cell carcinoma. J Cancer Res Clin Oncol 2004; 130: 480-6.
18. Pietas A, Schluns K, Marenholz I, Schafer BW, Heizmann CW, Petersen I. Molecular cloning and characterization of the human S100A14 gene encoding a novel member of the S100 family. Genomics 2002; 79:
513-22.
19. Payne AM, Downes SM, Bessant DA, Plant C, Moore T, Bird AC, et al. Genetic analysis of the guanylate cyclase activator 1B (GUCA1B) gene in patients with autosomal dominant retinal dystrophies. J Med Genet 1999; 36: 691-3.
20. Whitaker TL, Steinbrecher KA, Copeland NG, Gilbert DJ, Jenkins NA, et al. The uroguanylin gene (Guca1b) is linked to guanylin (Guca2) on mouse chromosome 4.
Genomics 1997; 45: 348-54.
21. Wong ACC, Shkolny D, Dorman A, Willingham D, Roe BA, McDermid HE. Two novel human RAB genes with near identical sequence each map to a telomere- associated region: the subtelomeric region of 22q13.3 and the ancestral telomere band 2q13. Genomics 1999; 59:
326-34.
22. Stein MP, Dong J, Wandinger-Ness A. Rab proteins and endocytic trafficking: potential targets for therapeutic intervention. Adv Drug Deliv Rev 2003; 55: 1421-37.
23. Mahloogi H, Gonzalez-Guerrico AM, Lopez De Cicco R, Bassi DE, Goodrow T, Braunewell KH, et al. Overex- pression of the calcium sensor visinin-like protein-1 leads to a cAMP-mediated decrease of in vivo and in vitro growth and invasiveness of squamous cell carcinoma cells. Cancer Res 2003; 63: 4997-5004.
24. Su LK, Qi Y. Characterization of human MAPRE genes and their proteins. Genomics 2001; 71: 142-9.
25. Munier A, Feral C, Milon L, Pinon VP, Gyapay G, Capeau J, et al. A new human nm23 homologue (nm23-H5) specifically expressed in testis germinal cells.
FEBS Lett 1998; 434: 289-94.
26. Croteau W, Davey JC, Galton VA, St Germain DL.
Cloning of the mammalian type II iodothyronine deiodinase. A selenoprotein differentially expressed and regulated in human and rat brain and other tissues. J Clin Invest 1996; 98: 405-17.
27. Ohba K, Yoshioka T, Muraki T. Identification of two novel splicing variants of human type II iodothyronine deiodinase mRNA. Mol Cell Endocrinol 2001; 172:
169-75.
28. Jacobs IJ, Menon U. Progress and challenges in screening for early detection of ovarian cancer. Mol Cell Proteo- mics 2004; 3: 355-66.
29. Diamandis EP, Yousef GM. Human tissue kallikreins: a family of new cancer biomarkers. Clin Chem 2002; 48:
1198-205.
상피성 난소암에서 프로테옴 기법을 이용한 단백발현 분석
고려대학교 의과대학 산부인과학교실1, 고려대학교 의과대학 두경부외과학교실2
박선영1ㆍ송재윤1ㆍ이재관1ㆍ이낙우1ㆍ정학현2ㆍ이규완1
목적:이 연구의 목적은 상피성 난소암 조직과 정상 난소조직의 단백발현양상을 프로테옴기법을 이용하여 비교 분석하 기 위함이다.
연구 방법:상피성 난소암 조직과 정상 난소조직 각각 3개를 수술을 통하여 채취하였다. 분자량에 따른 조직 단백을 분리하기 위하여 이차원적 전기영동(two-dimensional polyarcrylamide gel electrophoresis, 2D PAGE)을 시행하였고 두 군간의 단백 발현 차이를 비교하였다. 21개의 상향 발현된 spot들이 matrix-assisted laser desorption/ionization time of flight (MALDI-TOF) mass spectrometry (MS)에 의해 발견 되었다. 그리고 상향 발현된 단백들은 상피성 난소암 조직과 정상 조직에 서 RT-PCR을 통해 mRNA 단계에서 측정되었다.
결과:프로테옴기법을 통해 난소암 조직에서 상향 발현된 약 200여 개의 단백 중에서 21개가 선택되어 MALDI-TOF를 통해 확인 되었다. 그 중 16개는 MLC3nm, MACMARCKS, MYL2, S100A14, MIA, VHL, GUCA1B, RABL2A, BRMS1, IFI30, VILIP1, MAPRE1, NME5, DIO2, KLK 2, 그리고 CPA2로 판명되었다. 상향 발현된 단백들은 mRNA단계에서 RT-PCR로 측정하여 MACMARCKS, S100A14, GUCA1B, RABL2A, VILIP1, MAPRE1, NME5, DIO2, 그리고 KLK2이 상피성 난소암에 서 상향발현되는 것을 확인하였다. 반면 5개의 단백은 결과가 일치하지 않았다.
결론:이러한 프로테옴 기법은 상피성 난소암과 관련된 많은 단백을 찾아내고 특성화 하는데 유용한 방법으로 이용될 것이다.
중심단어:난소암, 프로테인 발현, 종양표지자