http://dx.doi.org/10.3988/jcn.2014.10.4.348 J Clin Neurol 2014;10(4):348-353
Correlation between Ultrasonography Findings and Electrodiagnostic Severity in Carpal Tunnel Syndrome:
3D Ultrasonography
Hee Kyu Kwon,a Hyo Jung Kang,b Chan Woo Byun,b Joon Shik Yoon,b Chang Ho Kang,c Sung Bum Pyuna
aDepartments of Physical Medicine & Rehabilitation and cRadiology, Korea University Anam Hospital, Korea University College of Medicine, Seoul, Korea
bDepartment of Physical Medicine & Rehabilitation, Korea University Guro Hospital, Korea University College of Medicine, Seoul, Korea
Received December 19, 2013 Revised July 20, 2014 Accepted July 21, 2014 Correspondence Joon Shik Yoon, MD, PhD Department of Physical Medicine &
Rehabilitation, Korea University Guro Hospital, Korea University College of Medicine,
148 Gurodong-ro, Guro-gu, Seoul 152-703, Korea Tel +82-2-2626-1500 Fax +82-2-859-5422 E-mail [email protected]
Background and PurposezzTo determine the correlation between the cross-sectional area (CSA) of the median nerve measured at the wrist using three-dimensional (3D) ultrasonogra- phy (US) and the electrophysiological severity of carpal tunnel syndrome (CTS).
MethodszzWe prospectively examined 102 wrists of 51 patients with clinical CTS, which were classified into 3 groups according to the electrodiagnostic (EDX) findings. Median nerve CSAs were measured using 3D US at the carpal tunnel inlet and at the level of maximal swelling.
ResultszzTen wrists were negative for CTS. Of the 92 CTS-positive wrists, 23, 30, and 39 were classified as having mild, moderate, and severe CTS, respectively. The median nerve CSA differed significantly between the severe- and moderate-CTS groups (p=0.0007 at the carpal tunnel inlet and p<0.0001 at the maximal swelling site). There was a correlation between medi- an nerve CSA and EDX parameters among those wrists with severe and mild CTS (p<0.0001 at both sites).
ConclusionszzThe median nerve CSA as measured by 3D US could provide additional infor- mation about the severity of CTS, as indicated by the strong correlation with standard EDX
findings. J Clin Neurol 2014;10(4):348-353
Key Wordszz three-dimensional ultrasonography, carpal tunnel syndrome, cross-sectional area, electrophysiological severity, median nerve.
Open Access
cc This is an Open Access article distributed under the terms of the Cre- ative Commons Attribution Non-Commercial License (http://creative- commons.org/licenses/by-nc/3.0) which permits unrestricted non-com- mercial use, distribution, and reproduction in any medium, provided the ori- ginal work is properly cited.
Introduction
Carpal tunnel syndrome (CTS) is the most common entrap- ment neuropathy of the peripheral nerves,1 and is routinely di- agnosed based on the clinical history, a physical examination, and electromyography.2,3 Ultrasonography (US) is currently emerging as a tool for diagnosing entrapment neuropathy of the upper extremities4,5 it is noninvasive, painless, readily avail- able, and poses no radiation hazard. Several studies have inves- tigated the usefulness of US in the diagnosis of CTS,3,6-11 most
of which have produced a key finding of focal swelling of the median nerve at the carpal tunnel.10 Given the recent advances in the field of US, this tool has the potential to provide useful information regarding the detection and grading of CTS.
Advances in US imaging have resulted in the development of three-dimensional (3D) US, which has been particularly use- ful in the field of obstetrics.12 A probe has been developed for use with 3D US for the evaluation of peripheral nerves.13 One study that explored the assessment of CTS using 3D US and compared the cross-sectional area (CSA) of the median nerve between controls and patients with CTS13 found the mean me- dian nerve CSA was significantly greater in the patient group than in the control group. However, few studies have evaluat- ed whether the median nerve CSA measured using 3D US is significantly correlated with the severity of CTS. If nerve swell-
ing measured by US can be correlated with the electrophysi- ological severity of this disorder, this could be used in the de- velopment of a useful tool for screening CTS and for assessing the prognosis.
The aim of this study was to determine whether there is a correlation between the maximal CSA of the median nerve at the wrist measured using 3D US and the electrophysiological severity of CTS.
Methods
Study population
Fifty-one consecutive patients (102 wrists) who were referred to our department from orthopedic and plastic surgery clinics between May 2008 and February 2009 with a clinical diagno- sis of bilateral CTS were enrolled as subjects in this study. The clinical inclusion criteria were presence of 1) paresthesia or numbness in the area innervated by the median nerve, and 2) a sensory deficit in the same area, or 3) muscle weakness or at- rophy of the abductor pollicis brevis (Quality Standards Sub- committee of the American Academy of Neurology, 1993).
The exclusion criteria were 1) a history of underlying diseases such as generalized inflammatory polyneuropathy, gout, rheu- matoid arthritis, and metabolic disorders, 2) pregnancy, 3) pre- vious surgery for a fracture or laceration at the wrist, or 4) oth- er lesions within the carpal tunnel. Review board approval was obtained for this study, and informed consent to participate was provided by all of the subjects.
Nerve conduction study
A nerve conduction study (NCS) was conducted using a Dan- tec Counterpoint MK2 device (Medtronic, Minneapolis, MN, USA). All studies were conducted at standard room tempera- ture (25°C). The skin temperature of the hand was maintained at 32°C or above. The median compound muscle action poten- tials (CMAPs) were recorded over the abductor pollicis brevis muscle via median nerve stimulation applied 8 cm proximal to the active recording electrode. The onset latency and baseline- to-peak amplitude of the CMAPs were measured. The median sensory nerve action potentials (SNAPs) were recorded anti- dromically with a bar electrode over the third digit, and stimu- lated at two points located 7 and 14 cm proximal to the active recording electrode. To test the transcarpal segment, the nerve was also stimulated at two points: at the distal wrist crease (DWC) and 5 cm distal to the DWC at the palm. The latencies and baseline-to-peak amplitudes of the median SNAPs were measured and the onset latency difference between the two points was calculated. Needle electromyography was per- formed to exclude cervical radiculopathy.
Carpal tunnel syndrome was diagnosed based on the follow-
ing criteria: 1) median SNAP peak latency of >3.7 ms, 2) SNAP peak latency longer in the proximal 7-cm segment than in the distal 7-cm segment, 3) SNAP amplitude <20 μV and conduction block with a SNAP amplitude decrease of >50%
with wrist stimulation compared to palm stimulation, 4) 5-cm transcarpal conduction time of >1.3 ms, 5) median CMAP dis- tal latency of >4.2 ms, and 6) CMAP amplitude of <4.5 mV.
CTS in those wrists that tested positive for the disorder (n=92) was graded as mild, moderate, or severe based on a modifica- tion of the criteria given by Stevens (1997) as follows:
1) Mild CTS–prolonged (relative or absolute) sensory or mixed nerve action potential (NAP) distal latency (orthodrom- ic, antidromic, or palmar) with or without SNAP amplitude be- low the lower normal limit.
2) Moderate CTS–abnormal median sensory latencies as above, and (relative or absolute) prolongation of the median motor CMAP distal latency.
3) Severe CTS–prolonged median CMAP and SNAP distal latencies, with either an absent SNAP or mixed NAP, or a low- amplitude or absent thenar CMAP. Needle examination often reveals fibrillations, reduced recruitment, and changes in the motor unit potential.
3D US
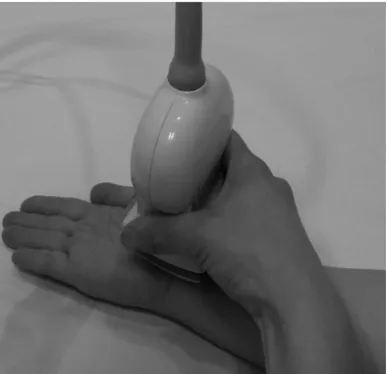
Examinations were conducted using 3D US with a dedicated 8- to 15-MHz mechanical 3D-volume transducer (Logiq 9, GE Medical Systems, Milwaukee, WI, USA). US examinations were conducted on the same day as the electromyography. All patients were evaluated in a supine position with the palm up and the fingers semiextended. A 3D volume transducer was placed at the DWC, which enabled sufficient demonstration of long-axis images of the median nerve in the proximal carpal tunnel (Fig. 1).
A musculoskeletal radiologist (C.H.K.) with 10 years of US experience on a 3D workstation (Centricity Radiology RA 600 version 7.0, GE Medical Systems, Milwaukee, WI, USA) and who was blinded to the NCS findings reviewed the 3D scans using the same analysis methods as employed in our previous study.13 The morphology of the median nerve from the distal radius to the proximal carpal tunnel was assessed in three or- thogonal planes that could be displayed along with graphic lines and dots to clearly demonstrate how each section pro- jection cuts the volume (Fig. 2). The changes in the shape of the median nerve were evaluated qualitatively, and whether or not the points of maximum nerve swelling could be visual- ized using this process was established. The median nerve CSA was then measured, and morphological evaluation was performed using the 3D volume data. Using an indirect tech- nique, the median nerve CSA was measured at the carpal tun- nel inlet (scaphoid-pisiform level) and at the point of maxi-
mum swelling in cases for which it could be demonstrated (Fig. 2). The formula of an ellipsoid area (D1×D2×3.14/4) was used in this measurement. The measurements were re- peated three times, and the average was used for statistical analysis.
Statistical analysis
The maximal CSA of the median nerve around the wrist was selected, and the Pearson coefficient for the correlation be- tween the maximal median nerve CSA and the electrophysio- logical severity of the CTS was measured. All continuous
variables were normally distributed, as established by the Kol- mogorov-Smirnov test, and were adjusted for age and sex.
They were also adjusted for using both hands of one patient in testing. Statistical analysis was conducted using repetitive ANOVA to test the differences between the means of the groups. The cutoff for statistical significance was set at p<0.05, and the rho score was also recorded. Statistical analyses were conducted using SPSS (version 15.0, SPSS Inc., Chicago, IL, USA).
Results
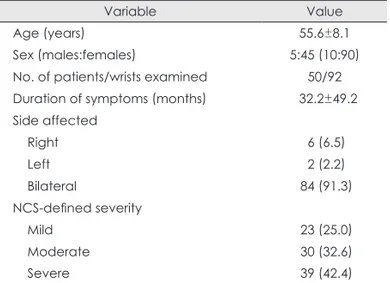
In total, 102 wrists of 51 patients were assessed, of which 92 wrists were confirmed electrophysiologically as being affected by CTS; the remaining 10 wrists were negative for CTS. Both wrists of each patients were examined. Ultimately, 92 affected wrists in 50 patients (5 males and 45 females) were included in the study. The age of the patients was 55.6±8.1 years (mean±
SD; range, 31–73 years). Bilateral CTS was present in 42 of the patients (Table 1).
Of the 92 affected wrists, 23, 30, and 39 were classified electrophysiologically with mild, moderate, and severe CTS.
The overall median nerve CSA at the tunnel inlet was 13.2±6.2 mm2 in the 92 wrists: the values were 10.5±4.6, 11.6±2.6, and 17.1±7.5 mm2 in mild, moderate, and severe CTS, respective- ly; these values differed significantly between severe and moderate CTS (p=0.0007) and between severe and mild CTS (p<0.0001) (Fig. 3). The overall median nerve CSA at the lev- el of maximal swelling was 14.9±6.6 mm2 in all 92 wrists; the values were 11.7±4.7, 13.0±3.4, and 19.7±7.2 mm2 in mild, Fig. 1. 3D ultrasonography of the median nerve in the carpal tunnel.
Fig. 2. Multiplanar display of a 3D ultraso- nography volume showing the median nerve (dots) in three orthogonal orienta- tions. The planes are interactive and permit a complete tracing of the median nerve from the distal radius to the proxi- mal carpal tunnel.
moderate, and severe CTS, respectively; these values also dif- fered significantly between severe and moderate CTS (p<
0.0001) and between severe and mild CTS (p<0.0001) (Fig. 3).
The following variables were correlated with the median nerve CSA at the carpal tunnel inlet: distal CMAP latency (r=0.411, p<0.01), CMAP amplitude (r=-0.323, p<0.01), dis- tal SNAP latency (r=0.343, p<0.01), and SNAP amplitude (r=
-0.335, p<0.01). The following variables were correlated with the median nerve CSA at the level of maximal swelling: distal CMAP latency (r=0.469, p<0.01), CMAP amplitude (r=-0.359, p<0.01), distal SNAP latency (r=0.272, p<0.05), and SNAP amplitude (r=-0.265, p<0.05) (Table 2).
Discussion
In our previous study we applied the 3D US approach to me- dian nerve CSA measurements and demonstrated a significant difference between controls and patients with CTS.13 In the present study we compared the median nerve CSA as mea- sured by 3D US in patients who had been classified as having mild, moderate, or severe CTS based on electrophysiological measurements. A significant difference in the CSA was found at both measured sites of the median nerve between the se- vere-CTS group and other two groups, but not between the mild- and moderate-CTS groups (Fig. 3).
Several previous studies used two-dimensional (2D) US to examine the relationship between the median nerve CSA and CTS severity. Bayrak et al.14 showed that the median nerve CSA at the wrist increased as the number of motor units of the abductor pollicis brevis muscles decreased. Padua et al.10 Table 1. Baseline characteristics of the patients
Variable Value
Age (years) 55.6±8.1
Sex (males:females) 5:45 (10:90)
No. of patients/wrists examined 50/92 Duration of symptoms (months) 32.2±49.2 Side affected
Right 6 (6.5)
Left 2 (2.2)
Bilateral 84 (91.3)
NCS-defined severity
Mild 23 (25.0)
Moderate 30 (32.6)
Severe 39 (42.4)
Except where indicated otherwise, the data are presented as mean±SD or n (%) values.
Table 2. Coefficients for the correlations between the median nerve CSA and EDX parameters
CMAP latency CMAP amplitude SNAP latency SNAP amplitude
CSA at the carpal tunnel inlet 0.411† -0.323† 0.343† -0.335†
CSA at the maximum swelling point 0.469† -0.359† 0.272* -0.265*
*p<0.05, †p<0.01.
CMAP: compound muscle action potential, CSA: cross-sectional area, EDX: electrodiagnostic, SNAP: sensory nerve action potential.
Fig. 3. Box plot showing the median nerve CSAs measured using 3D ultrasonography at the carpal tunnel inlet (left) and the maximal swell- ing point (right) in patients with CTS who were stratified according to the severity of their condition based on EDX (NCS). A gradual increase in CSA was observed with worsening CTS severity, with significant differences being apparent at both nerve sites between the severe- and mild-CTS groups (*p<0.0001 at the carpal tunnel inlet; †p<0.0001 at the maximum swelling point) and between the severe- and moderate-CTS groups (‡p=0.0007 at the carpal tunnel inlet; §p<0.0001 at the maximum swelling point). Bold black lines indicate medians and whiskers indi- cate error bars; ○, outliers; ■, mean values (10.5±4.6, 11.6±2.6, and 17.1±7.5 mm2 in the mild-, moderate-, and severe-CTS groups, respec- tively, at the carpal tunnel inlet; and 11.7±4.7, 13.0±3.4, and 19.7±7.2 mm2, respectively, at the maximum swelling point). CSAs: cross-sec- tional areas, CTS: carpal tunnel syndrome, EDX: electrodiagnostic, NCS: nerve conduction study.
Mild Mild
Severity of CTS on NCS Severity of CTS on NCS
Severe Severe
‡p=0.0007 §p<0.0001
*p<0.0001 †p<0.0001
Moderate Moderate
40
30
20
10
0
40
30
20
10
0
CSA (mm2) at carpal tunnel inlet CSA (mm2) at maximum swelling point
and Karadağ et al.15 also found that in CTS patients, median nerve CSA was positively correlated with the electrophysio- logical severity of their condition.
Recent technical developments have resulted in 3D US emerging as a new imaging tool. Conventional 2D US requires the operator to reconstruct a series of axial images, which is time-consuming; in contrast, since 3D US requires the acquisi- tion of only a single volume, the examination is both less oper- ator-dependent and less time-consuming (potentially less than 1 min).13 Given these advantages, the use of 3D US has be- come more widespread in the fields of obstetrics, cardiology, and vascular medicine. It provides a highly detailed and re- peatable method for evaluating anatomical structures and dis- ease entities.
Recently there has been a rapid increase in interest in the use of 3D US to examine nerves. With 2D US, only longitudinal and axial views can be obtained by rotating the transducer through 90º. In contrast, 3D US makes it possible to also ac- quire a coronal view.16 Choquet and Capdevila17 reported a case in which the catheter tip used for perineural block was incor- rectly placed in the extraneural space when using 2D US; after withdrawing the catheter tip and confirming the target position using 3D US, it was successfully placed in the perineural space.
It is thus clear that 3D US can provide improved imaging of structures and their surrounding tissues.
Furthermore, Girtler et al.18 showed that 3D US of the up- per-extremity nerves was feasible for both qualitative evalu- ations (in terms of image quality, atypical nerve location, and findings potentially associated with compression neuropathy) and quantitative (CSA measurements) evaluations of the me- dian, ulnar, and radial nerves in healthy volunteers. There were no differences in the median nerve CSA measurements made by two different operators, and there was a difference of only 2 mm2 in those made at each level along the nerve.18 Karmakar et al.16 also reported that the sciatic nerve could be imaged using 3D US. These results suggest that 3D US pro- vides more detailed anatomical information about the sur- rounding structures than 2D US. In addition, the perineural space of the sciatic nerve can be identified distinctly, which may be helpful for targeting nerve blocks.16 There have been additional reports describing the use of 3D US for imaging the upper-extremity nerves. Clendenen et al.19 reported that 3D US could be used to image the infraclavicular brachial plexus, thus enabling targeting of the placement of an infra- clavicular blockade. However, despite these reports of the use of 3D US to image nerves, this approach has not been widely adopted for assessing the median nerve in CTS. Given that CTS is the most common compressive neuropathy of the up- per limb, 3D US is a potentially valuable approach.
Our findings using 3D US regarding the relationship be-
tween median nerve CSA and the neurophysiological severity of CTS were highly consistent with the previously reported findings obtained using 2D US. There was a gradual increase in CSA with increasing CTS severity on NCSs (Fig. 3). In gen- eral, CTS is correlated with axonal loss and increased water content following nerve swelling. Therefore, there may be a positive correlation between median nerve CSA and electro- physiological severity.10 Table 2 lists the correlations between electrodiagnostic (EDX) parameters and the median nerve CSAs at the inlet of the carpal tunnel and at the level of maxi- mal swelling. Moran et al.20 found significant correlations between the median nerve CSA and the proportion of nonre- sponses in the NCS (r=0.61). Moreover, Lee et al.21 showed that US findings regarding the median nerve CSA at the carpal tunnel inlet were strongly correlated with the NCS findings in various forms of CTS. Specifically, they showed that proximal swelling of the median nerve was primarily correlated with the NCS data, positively correlated with sensory latency (r=0.47), and negatively correlated with SNAP amplitude (r=-0.50), CMAP amplitude (r=-0.46), motor nerve conduction velocity (r=-0.44), and sensory nerve conduction velocity (r=-0.60).
Similar statistically significant correlations were observed in the present 3D US study (Table 2).
The present findings also show that 3D US could be used to accurately differentiate between the median nerve CSAs of pa- tients with severe CTS and those with mild or moderate CTS, but not between the mild- and moderate-CTS groups (Fig. 3).
Mondelli et al.22 demonstrated that there were no anomalies in 23.5% of mild cases using US. Furthermore, Moghtaderi et al.23 suggested that 2D US can provide good sensitivity and specificity in patients with at least a moderate degree of CTS, and Ooi et al.24 also reported that 2D US may have di- agnostic potential for CTS cases with a median nerve CSA of >12.8 mm2, corresponding to at least a moderate degree of CTS. These previous reports could explain the present find- ing of a significant difference only between the severe-CTS group and the other two groups.
Certain limitations should be considered when interpreting the results of this study. First, a control group was not includ- ed; however, in a previous study we confirmed that there was a significant difference between control and CTS groups. In the present study we focused on the reliability of using 3D US to differentiate between CTS of various severities based on EDX. A second limitation is that there was no comparison of the diagnostic accuracy between 2D US and 3D US examina- tions. This issue should be addressed in future studies.
In conclusion, 3D US exhibited significant reliability for de- tecting CTS severity and could provide additional diagnostic value for this common peripheral nerve entrapment neuropathy.
Conflicts of Interest
The authors have no financial conflicts of interest.
REFERENCES
1. Atroshi I, Gummesson C, Johnsson R, Ornstein E, Ranstam J, Rosén I.
Prevalence of carpal tunnel syndrome in a general population. JAMA 1999;282:153-158.
2. Phalen GS. The carpal-tunnel syndrome. Clinical evaluation of 598 hands. Clin Orthop Relat Res 1972;83:29-40.
3. Lee D, van Holsbeeck MT, Janevski PK, Ganos DL, Ditmars DM, Dar- ian VB. Diagnosis of carpal tunnel syndrome. Ultrasound versus elec- tromyography. Radiol Clin North Am 1999;37:859-872, x.
4. Buchberger W, Schön G, Strasser K, Jungwirth W. High-resolution ul- trasonography of the carpal tunnel. J Ultrasound Med 1991;10:531- 5. Wiesler ER, Chloros GD, Cartwright MS, Smith BP, Rushing J, Walk-537.
er FO. The use of diagnostic ultrasound in carpal tunnel syndrome. J Hand Surg Am 2006;31:726-732.
6. Duncan I, Sullivan P, Lomas F. Sonography in the diagnosis of carpal tunnel syndrome. AJR Am J Roentgenol 1999;173:681-684.
7. Wong SM, Griffith JF, Hui AC, Tang A, Wong KS. Discriminatory so- nographic criteria for the diagnosis of carpal tunnel syndrome. Arthri- tis Rheum 2002;46:1914-1921.
8. Koyuncuoglu HR, Kutluhan S, Yesildag A, Oyar O, Guler K, Ozden A.
The value of ultrasonographic measurement in carpal tunnel syndrome in patients with negative electrodiagnostic tests. Eur J Radiol 2005;56:
365-369.
9. Ziswiler HR, Reichenbach S, Vögelin E, Bachmann LM, Villiger PM, Jüni P. Diagnostic value of sonography in patients with suspected car- pal tunnel syndrome: a prospective study. Arthritis Rheum 2005;52:304- 10. Padua L, Pazzaglia C, Caliandro P, Granata G, Foschini M, Briani C, 311.
et al. Carpal tunnel syndrome: ultrasound, neurophysiology, clinical and patient-oriented assessment. Clin Neurophysiol 2008;119:2064- 2069.
11. Klauser AS, Halpern EJ, De Zordo T, Feuchtner GM, Arora R, Gruber J, et al. Carpal tunnel syndrome assessment with US: value of addition- al cross-sectional area measurements of the median nerve in patients versus healthy volunteers. Radiology 2009;250:171-177.
12. Dückelmann AM, Kalache KD. Three-dimensional ultrasound in eval-
uating the fetus. Prenat Diagn 2010;30:631-638.
13. Pyun SB, Kang CH, Yoon JS, Kwon HK, Kim JH, Chung KB, et al.
Application of 3-dimensional ultrasonography in assessing carpal tun- nel syndrome. J Ultrasound Med 2011;30:3-10.
14. Bayrak IK, Bayrak AO, Tilki HE, Nural MS, Sunter T. Ultrasonogra- phy in carpal tunnel syndrome: comparison with electrophysiological stage and motor unit number estimate. Muscle Nerve 2007;35:344-348.
15. Karadağ YS, Karadağ O, Ciçekli E, Oztürk S, Kiraz S, Ozbakir S, et al. Severity of Carpal tunnel syndrome assessed with high frequency ultrasonography. Rheumatol Int 2010;30:761-765.
16. Karmakar M, Li X, Li J, Sala-Blanch X, Hadzic A, Gin T. Three-di- mensional/four-dimensional volumetric ultrasound imaging of the sci- atic nerve. Reg Anesth Pain Med 2012;37:60-66.
17. Choquet O, Capdevila X. Case report: Three-dimensional high-resolu- tion ultrasound-guided nerve blocks: a new panoramic vision of local anesthetic spread and perineural catheter tip location. Anesth Analg 2013;116:1176-1181.
18. Girtler MT, Krasinski A, Dejaco C, Kitzler HH, Cui LG, Sherebrin S, et al. Feasibility of 3D ultrasound to evaluate upper extremity nerves. Ul- traschall Med 2013;34:382-387.
19. Clendenen SR, Robards CB, Clendenen NJ, Freidenstein JE, Green- grass RA. Real-time 3-dimensional ultrasound-assisted infraclavicular brachial plexus catheter placement: implications of a new technology.
Anesthesiol Res Pract 2010;2010. pii: 208025.
20. Moran L, Perez M, Esteban A, Bellon J, Arranz B, del Cerro M. Sono- graphic measurement of cross-sectional area of the median nerve in the diagnosis of carpal tunnel syndrome: correlation with nerve conduction studies. J Clin Ultrasound 2009;37:125-131.
21. Lee CH, Kim TK, Yoon ES, Dhong ES. Correlation of high-resolution ultrasonographic findings with the clinical symptoms and electrodiag- nostic data in carpal tunnel syndrome. Ann Plast Surg 2005;54:20-23.
22. Mondelli M, Filippou G, Gallo A, Frediani B. Diagnostic utility of ul- trasonography versus nerve conduction studies in mild carpal tunnel syndrome. Arthritis Rheum 2008;59:357-366.
23. Moghtaderi A, Sanei-Sistani S, Sadoughi N, Hamed-Azimi H. Ultra- sound evaluation of patients with moderate and severe carpal tunnel syndrome. Prague Med Rep 2012;113:23-32.
24. Ooi CC, Wong SK, Tan AB, Chin AY, Abu Bakar R, Goh SY, et al. Di- agnostic criteria of carpal tunnel syndrome using high-resolution ultra- sonography: correlation with nerve conduction studies. Skeletal Radi- ol 2014. [Epub ahead of print]