서 론
원자력시설 사고로 환경으로 방출된 방사성물질로 인해 인간 및 환경에 미치는 중장기적 영향을 평가하기 위해서는 환경 내 방사성 핵종의 장기거동을 평가하는 기술 개발이 필수적이다(UNSCEAR 2008; CNL 2017; Saito et al. 2019). 수년에서 수십 년 이상의 피폭선량의 대부분은 오염된 환경 으로부터의 외부피폭과 음식 및 물 섭취로 인한 내부피폭에 기인한다(UNSCEAR 2015). 특히, 사고에 의한 인체 및 환 경 영향을 정확히 평가하기 위해서는 대기, 해양 및 담수 환 경 내 방사성 핵종의 확산 평가모델, 육상 및 수계 먹이사슬 (food chain) 내 방사성 핵종거동 평가모델, 선량 평가모델, 건강영향 평가모델 등이 결합된 형태의 통합적인 모델의 개 발이 필수적이다. 방사선사고 시 대기 및 해양으로 누출된 방사성물질의 거 동 해석을 위한 모델은 다수 개발되었지만(Draxler 2003; Katata et al. 2012; Perianez et al. 2012; Min et al. 2014; Suh et al. 2017), 대기, 해양, 담수 환경 내 핵종 확산평가, 먹 이사슬 및 선량평가 등을 종합적으로 수행할 수 있도록 개 발된 모델은 RODOS(Real-time Online DecisiOn Support system) 시스템(Huang et al. 2016)과 방사선환경방호 시스 템 RAPS-K(Radiological Accident Preparedness System in
호수 환경 수생생물 내 핵종농도 평가를 위한 먹이사슬 모델 개발
서경석*· 민병일 · 김소라 · 박기현 · 김지윤
한국원자력연구원 환경안전평가연구부
Development of Food Chain Model for
Evaluating the Concentration of Radionuclide in
Aquatic Organism of Lake
Kyung-Suk Suh*, Byung-Il Min, Sora Kim, Kihyun Park and Jiyoon Kim
Environmental Safety Assessment Research Division, Korea Atomic Energy Research Institute,Daejeon 34057, Republic of Korea
Abstract - Food chain model has been developed to evaluate the process of the transport and accumulation of radionuclide in aquatic organism by radioactive materials entered into freshwater environment from the nuclear accident. The model was composed of eight boxes to estimate the concentrations of aquatic organism and it was based on the ordinary partial differential equations. Developed model was compared with concentrations of organism in lake which was measured from the Fukushima accident. Some results agreed well with measurements and the others showed a little discrepancy due to the coarse box size in the model and lack of the observations. However, the simulations generally agreed with measurements and the developed food chain model will be used to assess the dose which is affected human by ingestion of contaminated products in terrestrial and aquatic environment.
Key words : Food chain, Radionuclide, Aquatic organism, Ingestion, Contaminated products
─ 117 ─
Technical Paper
* Corresponding author: Kyung-Suk Suh, Tel. +82-42-868-4788, Fax. +82-42-868-8943, E-mail. [email protected]
Korea)(서 2017)가 유일하다. 한국원자력연구원에서 개발한 방사선환경방호시스템 RAPS-K는 크게 대기확산모델, 해양 확산모델, 먹이사슬 모델 및 피폭선량 평가모델로 구성되어져 있다. 육상 및 수생 환경 내 생물군의 방사성 핵종의 농도와 오염 된 농수산물 섭취로 인한 섭취선량을 평가하기 위한 LARIAS
(Land and Aquatic Radionuclide transport and Ingestion dose Assessment System)가 1단계 개발되어 방사선환경방호시스 템 내 포함되어 있다(서 2017). 본 연구에서는 사고로 인해 방출된 방사성 핵종의 환경 내 핵종분포 농도자료를 기본 자 료로 다양한 경로를 통한 피폭선량을 평가하는 모델을 구축 하는 과정에서 담수환경(호수)의 수생 생물 내 방사성 핵종의 농도를 평가하기 위한 먹이사슬 모델에 대하여 기술하였다.
재료 및 방법
1. 먹이사슬 모델 호수 환경의 먹이사슬 내 핵종거동을 평가하기 위한 격실 모델의 개요를 Fig. 1에 나타내었으며, 8개의 격실(box)로 구성되어 있다. 4개의 격실은 호수 주변의 유역(catchment area, Ccat), 호수의 물(Cwat), 호수 바닥의 표면 퇴적토(Ctop)와 심층 퇴적토(Cdeep)이다. 호수의 오염원은 크게 3가지로, 대기중에서 호수 물로 직접 침적되는 경우, 유역 내 침적된 방사
성 핵종이 침식작용에 의해 호수의 물로 유입되는 경우, 오염
된 강물이 호수로 유입되는 경우를 고려하였다. 호수 내 먹이
사슬은 4그룹으로 phytoplankton(Cphy), zooplankton(Czoo),
prey-fish(Cprey) 그리고 predatory fish(Cpred)으로 분류하여 4 개의 격실로 구성하였다. Phytoplankton은 물의 방사성 핵종 의 섭취만을 고려하였고, zooplankton, preyfish 및 predatory fish의 경우는 물과 먹이로부터의 방사성 핵종의 섭취를 고려 하였다. 4그룹의 생물종 모두에서 방사성 핵종의 물리적, 생 물학적 손실을 고려하였다. 2. 먹이사슬 모델의 기본 방정식 호수 환경의 먹이사슬 내 핵종거동을 평가하기 위해 각 격 실 간의 핵종 이동은 다양한 속도상수를 적용하여 단순화된 동적모델로 구성하였다. 격실 간 핵종거동은 식(1)에서 식(4) 로 수계 생물종의 격실 내 핵종농도는 식(5)에서 식(8)에 제 시된 방정식을 기본으로 한다. 식(1)에서 식(4)는 수계 부분 의 4개 격실의 시간에 따른 핵종농도를 나타내는 식이다. Catchment(Ccat): dCcat
---= -(trero+λrad) Ccat
dt (1)
Water(Cwat):
dCwat Rin
---=treroCcat+trtw Ctop+
(
---)
INwatdt lakevol
Rout
-
(
---+λrad+trwt)
Cwatlakevol (2)
Top sediment(Ctop): dCtop
---=trwt Cwat+trdt Cdeep-(trtw+trtd+λrad) Ctop
dt (3)
Deep sediment(Cdeep): dCdeep
---=trtd Ctop-(trdt+trdeep+λrad) Cdeep
dt (4)
윗 식에서
Ccat : radionuclide concentration in catchment area(Bq·m-3) Cwat : radionuclide concentration in lake water(Bq·m-3) Ctop : radionuclide concentration in top sediment(Bq·m-3) Cdeep : radionuclide concentration in deep sediment(Bq·m-3) trero : erosion rate from catchment to lake water(d-1)
Fig. 2. Location of Hayama lake, Akimoto lake and Inawashiro lake in the Fukushima prefecture. Table 1. Values of parameters in the water-sediment radionuclide migration model
vwsa) (ms-1) kswb) (s-1) kdsc) (s-1) Monte(2001) River 13790SrCs 3.5×101.0×10-7-6 3.0×103.0×10-8-8 1.2×10- -8 Lake 90137SrCs 1.2×103.5×10-7-7 3.0×103.0×10-8-8 5.8×10- -9 Reservoir 90137Sr 1.2×10⁻⁷ 3.0×10⁻⁸ -Cs 3.5×10⁻⁷ 1.5×10⁻⁸ 1.2×10⁻⁸ Monte et al.(2009) 90137SrCs 1.0×103.0×10-8-7~~3.0×101.0×10-6-7 1.0×106.0×10-8-10~~3.0×106.0×10-8-9 Monte(1996) Scenario 1d) 90Sr 1.0×10⁻⁷ 5.6×10⁻⁹ 8.8×10⁻¹⁰ 137Cs 1.6×10⁻⁶ 1.5×10⁻⁸ 1.2×10⁻⁸ Scenario 2e) 90Sr 1.2×10⁻⁸ 3.0×10⁻⁸ 1.0×10⁻¹⁰ 137Cs 3.6×10⁻⁷ 2.9×10⁻⁸ 5.8×10⁻⁹
a)vws(ms-1): radionuclide migration velocity water to sediment b)ksw(s-1): radionuclide resuspension rate from sediment to water c)kds(s-1): radionuclide migration rate to deep sediment
d)Scenario 1: Wash-off 90Sr and 137Cs deposit from the Pripyat floodplain
λrad : radioactive decay rate constant(d-1) Rin : water inflow rate to lake(m3·d-1) Rout : water outflow rate from lake(m3·d-1)
INwat : radionuclide concentration in inflow water(Bq·m-3) lakevol : lake volume(m3)
trwt : radionuclide transfer rate from lake water to top sedi-ment(d-1)
trtw : radionuclide transfer rate from top sediment to lake water(d-1)
trdt : radionuclide transfer rate from deep to top sediment(d-1) trtd : radionuclide transfer rate from top to deep sediment(d-1) trdeep : radionuclide transfer rate from deep sediment to
dee-per sediment(d-1) 대기로부터 침적되어 호수로의 방사성 핵종의 거동은 침 식률을 적용하여 평가하였다. 오염된 강물이 호수로 유입되 고 다시 유출되는 현상을 물의 유입 및 유출 속력과 호수의 부피를 적용하여 계산하였다. 호수로 유입되는 물 내 핵종 오염 농도는 1일 단위로 평가기간 전체에 대해 입력 가능하 도록 구성하였다. 4개 격실로 구성된 수계 생물종의 시간에 따른 핵종농도 를 나타내는 식은 다음과 같다. Phytoplankton(Cphy): dCphy
---=(Kw 0 Rw_up 0) Cwat-(λbio 0+λrad) Cphy
dt (5)
Zooplankton(Czoo): dCzoo
---=(Kw1Rw_up1) Cwat+(Kf 1Rf_up1) dt
dwfzoo
(
Cphy---)
-(λbio1+λrad) Cphydwfphy (6)
Prey fish(Cprey): dCprey
---=(Kw2Rw_up2) Cwat+(Kf 2 Rf_up2) dt
dwfprey
(
Czoo---)
-(λbio 2+λrad) Cpreydwfzoo (7)
Predatory fish(Cpred): dCpred
---=(Kw3 Rw_up3) Cwat+(Kf 3 Rf_up3) dt
dwfpred
(
Cprey---)
-(λbio3+λrad) Cpreddwfprey (8)
윗 식에서
Cphy : radionuclide concentration in phytoplankton(Bq·kg-1) Czoo : radionuclide concentration in zooplankton(Bq·kg-1)
Cprey : radionuclide concentration in prey fish(Bq·kg-1) Cpred : radionuclide concentration in predatory fish(Bq·kg-1) Kw 0 : ratio of radionuclide absorbed from ingested water
to phytoplankton(no-dimension)(Kw1, Kw2, Kw3 for
Fig. 3. Sampling positions in Lake Hayama, Lake Akimoto and Lake Inawashiro.
(a) Lake Hayama: G-1, G-2 and G-3
(b) Lake Akimoto: H-1, H-2 and H-4
zooplankton, prey fish, predatory fish)
Rw_up 0 : water uptake rate of phytoplankton(m3·kg-1·d-1) (Rw_up1, Rw_up2, Rw_up3 for zooplankton, prey fish, pred-a tory fish)
Kf 0 : ratio of radionuclide absorbed from ingested food to phy- toplankton(no-dimension),(Kf 1, Kf 2, Kf 3 for zooplank-ton, prey fish, predatory fish)
Rf_up 0 : food uptake rate of phytoplankton(kg·kg-1·d-1)
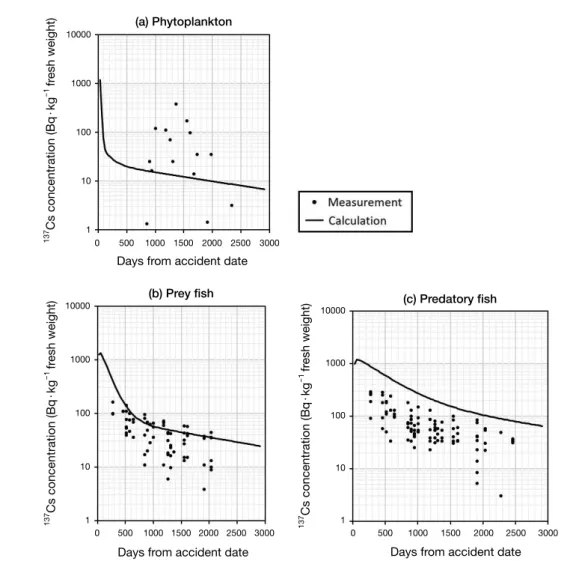
Fig. 4. Comparison of measured and calculated concentrations in Lake Hayama: (a) phytoplankton, (b) prey fish, (c) predatory fish. (a) Phytoplankton
(b) Prey fish (c) Predatory fish
137 Cs concentration (Bq · kg -1 fr esh weight) 137 Cs concentration (Bq · kg -1 fr esh weight) 137 Cs concentration (Bq ·kg -1 fr esh weight)
Days from accident date Days from accident date
Days from accident date 10000 1000 100 10 1 10000 1000 100 10 1 10000 1000 100 10 1 0 500 1000 1500 2000 2500 3000 0 500 1000 1500 2000 2500 3000 0 500 1000 1500 2000 2500 3000
Table 2. Basic data and atmospheric depositions of Lake Hayama, Lake Akimoto and Lake Inawashiro
Lake Hayama Akimoto Inawashiro
Distance from Fukushima nuclear site(km) 38 85 78
Altitude(m) 175 736 514
Lake type Artifical dam reservoir Naturally dammed lake Tectonic lake
Area(km2) 1.75 3.9 105
Volume(km3) 0.0362 0.0328 3.86
Max. depth(m) 70 33 95
Avg. depth(m) 19.9 9.9 37
Turnover time(yr) 0.48 0.075 3.7
(Rf_up1, Rf_up2, Rf_up3 for zooplankton, prey fish, preda-tory fish)
λbio 0 : biological loss rate of phytoplankton(d-1)
(λbio1, λbio2, λbio3 for zooplankton, prey fish, predatory fish)
dwf : dry weight fraction of organism(no-dimension) 4개의 생물종은 호수 물을 섭취함으로써 물에 존재하 는 방사성 핵종을 체내로 흡수하는 것으로 가정하였다. zooplankton은 phytoplankton을, prey fish는 zooplankton을, predatory fish는 prey fish를 먹이원으로 하여 먹이로부터 방 사성 핵종을 섭취하는 것으로 가정하였다. 방사성 핵종의 손실은 생물학적, 물리학적 반감기를 적용하여 평가하였다. 3. 먹이사슬 모델의 기본 입력자료 먹이사슬 모델에서 생물학적 반감기, 물과 퇴적토 간의 핵종 이동, 퇴적토 간의 핵종 이동, 침식률 등이 중요한 입 력자료이다. 생물학적 반감기는 생물체 내 방사성 핵종의 농도가 반으로 줄어드는 데까지 소요되는 시간으로 정의되 는데, 생물학적 반감기는 환경의 조건에 따라 다양한 값을 보이고 있다(IAEA 2000). 수생 무척추동물과 어류의 137Cs 의 생물학적 반감기는 각각 10~100일, 100~1,000 정도 범 위이다(Reichel et al. 1970). 식물성 플랑크톤은 1~2일, 동 물성 플랑크톤은 5일, chironomid larvae는 7일의 생물학적 반감기를 보이고(Vanderploeg et al. 1975), 어류는 20~200 일 정도(perch는 200일, roach는 85일)의 생물학적 반감기 를 나타내는 것으로 보고되었다(Kolehmainen et al. 1968). 본 연구에서는 상기 자료로부터 호수 내 생물종의 생물학적 반감기 자료를 인용하여 기본 입력자료로 이용하였다. 물과 퇴적토 간의 핵종 이동은 환경 내 분배계수, Kd에 의 하여 설명될 수 있는데, 이 값은 환경 내에서 방사성 핵종이 고체 및 액체와 어떻게 상호작용을 하는지 모사하기 위해 가 장 일반적으로 사용되는 변수이다. Table 1에는 일부 연구결 과로부터 도출된 물과 퇴적토 간의 퇴적(sedimentation)과 재 부유(resuspension)에 의한 핵종의 이동 계수를 제시하였다. 본 연구에서는 호수의 물과 표면 퇴적토 간의 핵종 이동에 대
Fig. 5. Comparison of measured and calculated concentrations in Lake Akimoto: (a) phytoplankton, (b) prey fish, (c) predatory fish. (a) Phytoplankton
(b) Prey fish (c) Predatory fish
137 Cs concentration (Bq · kg -1 fr esh weight) 137 Cs concentration (Bq ·kg -1 fr esh weight) 137 Cs concentration (Bq · kg -1 fr esh weight)
Days from accident date Days from accident date
Days from accident date 10000 1000 100 10 1 10000 1000 100 10 1 10000 1000 100 10 1 0 500 1000 1500 2000 2500 3000 0 500 1000 1500 2000 2500 3000 0 500 1000 1500 2000 2500 3000
하여 Monte et al.(2009)의 변수를 적용하였다. 또한, 대기로부터 침적된 방사성 핵종에 의해 오염된 호수 유역으로부터 호수로의 방사성 핵종의 거동은 IAEA의 침식 률 자료를 이용하였다(IAEA 2000).
결과 및 고찰
본 연구에서 개발 된 먹이사슬 모델을 이용하여 후쿠시마 사고에 의해 오염된 후쿠시마 현 내 호수들의 수생생물 내 137Cs 농도를 평가하여, 측정자료 값과 비교하였다. 평가 대상 은 후쿠시마 현 내 Hayama 호수, Akimoto 호수, Inawashiro 호수이며, Fig. 2에 각 호수의 위치를 나타내었다. 또한, Table 2에 평가 대상인 3개 호수의 특징과 137Cs의 호수별 대기로 부터의 초기 침적농도 값을 제시하였다(Nakata et al. 2015; Wada et al. 2016). 각 호수로 유입되는 137Cs은 사고 초기 대기로부터 호수 표 면의 직접 침적과 대기로부터 유역 내 침적된 후 강우로 인 하여 호수로 유입되는 137Cs의 농도만을 고려하였다. 오염된 강에서 호수로 유입되는 137Cs의 농도는 측정 자료의 부재로 본 연구에는 적용하지 않았다. 또한, 계산 결과와 비교를 위 해 일본 환경성에서 웹을 통해 공개하고 있는 2011년 12월 에서 2017년 12월까지의 측정 자료를 수집하여 활용하였다(Ministry of Environment, Government of Japan 2017). 웹에
공개하고 있는 데이터는 담수 환경(강, 호수) 내 생물종에서 측정된 134Cs, 137Cs, 90Sr의 농도 값으로 매년 4차례(계절별) 에 걸쳐 측정한 값이다. 평가 대상 3개의 호수에 대해서는 약 25~30종의 생물종 내 핵종농도에 대한 데이터를 공개하고 있다. 본 연구에서는 4개 생물종(phytoplankton, zooplankon, prey fish, predatory fish)에 대하여 평가가 가능하지만, 후 쿠시마 현 내 3개 호수에서는 3개 생물종(phytoplankton, zooplankon, prey fish, predatory fish)에 대해서만 관측 결과
가 존재하여 계산값과의 비교를 위하여 3개 생물종을 선택하
여 비교하였다. 3개 호수(Lake Hayama, Lake Akimoto and Lake Inawashiro lake)의 측정 위치를 Fig. 3에 나타내었다.
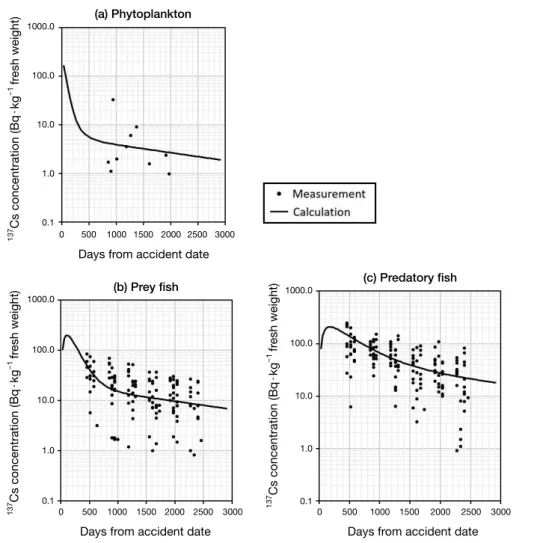
Fig. 6. Comparison of measured and calculated concentrations in Lake Inawashiro :(a) phytoplankton,(b) prey fish,(c) predatory fish. (a) Phytoplankton
(b) Prey fish (c) Predatory fish
137 Cs concentration (Bq · kg -1 fr esh weight) 137 Cs concentration (Bq ·kg -1 fr esh weight) 137 Cs concentration (Bq · kg -1 fr esh weight)
Days from accident date Days from accident date
Days from accident date 1000.0 100.0 10.0 1.0 0.1 1000.0 100.0 10.0 1.0 0.1 1000.0 100.0 10.0 1.0 0.1 0 500 1000 1500 2000 2500 3000 0 500 1000 1500 2000 2500 3000 0 500 1000 1500 2000 2500 3000
본 연구에서는 Hayam 호수의 경우 G-1, G-2, G-3에서 Aki-moto 호수의 경우 H-1, H-2, H-4에서 Inawashiro 호수의 경 우 I-1, I-2, J-1에서 관측결과를 3개 생물군에 대하여 시계열 로 표시하여 계산값과 비교하여 Fig. 4에서 Fig. 6에 나타내 었다. Fig. 4에서 Fig. 6의 관측값은 후쿠시마 원전 사고일인 2011년 3월 11일을 기준으로 약 7년의 기간에 대해 3개 호수 의 측정지점에서 관측한 한 시계열 값이다. Fig. 4에서 Fig. 6에 나타낸 바와 같이 3개의 호수 생물종에 대한 계산값과 측정값의 결과는 비슷한 경향을 나타내고, 일 부 결과는 계산값이 낮은 수치를 나타낸다. 넓은 호수 면적에 비해 샘플이 채취되는 위치는 제한적이고, 주변 강 등으로부 터 오염된 물의 유입으로 샘플링이 수행되는 각 위치별로 측 정값의 차이가 나타날 수 있다. 또한, 먹이사슬 모델에서 관측 값과 계산값의 차이는 호수의 물, 퇴적토 등을 하나의 큰 격 실로 가정한 조건의 차이에 따른 한계점으로 판단된다.
결 론
원자력 시설 사고로 인해 환경으로 방출된 방사성물질이 수생 환경 내로 이동하여 수생 생물 내 핵종이 축적되는 먹 이사슬 모델을 개발하였다. 개발된 모델은 4개 수생생물군에 대하여 핵종이 이동과정과 핵종농도를 평가할 수 있도록 구 성하였다. 개발된 모델의 검증을 위하여 후쿠시마 사고로 주 변 호수 생물군 내에 관측한 핵종농도 값과 모델 계산값을 비 교하였다. 계산값들은 관측값과 유사한 경향을 보이기도 하 지만, 일부 계산값은 측정값과 차이를 보였다. 이는 먹이사슬 모델에서 호수의 물, 퇴적토 등을 하나의 큰 격실로 가정하여 기인한 것으로 생각된다. 향후 추가적으로 수행될 모델의 검 증작업과 더불어 개발된 먹이사슬모델 개선을 위하여 세밀한 격실의 구성과 추가적인 관측 자료의 확보가 필요하다. 본 연구에서 개발된 먹이사슬 모델은 한국원자력연구원에 서 1단계 구축된 방사선방호시스템의 한 세부 모듈로 구성되 어 운영 중으로, 전 세계 방사선사고 시 환경으로 누출된 방 사성물질에 의하여 인간과 환경에 주는 방사선 영향을 평가 하는 데 활용될 예정이다.사 사
본 연구는 과학기술정보통신부 재원으로 한국연구재단의 지원을 받아 수행되었습니다(과제번호: NRF-2017M2A8A 4015253, NRF-2015M2A2B2034282).참 고 문 헌
서경석. 2017. 방사선환경방호시스템 개요. 2017 춘계 방사선 방어학회.Canada Nuclear Laboratories. 2017. Environmental Impact Statement Summary, Canadian Environment Assessment Registry 80121. CNL, Ontario.
Draxler R. 2003. Evaluation of an Ensemble Dispersion Calcula-tion. J. Appl. Meteorol. 42:308-317.
International Atomic Energy Agency. 2000. Modelling of the transfer of radiocesium from deposition to lake ecosystems, IAEA-TECDOC-1143. 352pp. IAEA, Vienna.
Katata G, Ota M, Terada H, Chino M and Nagai H. 2012. At-mospheric discharge and dispersion of radionuclides during the Fukushima Dai-ichi nuclear power plant accident. Part I: source term estimation and local-scale atmospheric dis-persion in early phase of the accident. J. Environ. Radioact.
109:103-113.
Kolehmainen S, Hasanen E and Miettinen JK. 1968. Biological half-times of 137Cs and 22Na in different fish speicies and
their temperature dependence, Radiation Protection Part 1. 406pp. Pergamon Press, New York.
Min B, Perianez R, Park K, Kim IG and Suh KS. 2014. Assess-ment in marine environAssess-ment for a hypothetic nuclear acci-dent based on the database of tidal harmonic constants. Mar. Pollut. Bull. 87:269-275.
Monte L, Perianez R, Boyer P, Smith JT and Brittain JE. 2009. The role of physical processes controlling the behaviour of radionuclide contaminants in the aquatic environment: a re-view of state-of-the-art modelling approaches. J. Environ. Radioact. 100:779-784.
Nakata K and Sugisaki H. 2015. Impacts of the Fukushima nu-clear accident on fish and fishing grounds. 249pp. Springer Open, Amsterdam.
Perianez R, Suh K and Min BI. 2012. Local scale marine mod-elling of Fukushima releases. Assessment of water and sed-iment contamination and sensitivity to water circulation de-scription. Mar. Pollut. Bull. 64:2333-2339.
Radioactive Material Monitoring Surveys of the Water Environ-ment. 2017. Ministry of Environment in Japan. http://www. env.go.jp/en/water/rmms/surveys.htm.
Reichel DE, Dunaway PB and Nelson DJ. 1970. Turnover and concentration of radionuclides in food chains. Nucl. Safety
11:43-57.
Saito K, Mikami S, Andoh M, Matsuda N, Kinase S, Tsuda S, Sato T, Seki A, Sanada Y, Murakami HW, Yoshimura K, Takemita H, Takahashi J, Kato H and Onda Y. 2019. Tem-poral change in radiological environments on land after the Fukushima Daiichi nuclear power plant accident. J. Radiat. Prot. Res. 44:128-148.
Suh KS, Kim S and Min BI. 2017. Atmospheric Dispersion and Sea Surface Deposition of Radionuclides by the Fukushima Nuclear Accident. J. Coast. Res. 79:85-88.
Radiation. 2008. Sources and effects of ionizing radiation. UNSCEAR 2008 Report Volume II. 219pp. UNSCEAR, New York.
United Nations Scientific Committee on the Effects of Atomic Radiation. 2015. Methodology for estimating human expo-sures due to radioactive discharges. UNSCEAR 2015 Report R707. 96pp. UNSCEAR, New York.
Vanderploeg H, Parczyk DC, Wilcox WH, Kercher JR and Kaye SV. 1975. Bioaccumulation factors radionuclide in fresh-water biota, Rep. ORNL-5002, 235pp. Oak Ridge National
Laboratory, Tennessee.
Wada T, Tomiya A, Enomoto M, Sato T, Morishita D, Izumi S, Niizeki K, Suzuki S, Morita T and Kawata G. 2016. Radio-logical impact of the nuclear power plant accident on fresh-water fish in Fukushima: An overview of monitoring results. J. Environ. Radioact. 151:144-155.
Received: 27 March 2020 Revised: 15 April 2020 Revision accepted: 28 April 2020