2020 년 한국방송·미디어공학회 추계학술대회
영상 화질 평가 딥러닝 모델 재검토: 스트라이드 컨볼루션이 풀링보다 좋은가?
우딘 에이에프엠 사합, 정태충, 배성호
경희대학교
[email protected], [email protected], [email protected]
Revisiting Deep Learning Model for Image Quality Assessment: Is Strided
Convolution Better than Pooling?
Uddin A F M Shahab, TaeChoong Chung and Sung-Ho Bae
Kyung Hee University, South Korea
요 약
Due to the lack of improper image acquisition process, noise induction is an inevitable step. As a result, objective image quality assessment (IQA) plays an important role in estimating the visual quality of noisy image. Plenty of IQA methods have been proposed including traditional signal processing based methods as well as current deep learning based methods where the later one shows promising performance due to their complex representation ability. The deep learning based methods consists of several convolution layers and down sampling layers for feature extraction and fully connected layers for regression. Usually, the down sampling is performed by using max-pooling layer after each convolutional block. We reveal that this max-pooling causes information loss despite of knowing their importance. Consequently, we propose a better IQA method that replaces the max-pooling layers with strided convolutions to down sample the feature space and since the strided convolution layers have learnable parameters, they preserve optimal features and discard redundant information, thereby improve the prediction accuracy. The experimental results verify the effectiveness of the proposed method.
1. Introduction
Noise induction is an unavoidable step in our current image acquisition process. Also, there are high possibilities for images to get corrupted due to various image processing techniques such as compression, transmission, enhancement etc. As a result, measuring the quality of an image has become a necessary step in various image processing and computer vision applications, especially for quality of service (QoS) related applications. This can be well achieved by human participant since they are the ultimate receivers of images. But evaluating the visual quality by human is a cumbersome, time consuming and expensive job.
Therefore, Objective IQA has been introduced and gained a vast attention for decades to serve as an alternative of subjective evaluation by human observers. IQA can be classified into three categories depending on the availability of the distortion-free reference image: (i) full-reference FR-IQA that evaluates the quality of a test image by means of comparison with a fully presented reference image that is assumed to have perfect quality; (ii) reduced-reference IQA that evaluates the quality of a test image by comparing some partial information extracted from both test and reference images; and (iii) no-reference IQA that evaluates the quality of a test image without having any information about the reference image. This study focuses on FR-IQA.
2020 년 한국방송·미디어공학회 추계학술대회
Pixel based IQA such as Mean-squared error and PSNR predicts the quality of an image by measuring the pixel intensity differences with the reference image. However, they do not well correlate with human perception because of ignoring the human visual systems (HVS) characteristics. Wang et al. [1] suggest that using image texture as a feature for IQA is a more appropriate way than using only pixel differences. Therefore, they proposed structural similarity (SSIM) index, a remarkable work in FR-IQA domain, that measured the structural similarity between two images to estimate the image quality. After that numerous FR-IQA method have been introduced [2-11].
Machine learning has achieved state-of-the-art (SOTA) performance in almost every field, especially in computer vision tasks such as image classification, object detection, semantic segmentation, natural scene understanding, human pose estimation, and so on. Following this recent success of deep learning based approaches several learning based IQA methods have been proposed [12-15]. Bosse et. al. [14] proposed very deep network comprises ten convolutional layers and five pooling layers for feature extraction, and two fully connected layers for regression. The model was trained in an end-to-end fashion and shows promising performance. We argue that the pooling stages that was performed by max-pool operation have significant drawback of discarding information without knowing their importance. Consequently, we propose a more appropriate IQA network where we let the network to learn the importance of features and down sample by discarding less important features. Specifically, our proposed method uses learnable convolutional kernels with stride to achieve the down sampling effect that automatically preserves significant features, thereby offers high prediction performance.
2. Proposed Method
2.1. Feature Extraction
Convolutional neural networks are extremely powerful in representing complex features. As a result, they have been used in a large extent to solve difficult problems. Siamese network, a type of CNN, comprises two branches of CNN and has been used to learn similarity relations between two inputs. The weights have been shared by the two branches and the
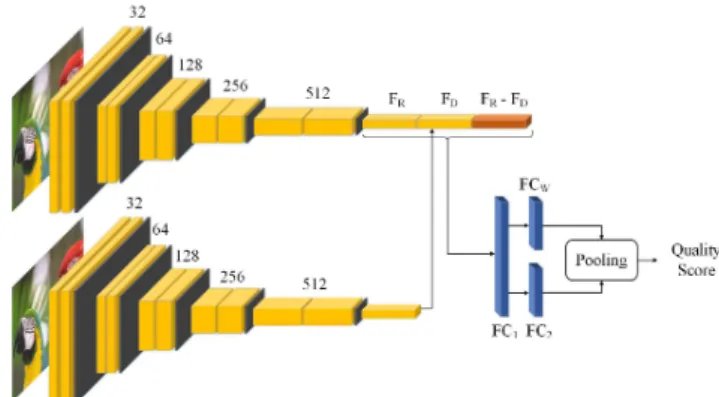
Figure 1: Network architecture of the proposed IQA method.
inputs are processed in parallel. Following the state-of-the-art works, we have used a Siamese network for feature extraction. But we only use the network elements which are learnable. Specifically, we use strided convolution with stride 2 to down sample the feature space by a factor of 0.5 after each convolution block. The feature extraction is performed by a series of conv-3-32, conv-3-32, strided_conv-3-32, conv-3-64, conv-3-64, strided_conv-3-64, conv-3-128, conv-3-128, strided_conv-3-128, conv-3-256, conv-3-256, 3-256, conv-3-512, conv-3-512, strided_conv-3-512 layers, as shown in Figure 1. The padding is 1 for all the layers and stride is 2 for the down sampling layers.
2.2. Regression
The extracted features from the Siamese network i.e., reference feature () and the distorted feature () are then passed to the feature fusion step. Here, the difference between the features (− ) is calculated. Then the concatenation of , , and − is passed to the fully connected (FC) layers for the regression problem. Since each image patch has different impact on the overall quality, we use two different branch of FC layers i.e., and to estimate the quality and its corresponding weight , respectively. Finally, the global quality is estimated as
= ∗
(1) where is the number of patches, and is the global quality which is found by the patch-wise weighted average quality i.e., the quality of each patch is multiplied by its corresponding weight (importance) and then their average is measured to estimate the overall image quality.
2020 년 한국방송·미디어공학회 추계학술대회
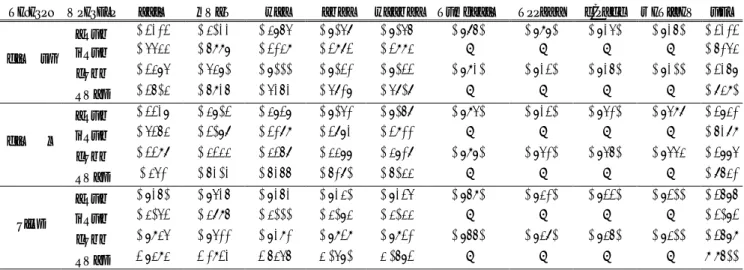
Table 1: Performance comparison on benchmark IQA datasets. The results of other methods are noted from their original paper. The best performances are highlighted by bold face text.
Dataset Measure SSIM GMSD VSI SCQI VSSCQI DOG-SSIM DeepQA PieAPP WaDIQaM Our
TID2013 SROC 0.7417 0.8044 0.8965 0.9052 0.9056 0.9260 0.9390 0.9450 0.9460 0.9659 KROC 0.5588 0.6339 0.7183 0.7327 0.7338 - - - - 0.8521 PLCC 0.7895 0.5890 0.9000 0.9071 0.9077 0.9340 0.9470 0.9460 0.9400 0.9687 RMSE 0.7608 0.6346 0.5464 0.5219 0.5202 - - - - 0.3140 TID2008 SROC 0.7749 0.8907 0.8979 0.9051 0.9062 0.9350 0.9470 0.9510 0.9532 0.9715 KROC 0.5768 0.7092 0.7123 0.7294 0.7311 - - - - 0.8634 PLCC 0.7732 0.8788 0.8762 0.8899 0.8912 0.9390 0.9510 0.9560 0.9558 0.9772 RMSE 0.851 0.6404 0.6466 0.6120 0.6088 - - - - 0.3815 LIVE SROC 0.9460 0.9546 0.9464 0.9480 0.9475 0.9630 0.9810 0.9770 0.9700 0.9878 KROC 0.8057 0.8236 0.8000 0.8098 0.8088 - - - - 0.9079 PLCC 0.9385 0.9511 0.9431 0.9373 0.9371 0.9660 0.9820 0.9860 0.9800 0.9874 RMSE 7.9838 7.1374 7.6856 8.0590 8.0697 - - - - 4.4800
Table 2: Detail information about the three benchmark and publicly available datasets.
Dataset # of Ref. Images # of Dist. Images Distortion Types # of Subjects TID2013 25 3000 24 917 TID2008 25 1700 17 838 LIVE 29 779 5 161
3. Experimental Results
To verify the effectiveness of the proposed method, we performed experiments on three widely used and largest IQA databases, i.e., TID2013 [16], TID2008 [17], and LIVE [1]. Table 2 shows the detail information about the datasets. To verify the effectiveness of the proposed method, we compare it with SOTA traditional methods [1], [6], [9-11] and learning based methods [12-15]. To evaluate the IQA models, four well-known performance metrics are employed, i.e., Spearman rank-order correlation coefficient (SROC), Kendall rank-rank-order correlation coefficients (KROC), Pearson linear correlation coefficient (PLCC) and RMS error (RMSE). For the first three metrics, the higher the score, the better the quality and for the last one, the lower the score, the better the quality.
The experimental results are presented in Table 1. It can be seen that the prediction accuracy of the proposed method is highly correlated with human perception and it outperforms all other methods in comparison in terms of all
four performance metrics on each dataset. Specifically, the proposed method gains performance improvement by 0.02%, on TID2013 and TID2008 and 0.01% on LIVE dataset than the nearly competitive method [15] in terms of SROC and PLCC, respectively. Also the prediction performance is robust on each dataset in comparison.
4. Conclusion
We reveal that the feature down sampling by Max-Pool discards information without considering their importance and prevents the network to get benefits from valuable features. Instead, we propose a better network architecture that utilizes learnable kernels i.e., strided convolution to perform the same task but with some intelligence. The learnable convolutions optimize themselves and learn the best way to reduce the feature space but improve the model accuracy. The extensive experimental results show the effectiveness of the proposed method. The quality prediction by the proposed method is highly correlated with human evaluation and it outperforms all other methods in comparison.
Acknowledgement
This work was supported by the Basic Science Research Program through the National Research Foundation of Korea under Grant [NRF- 020R1F1A1050014] and Kyung Hee University in 2016[KHU-20160601].
2020 년 한국방송·미디어공학회 추계학술대회
References
[1]. Wang, Z., Bovik, A.C., Sheikh, H.R., “Image quality assessment: from error visibility to structural similarity”, Trans. Image Process., 2004, 13, (4), pp. 600– 612.
[2]. Z. Wang, E. P. Simoncelli, and A. C. Bovik, “Multiscale structural similarity for image quality assessment,” in
Proc. Conf. Rec. 37
thAsilomar
Conf. Signals, Syst., Comput.
, Nov. 2003, pp. 1398–1402.
[3]. Z. Wang and Q. Li, “Information content weighting for perceptual image quality assessment,”
IEEE
Trans. Image Process.
, vol. 20, no. 5, pp. 1185–1198, May 2011.
[4]. A. Liu, W. Lin, and M. Narwaria, “Image quality assessment based on gradient similarity,”
IEEE
Trans. Image Process.
, vol. 21, no. 4, pp. 1500–1512, Apr. 2012.
[5]. L. Zhang, D. Zhang, and X. Mou, “RFSIM: A feature based image quality assessment metric using Riesz transforms,” in
Proc. 17th IEEE Int. Conf. Image
Process.
, Sep. 2010, pp. 321–324.[6]. W. Xue, L. Zhang, X. Mou, and A. C. Bovik, “Gradient magnitude similarity deviation: A highly efficient perceptual image quality index,”
IEEE
Trans. Image Process.,
vol. 23, no. 2, pp. 684–695,Feb. 2014.
[7]. J. Wu, W. Lin, G. Shi, and A. Liu, “Perceptual quality metric with internal generative mechanism,”
IEEE Trans. Image Process.,
vol. 22, no. 1, pp. 43–54, Jan. 2013.[8]. L. Zhang, L. Zhang, X. Mou, and D. Zhang, “FSIM: A feature similarity index for image quality assessment,”
IEEE Trans. Image Process.
, vol. 20, no. 8, pp. 2378–2386, Aug. 2011.[9]. L. Zhang, Y. Shen, and H. Li, “VSI: A visual saliency-induced index for perceptual image quality assessment,”
IEEE Trans. Image Process.,
vol. 23, no. 10, pp. 4270–4281, Oct. 2014.
[10]. Bae, S.H., and Kim, M., “A novel image quality
assessment with globally and locally consilient visual quality perception”,
Trans. Image Process.,
2016, 25, (5), pp. 2392–2406.
[11]. A.F.M. Shahab Uddin, T.C. Chung and Sung-Ho Bae, “Visual saliency based structural contrast quality index”,
IET Electronics Letters
, 55 (4), pp. 194-196, 2019.[12]. S. Pei and Chen. “Image quality assessment using human visual DOG model fused with random forest”,
IEEE Transactions on Image Processing
, vol. 24, no. 11, pp. 3282–3292, 2015.[13]. Jongyoo Kim and Sanghoon Lee, “Deep learning of human visual sensitivity in image quality assessment framework”, In Proceedings of the
IEEE Conference on Computer Vision and Pattern
Recognition (CVPR)
, 2017.[14]. E. Prashnani, H. Cai, Y. Mostofi, and P. Sen., “PieAPP: Perceptual Image-Error Assessment through Pairwise Preference”, In Proceedings of
the
IEEE Conference on Computer Vision and
Pattern Recognition (CVPR)
, pp. 1808-1817, 2018.[15]. S. Bosse, D. Maniry, T. Wiegand and W. Samek, "A deep neural network for image quality assessment,"
2016 IEEE International Conference
on Image Processing (ICIP)
, Phoenix, AZ, 2016, pp.3773-3777, doi: 10.1109/ICIP.2016.7533065. [16]. Ponomarenko, N., Ieremeiev, O., Lukin, V., “A new
color image database TID2013: innovations and results”.
Proc. Advanced Concepts for Intelligent
Vision Systems (ACIVS)
, Poznan, Poland, 2013, pp.402–413.
[17]. Ponomarenko, N., Battisti, F., Egiazarian, K., “Metrics performance comparison for color image database”.
Fourth Int. Workshop on Video
Processing and Quality Metrics for Consumer
Electronics
, Scottsdale, Arizona, USA, 14–16January 2009.