An ADAMts sol narae is required
for cell survival in Drosophila
orkhon tsogtbaatar
1, Jong-Hoon Won
1, Go-Woon Kim
1, Jeong-Hoon Han
1, Young-Kyung Bae
2& Kyung-ok Cho
1Cell survival is essential for all living organisms to cope against multiple environmental insults. Intercellular signaling between dying and surviving cells plays an important role to ensure
compensatory proliferation, preventing tissue loss after environmental stresses. Here, we show that sol narae (sona), a Disintegrin and metalloproteinase with thrombospondin motifs (ADAMts) in Drosophila is required for cell survival. sona exhibited a positive genetic interaction with Death-associated inhibitor
of apoptosis 1 (Diap1), and a negative genetic interaction with reaper (rpr). transcription patterns
of sona, Diap1, and rpr genes in the pouch region of wing discs were coordinately changed after irradiation. Interestingly, there was a negative correlation in the expression levels of Sona and DIAP1, and both cell types, one with high Sona level and the other with high Diap1 level, were resistant to irradiation-induced cell death. the sona-expressing cells rarely entered into cell cycle themselves but promoted the nearby cells to proliferate in irradiation conditions. We found that these sona-expressing cells are able to upregulate Cyclin D (Cyc D) and increase tissue size. Furthermore, transient sona overexpression increased survival rate and promoted development of flies in irradiation conditions. We propose that the two types of radiation-resistant cells, one with high sona level and the other with high Diap1 level, communicate with dying cells and between each other for cell survival and proliferation in response to irradiation.
Multicellular organisms encounter stress conditions throughout their developmental and adult stages. Damaged cells by stresses and abnormal cell division need to be removed to ensure proper development and homeostasis. Apoptosis, programmed cell death, is an evolutionally conserved process for the removal of unwanted or dam-aged cells, which involves condensations of chromatins, shrinkage of cells, and activation of caspases that degrade cellular components1–3. Apoptosis accompanies compensatory proliferation to restore damaged tissues to the
right size and shape4,5, for which intercellular communication between dying and surviving cells is essential6–8.
The wing imaginal disc of Drosophila melanogaster is an excellent system to study apoptosis and compensatory proliferation, because wing discs exhibit little apoptosis during normal larval development but exhibit extensive apoptosis under stress conditions9–11. Wing discs with up to 40–60% of extensive cell death can yield normal adult
wings, indicating that regeneration process in wing discs is efficient and robust4,7,9,11–13.
Diap1 is one of the most important proteins for cell survival under stress conditions. Diap1 is an E3 ubiquitin ligase that blocks cell death by tagging the caspases with ubiquitin for proteasome-mediated degradation14,15.
Under severe stress conditions, the activity and the amount of Diap1 protein is decreased by the binding of pro-apoptotic proteins such as Head involution defective (Hid), Reaper (Rpr) and Grim16–20. Especially,
bind-ing of Hid stimulates autoubiquitination of Diap1 that results in degradation of Diap114,20,21. Among these
pro-apoptotic genes, rpr is expressed in a pattern most similar to that of dying cells16, and irradiation can activate
transcription of rpr in dying cells through p53 binding to an enhancer of the rpr gene22,23. Heterozygous Diap1
flies are more sensitive to damages than wild-type flies, demonstrating that the amount of Diap1 correlates with the extent of cell survival, and the cells enter the apoptotic process when the level of Diap1 falls below the critical point because of pro-apoptotic proteins14,20,24. Signaling pathways such as JAK-STAT and Hippo pathways are
involved in controlling the transcriptional rate of Diap125–27.
We recently reported that a Drosophila ADAMTS Sona is important for fly development and promotes Wg signaling28. Sona is processed to an active form in both intracellular and extracellular regions, and promotes
Wg secretion. In general, ADAMTSs are secreted proteases that function in extracellular matrix (ECM). Six
1Department of Biological Sciences, Korea Advanced Institute of Science and Technology, 291 Daehak-ro, Yuseong-gu, Daejeon, Korea. 2Present address: center for Bioanalysis, Korea Research institute of Standards and Science, 267 Gajung-ro, Yuseung-gu, Daejeon, Korea. Correspondence and requests for materials should be addressed to Y.-K.B. (email: [email protected]) or K.-O.C. (email: [email protected])
Received: 12 June 2018 Accepted: 10 December 2018 Published: xx xx xxxx
www.nature.com/scientificreports/
fly ADAMTSs are involved in various processes such as cell migration, organogenesis and cell signaling29–31.
Similarly, nineteen mammalian ADAMTSs serve diverse roles32. Some are involved in processing ECM
pro-teins, and malfunction of these ADAMTSs causes connective tissue disorder, arthritis, and arthrosclerosis. Other ADAMTSs regulate cell proliferation and cell survival, and their malfunction causes tumor development and metastasis. Despite involvement of ADAMTSs in diverse cellular functions, the underlying mechanisms of these ADAMTSs are still largely unknown.
We report here that sona is required for cell survival. sona is expressed in a patchy pattern in the wing disc, and irradiation coordinately changed transcription of both sona and Diap1 with negative correlation. Cells expressing either sona or Diap1 at a high level did not exhibit cell death, indicating these two types of cells are resistant to cell death. Consistent with their response to irradiation, sona exhibited a positive genetic relationship with Diap1 but negative genetic relationship with rpr. Furthermore, Sona upregulated the level of Cyc D and increased cell proliferation in a cell non-autonomous manner. We propose that the intercellular signaling between the two types of surviving cells, one expressing sona and the other expressing Diap1, plays an important role for cell survival and compensatory proliferation.
Results
Loss of sona results in cell death.
We previously reported that expression of sona RNAi driven by variousGal4 lines results in lethality and malformed appendages28. sona-RNAi-1 and -2 lines were generated by using two
different regions of the sona cDNA, and these RNAi lines driven by various Gal4 lines exhibit same phenotypes but with varied strengths28. For instance, engrailed (en)-Gal4 > sona RNAi-13–23 (en > sona RNAi-13–23) wings were
smaller in the posterior region (Supplementary Fig. S1a,b). The average distance between L3 and L4 veins was only about 70% of the control (n = 10), and anterior cross-vein was absent in 40% of patched (ptc) > sona RNAi-111–4
wings cultured at 18 °C (n = 23) (Fig. 1a–c). Hair density in the L3-L4 region, however, was unchanged (Fig. 1a,b). Thus, the loss of sona caused reduction in cell number but not cell size.
We then examined whether cell death is responsible for the reduced cell number in sona RNAi-expressing wings. Indeed, sona RNAi expressed by apterous (ap)-, ptc-, and en-Gal4s increased cell death detected by an anti-body generated against the cleaved form of human Caspase 3 (CC3) that indicates fly Dronc activity (Fig. 1e,g; Supplementary Fig. S1c)33–35. The affected dorsal domain in ap > sona RNAi-111–4 discs exhibited a high level of
CC3, and highly condensed nuclei were present in the basal region (Fig. 1d,e; Supplementary Fig. S1d,e). Highly condensed nuclei were also present in the anterior-posterior boundary of ptc > sona RNAi-111–4 discs (Fig. 1f,g).
When p35 that inhibits the activity of effector caspases36 was coexpressed with sona RNAi, the level of CC3 was
reduced and the morphology of nuclei became normal although the nuclei still remained at the basal region (Fig. 1h). Therefore, p35 largely rescued the loss of sona phenotypes.
Different kinds of sona clones are generated.
To further prove that Sona functions in cell survival, we examined whether sona47 wing discs show any sign of cell death. Because Sona is involved in Wg signaling, wewanted to check whether the role of sona in cell survival is specific to Wg-producing cells or general to cells in the pouch. To this end, we recombined sona47 allele with the wg-LacZ marker wgen-1137, and found that the wing
pouch region of homozygous sona47 discs had less number of nuclei compared to that of heterozygous sona47/+
discs at the apical region (compare Fig. 2a,c’). At the basal region, condensed nuclei were detected in the sona47
discs but not in sona47/+ discs (compare Fig. 2b’,d’). Furthermore, Wg-LacZ expression was absent in the DV
midline at the apical region and barely visible at the basal region of sona47 discs (compare Fig. 2a” and c”, arrows in
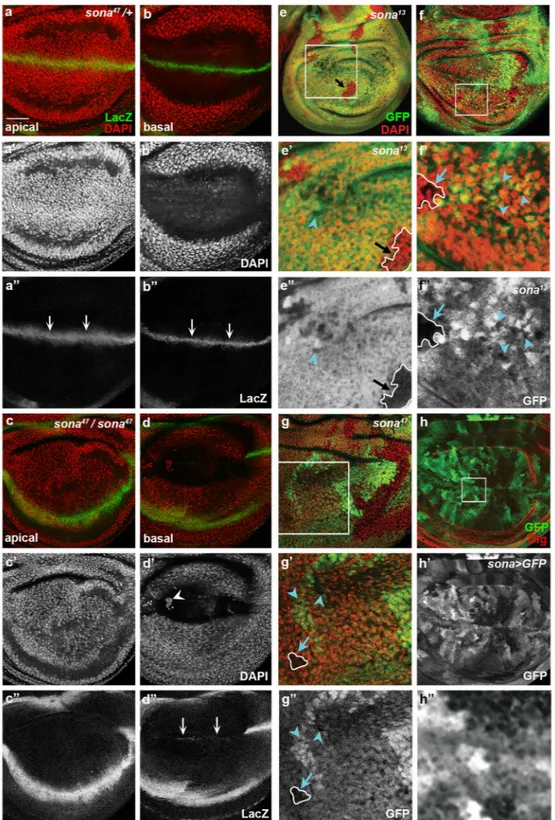
b” and d”). These results showed that sona is important for the survival of both wing pouch cells and wg-lacZ cells. We then examined sona13 and sona47 clones marked by the absence of GFP in discs. Interestingly, the size and
cell density of sona clones were widely varied (Fig. 2e–g). Based on the difference in clone size, we arbitrarily assigned the clones to three groups. The first group represented single-cell clones with no nuclei, which may absolutely require Sona (blue arrowheads in Fig. 2e–g). The second group of clones was larger than the first group of clones and their nuclei were sparser than their heterozygous counterparts (blue arrows in Fig. 2f,g). Thus, these cells may require Sona at a lesser extent than the cells in the first group of clones. The third group of clones was large in size and the cell density was same as heterozygous counterparts (black arrows in Fig. 2e–e”). Thus, the cells in these clones did not require Sona.
These different sona clones reminded us of the patchy pattern of GFP driven by the sona-Gal4 line, P{GawB} CG9850. The intensity of GFP in the sona > GFP disc varied widely in a highly magnified image (Fig. 2h), and has been shown to be similar to the in situ hybridization pattern of sona transcripts28. To further prove this point,
we co-stained sona > GFP discs for GFP and Sona protein with anti-GFP and Sona-Pro antibody28. We found
that the level of GFP correlated with that of Sona protein in sona > GFP wing discs, indicating that GFP driven by sona-Gal4 driver reflects both sona transcript and Sona protein (Supplementary Fig. S2). Therefore, the three different kinds of sona clones may have been generated by the differences in the level of sona expression.
We expected to see the sona clones in the entire pouch region because sona was expressed in the entire wing pouch region. Indeed, the large sona13 clones were generated randomly without any preferred location
(Supplementary Fig. S3). Overall shapes of large sona clones were similar to those wedge-typed control clones but sona clones appeared to be somewhat rounder than the wild-type clones. To further identify differences between wild-type clones and sona clones, we next generated sona RNAi clones (Supplementary Fig. S4). We col-lected embryos from hsFlp > Actin > CD2 > Gal4 UAS-GFP and hsFlp > Actin > CD2 > Gal4 UAS-GFP UAS-sona
RNAi-111–4 flies for one day at room temperature, and heat-shocked them for one hour at 37 °C at five
differ-ent time points (Supplemdiffer-entary Fig. S4a). Examination of GFP-positive wild-type clones and sona RNAi clones revealed that average area of RNAi clones are considerably less than that of wild-type clones (Supplementary Fig. S4b–j). When the clones were generated at the 3rd instar stage that was 29 hours before dissection, wild-type
clones were evenly distributed in the wing pouch but sona RNAi clones were absent in some particular regions (Supplementary Fig. S4k–m). These data are consistent with our finding that cells in the pouch region differen-tially require Sona.
Figure 1. Loss of sona causes apoptosis. Genotypes of wing discs and the visualized proteins are indicated at the upper and lower right of confocal images in all figures, respectively. (a–c) control ptc > GFP (a) and ptc > sona
RNAi-111–4 (b) wings cultured at 18 °C. Arrows in (a,b) indicate presence and absence of anterior cross-veins,
respectively. The regions marked with the black boxes in (a,b) are magnified in a’ and b’. (c) The distance between L3 and L4 veins in a’ and b’ were measured and graphed. Sample numbers are indicated at the top of bars. (d,e) Dorsal cells with CC3 and nuclei are marked with arrows in e’ and e”. (f–h) CC3 signals and pyknotic nuclei at the basal region are marked with arrows. Scale bars: (d,e) 60 μm; (f–h) 40 μm.
www.nature.com/scientificreports/
Figure 2. Mosaic pattern of sona expression may be responsible for the three types of sona clones. Confocal planes are indicated at the lower left. (a–d) The effects of sona47 mutation on the survival of Wg-lacZ cells and
the number of nuclei. Wing discs of heterozygous (a,b) and homozygous sona47 allele (c,d) are used. The loss
of wg-lacZ cells is marked by arrows at the apical region in a” compared to c” and at the basal region in d” compared to b”. Large, medium-sized, and small sona13 and sona47 clones are marked with black arrows, blue
arrows, and blue arrowheads, respectively. The regions marked with white boxes in e–g are magnified in e’–g’. (h) Expression pattern of GFP in sona > GFP wing discs. The region in the white box (h) is magnified in h”. Scale bars: (a–d,g,h) 40 μm; (e,f) 60 μm; (e’) 23.7 μm; (f’) 14.5 μm; (g’) 21 μm; (h”) 7.2 μm.
the extent of cell survival is proportional to the level of sona expression in irradiated
condi-tions.
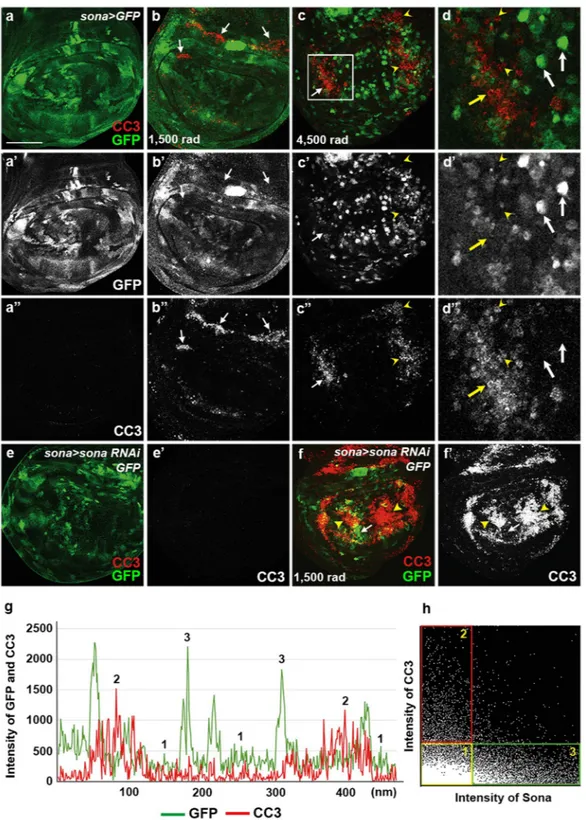
To understand the effect of sona level on cell survival, we examined which cells are more prone to cell death under γ-ray irradiation. Based on our clonal analyses, we expected that the cells expressing sona at the high level should be more resistant to cell death. To test this idea, sona > GFP larvae were irradiated with γ-ray at 1,500 or 4,500 rad, and the pattern of GFP and CC3 in their wing discs were examined (Fig. 3a–d). Indeed, CC3 signals were mostly absent in the cells that express a high level of sona (Fig. 3d). Cell death by irradiation was severer in sona > sona RNAi-111–4; GFP discs than control sona > GFP discs, demonstrating that the reductionin sona expression enhances cell death (compare Fig. 3b,e to f). Thus, the transcriptional level of sona seemed to positively correlate with the extent of cell survival under the irradiation condition.
To quantify the relationship between the levels of sona and cell death, lines were randomly drawn and the intensities of GFP and CC3 on those lines were measured in irradiated sona > GFP discs (Supplementary Fig. S5a). Consistent with the immunocytochemical data in Fig. 3c, raw data showed that the level of CC3 was low when the level of GFP was high, and vice versa in irradiated discs (16 measurements in 10 discs) (Fig. 3g). To sta-tistically analyze these data, we obtained the Mander’s coefficient using measured intensities from multiple wing discs. The Mander’s coefficient is a widely used statistical method that quantifies the degree of co-localization between two fluorescent channels by the combined measurement of correlation and co-occurrence (values rang-ing from 0 to 1; 0 for complete mutual exclusion, 0.5 for neutral relation, and 1 for complete co-occurrence)38.
The average Mander’s coefficient was 0.13 for Sona+ when CC3 is present and 0.15 for CC3+ when Sona is
pres-ent (Supplempres-entary Fig. S5b,c), which indicate their strong negative correlation. The analysis with the irradi-ated en > GFP was carried out as a control to validate the use of Mander’s coefficient for correlation analysis (Supplementary Fig. S6a,b). In sum, Mander’s coefficient values confirmed that Sona and CC3 levels show an inverse correlation after irradiation.
Intensity values of GFP and CC3 in sona > GFP and en > GFP discs were used to generate 2D intensity histo-grams in order to obtain quantitative relationship. Intensity values of different sample sources generated similar 2D histograms, and representatives are shown in Fig. 3h and Supplementary Fig. S6c. We also created an arti-ficial case that represents perfect positive correlation between the two values and generated 2D histogram for comparison (Supplementary Fig. S6d,e). Unlike these two controls, the 2D histogram of the sona > GFP discs showed inverse correlation between GFP and CC3 as expected from the data of Mander’s coefficient (Fig. 3h). We arbitrarily categorized the values in the 2D histogram into three groups as follows. Cells with the low levels of both Sona and CC3 were assigned to group 1 (yellow box), cells with the low level of Sona and the high level of CC3 were assigned to the group 2 (red box), and cells with the higher level of Sona and the low level of CC3 were assigned to the group 3 (green box). Cells in the groups 2 and 3 were readily identified in the wing discs and were consistent with our finding that the level of sona determines cell survival (Fig. 3d). On the contrary, the 2D histogram clearly identified the group 1 cells that represented the majority of cells in the wing disc, but were undetectable in the stained discs. These cells had no sona or a very low level of sona expression but were resistant to cell death. We reasoned that the group 1 cells may express another protein that inhibits cell death, and we chose Diap1 as a candidate because Diap1 is widely expressed in wing discs and essential for cell survival in a cell autonomous manner19.
expression patterns of sona, Diap1, and rpr show negative correlation after irradiation.
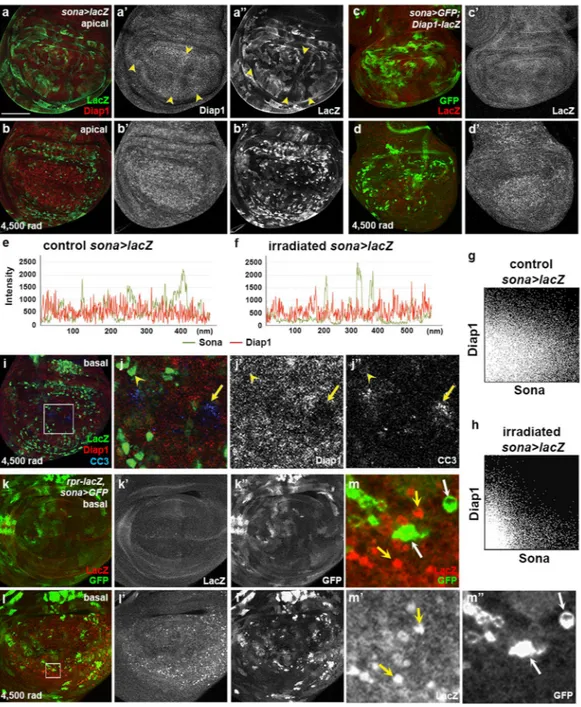
To find out the relationship between sona and Diap1, we examined the expression patterns of Diap1 and LacZ insona > lacZ discs (Fig. 4a). LacZ and Diap1 exhibited complicated mosaic patterns with weak negative correlation (arrowheads in Fig. 4a’,a”). When the sona > lacZ larvae were irradiated at 4,500 rad, LacZ pattern was changed to cluster-like and Diap1 was more evenly expressed in the wing pouch (Fig. 4a,b). Raw data and 2D intensity histograms of sona > GFP control and irradiated discs revealed that the level of Diap1 was low in the LacZ+
clus-ters (Fig. 4e–h; Supplementary Fig. S7). This indicated that negative correlation between sona and Diap1 became more strengthened by irradiation. LacZ pattern in sona > GFP; Diap1-LacZ discs was similar to the pattern of Diap1 protein in sona > lacZ discs, demonstrating that the negative correlation between sona and Diap1 is gener-ated at the transcriptional level (Fig. 4c,d). Thus, the transcription of both sona and Diap1 genes are coordinately changed by irradiation with negative correlation.
Since both Sona and Diap1 are involved in cell survival and their expressions are negatively correlated, we expected that the cells with neither Sona nor Diap1 become apoptotic upon irradiation. Indeed, cells with the high level of CC3 had low levels of sona and Diap1 expression, which may belong to the group 2 cells that had CC3 signals and a low level of sona (Fig. 4i,j; Fig. 3h). Taken together, expression of either sona or Diap1 at a high level is sufficient for cell survival against irradiation.
If sona is expressed at a high level in surviving cells, sona and rpr should also be expressed with the nega-tive correlation because rpr is expressed in dying cells. Consistent with previous reports22, irradiation changed
Rpr-LacZ pattern and increased the level of LacZ in rpr-lacZ/sona-Gal4; UAS-GFP/+ wing discs (Fig. 4k,l). Furthermore, rpr was expressed at a high level in the cells with no sona expression (yellow arrows in Fig. 4m,m’). Conversely, cells with a high level of sona expressed no rpr (white arrows in Fig. 4m,m’). In summary, rpr is upreg-ulated in the cells with no sona expression in irradiation conditions.
Sona exhibits genetic relationships with Diap1 and rpr.
Our data so far have shown that sona andDiap1 are expressed in different cells but function together for cell survival. To examine their genetic relationship
in cell survival, we compared the wing phenotypes of sona RNAi, Diap1 or both, driven by ptc-Gal4. While all
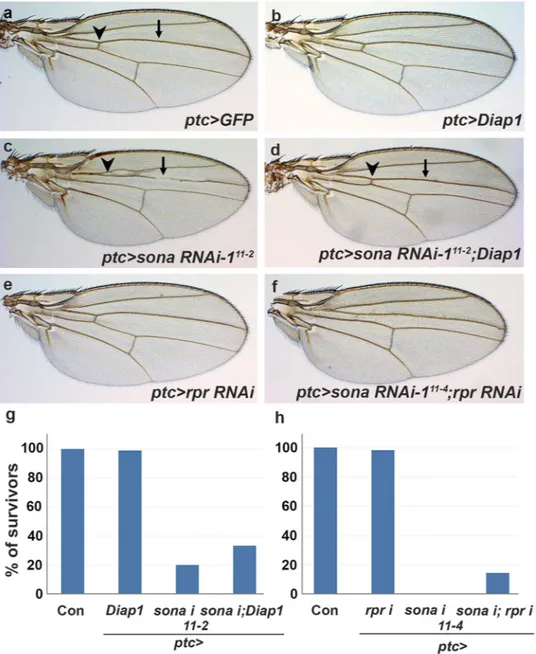
ptc > Diap1 wings were normal, 83% of ptc > sona RNAi-111–2 (n = 85) were abnormal with no anterior cross-vein,
partially lost L3 vein, and narrowed intervein region between L3 and L4 veins (Fig. 5a–c). When both Diap1 and
sona RNAi-111–2 were co-expressed, however, only 10% (n = 97) were abnormal (Fig. 5d). Thus, the wing
www.nature.com/scientificreports/
Figure 3. Sona-expressing cells are resistant to cell death upon irradiation. Irradiation intensity is indicated at the lower left. (a–d) Control sona > GFP wing disc (a), sona > GFP wing discs from the larvae irradiated at 1,500 rad (b) and at 4,500 rad (c) followed by culture for 24 hrs before dissection. The white box in c is magnified in d. The yellow arrows indicate the cells that have a high level of CC3 signals and a low level of sona. The arrowheads mark the cells with no sona but with CC3. The white arrows mark the cells with a high level of sona without CC3. (e,f) Control (e) and irradiated (f) sona > sona RNAi-111–4 wing disc from the irradiated larvae
that were cultured for 24 hours before dissection. Arrows and arrowheads mark the regions with GFP and CC3 signals, respectively. (g,h) The chart displays relationship between sona (GFP) and CC3 levels as described in Supplementary Fig. 2a (g). A 2D histogram showing the inverse correlation between sona (LacZ) and CC3 values, and the three arbitrary groups of cells are indicated by colored boxes (h). Representatives of these three groups are marked in g. Scale bars: (a) 60 μm; (b,c,e,f) 40 μm; (d) 13.2 μm.
20% (n = 85) of ptc > sona RNAi-111–2 flies reached adult stage, 33% (n = 97) of ptc > sona RNAi-111–2; Diap1 flies
could reach adult stage (Fig. 5g). Thus, Diap1 partially suppressed the lethality caused by the knockdown of sona. This suggests that sona and Diap1 exhibit a positive genetic relationship.
We next tested whether sona has any genetic relationship with rpr. ptc > rpr RNAi flies had normal wing phenotype with no lethality, and ptc > sona RNAi-111–4 flies cultured at 25 °C exhibited 100% of pupal
lethal-ity (Fig. 5e,h). When both rpr RNAi and sona RNAi-111–4 were coexpressed, up to 14% of ptc > rpr RNAi; sona
Figure 4. Negative correlation of sona and diap1 patterns is accentuated by irradiation. (a,b) Patterns of Diap1 and LacZ in control (a) and sona > lacZ wing discs irradiated at 4,500 rad (b). Arrowheads mark the region with negative correlation, a high level of Diap1 and a low level of LacZ (a’,a”). (c,d) Patterns of Diap1-lacZ and GFP in control (c c’) and irradiated sona > GFP; Diap1-lacZ wing discs at 4,500 rad (d,d’). (e,f) The charts display the expression level between sona (LacZ) and Diap1 in control (e) and irradiated sona > lacZ wing discs at 4,500 rad (f). (g,h) The 2D histograms show correlation between sona (LacZ) and Diap1 values in the discs before (g) and after irradiation (h). (i,j) Basal plane of the irradiated sona > lacZ disc. The white box in i is magnified in j. Arrow mark CC3 signals in the cell with no Diap1, and arrowheads mark the cell with sona but no CC3 signals. (k–m) The pattern and level of rpr-LacZ and sona (GFP) in control (k) and in irradiated (l) in rpr-lacZ,
sona > GFP discs. The region marked with a white box in l is magnified in m. Cells with no GFP, but with a high
level of LacZ are marked with yellow arrows, and cells with a high level of GFP, but with no LacZ are marked with white arrows. Scale bars: (a–d,i) 60 μm; (j) 15.4 μm; (k,l) 40 μm; (m) 5.7 μm.
www.nature.com/scientificreports/
RNAi-111–4 flies (n = 63) reached adult stage with somewhat defective wings (Fig. 5f,h). This indicated that cell
death by loss of sona partially depends on the function of rpr. Taken together, sona exhibited the positive genetic relationship with Diap1 but the negative genetic relationship with rpr, which is consistent with our finding that
sona promotes cell survival.
sona
+clusters are formed by increased sona transcription but not by cell division.
We haveshown that irradiation changes the pattern of sona-Gal4 expression (Figs 3c, 4b). The most noticeable change in irradiated sona > GFP discs was the appearance of sona+ clusters. sona+ clusters were generated by 4,500 rad
but rarely by 1,500 rad (Fig. 3a’–c’). As a result, mostly two major types of cells remained in the wing pouch after irradiation at 4,500 rad: one with the high level of sona and the other with no or very low sona expression (Fig. 3c; Fig. 4b,d,i,l). en > GFP or tubulin > GFP larvae irradiated at 4,500 rad did not show any change in the pattern of GFP in the wing discs, so the GFP-positive clusters in sona > GFP discs were unique to sona-expressing cells (Supplementary Fig. S6a, S8).
Figure 5. sona exhibits genetic relationship with diap1 and rpr. Genotypes are indicated at the lower right. Arrowheads and arrows indicate the anterior crossvein and the L3 vein, respectively. (a–f) Adult wing phenotype by single or co-expression of sona RNAi, rpr RNAi, and Diap1 by ptc-Gal4 driver cultured at 25 °C.
ptc > sona RNAi-111–2; Diap1 wings (d) have anterior cross-vein (arrowhead) and normal L3 vein (arrow). ptc > sona RNAi-111–4 flies show pupal lethality (h), while ptc > rpr RNAi; sona RNAi-111–4 flies survive to
adulthood, and still show reduction in distance between L3 and L4 veins (f). (g,h) Bar graphs show the effects of
Based on the result that sona+ clusters are formed by irradiation, these sona+ clusters may be generated by
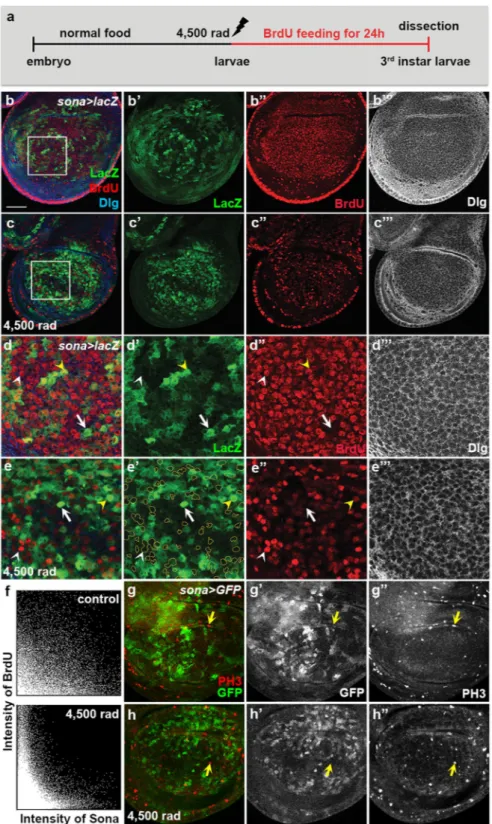
cell division or induction of sona transcription. To distinguish these possibilities, sona > lacZ larvae were irradi-ated at 4,500 rad, and then cultured in Bromodeoxyuridine (BrdU)-containing food for 24 hours until dissection (Fig. 6a). In control discs, BrdU was incorporated in the cells of the wing pouch region regardless of sona expres-sion (Fig. 6b,d). In contrast, most sona-expressing cells did not incorporate BrdU but the neighboring cells did in irradiated discs (Fig. 6c,e). The two 2D intensity histograms also confirmed that sona-expressing cells have less BrdU incorporation (Fig. 6f). The histogram also revealed that a weak inverse correlation exists between
sona expression and BrdU incorporation even in control discs (Fig. 6f). Therefore, sona-expressing cells divide less frequently than sona− cells even in the unirradiated condition. Consistent with the BrdU data, mitotic cells
marked with anti-phospho-histone H3 (PH3) antibody were mostly absent in the sona-expressing cells in both control and irradiated wing discs of sona > GFP larvae (Fig. 6g,h). We concluded that sona+ clusters are formed
by increased sona transcription but not by cell division.
To further understand how these sona+ clusters are formed, we generated 3D and combined images from
mul-tiple confocal images of unirradiated and irradiated sona > GFP discs (Supplementary Fig. S9). Unlike the single confocal images and the combined images (Supplementary Fig. S9a–a”,b–b”), the 3D images revealed that the
sona+ clusters were actually two dimensional confocal images from a continuous cell group that express sona at a
high level (arrows in Supplementary Fig. S9c’). An image tilted from the 3D image showed that these continuous cell groups may be clonal (Supplementary Fig. S9d). When the combined images of sona expression were com-pared between irradiated and unirradiated discs, it appeared that irradiation induced either increase or decrease in the expression level of sona, leading to the greater difference between sona+ and sona− cells (Supplementary
Fig. S9a”,b”).
sona promotes development and survival under the irradiation condition.
Generation of sona+cell groups suggested that increase in sona transcription may be required for cell survival in the irradiation con-dition. To test this, we dissected sona > GFP wing discs at different time points after irradiation. We found that the level of GFP was same in both unirradiated and irradiated discs initially but was about doubly increased by 24 hours after irradiation (n > 30, Supplementary Fig. S10). Furthermore, the level of Sona protein was increased where GFP level is high in irradiated discs (Supplementary Fig. S11). These data raised an interesting possibility that increase in sona transcription is an important required step for survival against irradiation.
To test whether the increase in sona level can promote survival, we examined the effect of overexpressed Sona on irradiated flies. We have previously reported that overexpression of Sona by most Gal4 drivers causes organismal death28. To overcome this Sona-induced lethality, we cultured sona-Gal4/+; Gal80ts/+ control flies
and sona-Gal4/+; Gal80ts UAS-sona/+ experimental flies at 18 °C for 6 days until the mid to late third instar stage,
and then cultured them at 29 °C for six hours in order to transiently induce Sona expression. Flies were then irradiated with 3,000 rad or 4,500 rad, and cultured at 18 °C until adult stage. Control groups that were treated the same way without irradiation developed at the same pace regardless of Sona, and developed faster than irra-diated flies. Interestingly, sona-Gal4/+; Gal80ts UAS-sona/+ flies developed faster than the irradiated control
flies (Supplementary Fig. S12). Furthermore, they produced more adults (20.5%, 15 adults out of 74 pupae) than control sona-Gal4/+; Gal80ts/+ flies (13.6%, 8 adults from 59 pupae). Although, Sona was overexpressed only for
6 hours prior to irradiation, both survival and development of flies were noticeably promoted.
sona
+cells induce the expression of Cyc D in neighboring cells.
As the neighboring cells of sona+clusters incorporated BrdU, and transient expression of Sona increased survival rate, we hypothesized that the
sona+ cells send signals to neighboring cells for cell proliferation and enhance survival. To test whether Sona
is able to promote cell proliferation and increases tissue size, we overexpressed Sona using ptc-Gal4 driver at 18 °C. Most ptc > sona flies were lethal, but wings of rare survivors (~70%, n = 16) exhibited enlarged ptc region (Fig. 7a–e). Some wings had enlarged bubble in the ptc region, which supports that Sona is able to increase tissue size. The distances between the L3 and L4 veins of these wings except the one with bubbles are plotted in Fig. 7f.
We then examined how Sona is able to increase tissue size. Since prolonged overexpression of sona causes lethality28, we used Gal80ts39 to transiently induce sona in the anterior region by cubitus interruptus (ci)-Gal4
driver. UAS-GFP; UAS-sona, Gal80ts flies were crossed with ci-Gal4 flies and cultured at 18 °C, and the progeny
was shifted to 29 °C for 6, 10, and 14 hours during the third instar stage to transiently induce Sona. Because Sona can increase tissue size, we examined whether the level of any Cyclins is increased in the wing discs. Six hour cul-ture at 29 °C did not induce GFP at all, and fourteen hour culcul-ture induced signs of tissue damage, so we examined the wing discs after 10 hour induction (data not shown). Among the three larval progeny, ci > Gal80ts larvae and ci > GFP; Gal80ts larvae did not show any change (Fig. 7g; Supplementary Fig. 13a) but ci > GFP; sona, Gal80ts
larvae had upregulated Cyc D in wing discs (Fig. 7h; Supplementary Fig. 13b). Cyc D was expressed in the cells that are in the close vicinity of but not in sona-expressing cells in most cases (Fig. 7i). Similar experiments were carried out in the posterior region with en-Gal4 driver, in which GFP was detected after 24 hours of transient expression (Fig. 7j,k). We used UAS-sona-HA instead of UAS-sona for transient expression in order to check the expression of ectopic Sona with anti-HA antibody (Fig. 7k’). Similar to the experiment done in the anterior region with ci-Gal4, Cyc D was upregulated in the cells that show neither GFP nor HA in the posterior region with
en-Gal4 (Fig. 7k). Cyc D is a key Cyclin that responds to mitogens before the initiation of DNA synthesis, and its expression is regulated by Wnts in mammalian system40–43. These data strongly suggest that Sona-producing
cells send out signals to the neighboring cells for induction of Cyc D. Whether the signal is Sona itself, Wg, or unknown molecules needs further analysis.
www.nature.com/scientificreports/
Figure 6. Cells expressing a high level of Sona do not divide upon irradiation. (a) The experimental scheme to examine the effect of irradiation on sona expression and DNA synthesis. (b–e) Wing discs from the control (b) and irradiated (c) sona > lacZ larvae fed with BrdU for 24 hours before dissection. The boxed regions in (b,c) are magnified in (d,e), respectively. The cells expressing a high level of sona are outlined to show the lack of overlapping between LacZ and BrdU signals in e’. An arrow marks a representative sona-expressing cell lacking BrdU incorporation while white and yellow arrowheads mark incorporation of BrdU in the cells with no or a low level of sona expression, respectively. (f) 2D histograms showing the inverse relationship between the levels of BrdU and sona in control and irradiated sona > lacZ discs above. (g,h) Phospho-histone H3 patterns of control (g) and irradiated (h) sona > GFP discs. Arrows mark the cells with PH3 but no GFP. Scale bars: (b,c,g,h) 40 μm; (d,e) 12.6 μm.
Discussion
We have shown in this report that Sona functions in two different ways. First, Sona is required cell autono-mously for cell survival, and the level of sona transcription correlates with the degree of cell survival under the irradiated condition. We found that cells expressing a high level of either sona or Diap1 are resistant to cell death, so there are at least two different types of surviving cells in wing discs. Second, Sona induces cell prolif-eration cell non-autonomously. Transient expression of sona upregulated Cyc D in neighboring cells but not in
sona-expressing cells, suggesting that radiation-resistant sona-expressing cells secrete signaling molecule(s) that
upregulates Cyc D in neighboring cells. In conjunction with genetic interactions between sona, Diap1 and rpr, cells expressing sona may dynamically interplay with other cells that express Diap1 and rpr for damage control.
Sona is expressed in the patchy pattern, and sona clones with different sizes were generated in the wing pouch region (Fig. 2). We speculate that the large sona clones are generated where sona is not expressed. Similar result was reported in the loss-of-function clone analysis of the vestigial (vg) gene that is essential for survival and proliferation of wing disc cells43. The authors found that vg RNAi clones are generated where Vg is not expressed
or expressed at a low level in wing discs44. That is, the loss-of-function vg clones are rarely formed where Vg is
required for cell survival and proliferation. Indeed, Vg drives cell cycle progression by inducing dE2F1 gene Figure 7. Sona overexpression induces tissue growth and the expression of Cyc D in neighboring cells. (a) Control CS adult wing. (b,c) The overgrowth phenotypes of two ptc > sona adult wings. The phenotype of c seems more severe than b. The boxed regions in (a,b) are magnified in (d,e), respectively. The lines with double arrowheads mark the region between L3 and L4 veins. (f) The quantitative analysis on the distances between L3-L4 regions in CS and ptc > sona wings. (g–i) Control ci > Gal80ts (g) and ci > sona, GFP, Gal80ts (h) larvae
were cultured at 30 °C for 10 hours to induce transient overexpression of Sona and then their wing discs were stained for Cyc D. The boxed region in (h) is magnified in (i). Similar results in another disc are shown in Supplementary Fig. S13b. (j,k) en > sona-HA, GFP, Gal80ts larvae were also used to induce Cyc D expression
by Sona-HA. Larvae were cultured at 30 °C for 24 hours and stained for HA and Cyc D. Arrows mark the sona−
cells expressing Cyc D. Arrowheads mark the cells with upregulated Cyc D in the cells that are in the close vicinity of sona+ cells. Scale bars: (g,h) 40 μm; (i,k) 17 μm; (j) 50 μm.
www.nature.com/scientificreports/
whose product is essential for G1 to S transition in cell cycle45. Formation of clones with different sizes may be
a general phenomenon for the genes that are expressed unevenly and are required for cell proliferation or cell survival. Varied levels of sona and vg expression in different parts of wing discs may be required to create regional differences in growth rate in order to form wings with proper size and shape.
What are the distinct functions of sona-expressing cells? In normal conditions, sona is expressed in a widely varing level in a patchy pattern, and acts as a signal to promote cell proliferation for wing development. In irra-diated conditions, the transcriptional level of sona dramatically increased among sona-expressing cells that may be required to cope against extensive cell death. This irradiation generated two major cell groups in the wing pouch. The first group of cells are determined to grow and proliferate or, alternatively, to die upon a high level of irradiation. The second group of cells are resistant to irradiation and send out signals to regulate the first group of cells. The first group of cells should express proteins for cell growth, cell proliferation, cell survival and cell death including Diap1and Rpr. The second group of cells should have capacity to sense the changes in environment and send out signals to regulate the first group of cells. In this study, we identified Sona as one of the proteins expressed in the second group of cells in a patchy pattern. Interestingly, a phosphorylated form of ribosomal pro-tein S6 (pS6) that should be regulated in the first group of cells is also present in a patchy pattern46,47. We speculate
that pS6 and sona may express in the first and the second groups of cells, respectively.
We showed that Sona induces Cyc D in nearby cells, which is consistent with the finding that overexpressed Sona increases tissue size (Fig. 7). Cyc D is known as a target protein of Wnt signaling in mammals40–43, and acts
in a G1 phase of cell cycle that responds to mitogens48. In flies, overexpression of Cyc D/Cdk4 accelerates cell
division in proliferating wing disc cells while increasing the cell size in post-mitotic cells by endoreplication49.
Because Cyc D is required for cell division of surviving cells, it should be upregulated in Diap1-expressing cells. Indeed, Diap1 is induced by Yorki and STAT in Hippo pathway and JAK-STAT pathway, respectively, and these two pathways are essential for cell proliferation in a cell autonomous manner25,26. An important question is the
identity of the direct signal(s) that upregulate Cyc D. Secreted Sona may act as a direct signal or, as a metallopro-tease, may modulate the activity of other signaling molecules such as Wg. It has been reported that irradiation activates a damage-activated enhancer BRV118 of the wg gene50,51. Therefore, irradiation changes the
transcrip-tion pattern of both sona and wg, and may coordinate the functranscrip-tions of Sona and Wg for inductranscrip-tion of Cyc D, although Sona may activate yet another signaling molecules.
An interesting new mechanism to repair tissue damage has been recently discovered, in which cells of the presumptive hinge region in the wing disc migrate into the pouch region after irradiation52. These hinge cells also
migrate into the pouch region when the pouch cells are killed by hid expression53. These hinge cells are resistant
to cell death due to the activation of Wg signaling and STAT signaling that suppress the transcription of rpr52.
Resistance to irradiation and lack of rpr expression are also characteristics of sona-expressing cells, suggesting that the sona-expressing cells in the wing pouch may be functionally related to the radiation-resistant hinge cells. Because intense irradiation physically induces DNA breakage even in these radiation-resistant cells, the mech-anism by which these sona-expressing cells cope against DNA damage is an important question to be explored.
Several mammalian metalloproteases in ECM are also shown to prevent apoptosis. Overexpression of MMP-15 (matrix metalloprotease-MMP-15) prevents apoptosis of Hela and human adenocarcinoma54. Furthermore,
ADAM-12 increases apoptosis of stromal cell but decreases that of tumor cells55. In ADAMTS family, ADAMTS20 is
shown to be required for cell survival. ADAMTS20 is mutated in belted (bt) mice that show cell death of melano-blast56. Sona is also involved in cell survival by increasing resistance against irradiation and by promoting cell
proliferation of neighboring cells. Identification of Sona substrate and its function will greatly help understand the role of Sona in cell survival, which is currently ongoing in our laboratory.
Materials and Methods
Drosophila strains.
All UAS-sona RNAi lines and sona mutants generated in our lab and characterization of sona-Gal4 line (P{GawB}CG9850) are described28. P{lacW}Diap1j5C8/TM3 was used as Diap1-lacZ line57,58.UAS-Diap1, UAS-lacZ, rpr-lacZ, wg-lacZ, UAS-GFP, UAS-p35, hsFLP; FRT42D ubiGFP, FRT42D ubi-GFP, ptc-Gal4, en-ptc-Gal4, tubulin-Gal4 and apterous-Gal4 were obtained from Bloomington stock center. UAS-rpr RNAi was
obtained from VDRC (101234). ci-Gal4 is described in59. Fly cultures were carried out at 25 °C unless otherwise
indicated.
Adult wing mounting.
Wing of 2–7 days old adult flies were dissected and mounted in Gary’s Magic Mountant (Mixture of Canada Balsam and methyl salicylate, 4:1).Generation of mitotic clones and RNAi clones.
Mitotic clones were generated by FLP-mediated recom-bination60. sona13 FRT42D/CyO or sona47 FRT42D/CyO flies were crossed to hsFLP; FRT42D ubi-GFP lines28.Clones were induced by heat shock at 37 °C for 1 hour during first or second instar larval stages, and late 3rd instar
larvae were dissected. For the generation of sona RNAi clones, hsFLP > Actin > CD2 > Gal4 flies61 were crossed
with UAS-GFP; UAS-sona RNAi-111–4 line and their progeny were heat-shocked for one hour at 37 °C to induce the
clones, and dissected when they were late 3rd instar larvae. For control clones, UAS-GFP line was used.
Immunocytochemistry.
Wing discs from wandering third-instar larvae were dissected and processed as described62. DAPI staining solution (Boehringer Mannheim) was used in the first washing step after secondaryantibody staining. Discs were mounted in Vectashield (Vector Laboratories). The images were acquired using Zeiss LSM laser scanning confocal microscope and presented using Adobe Photoshop.
Primary antibodies were used in the following dilutions: sheep anti-GFP (Abd serotec), 1:100; chicken anti-β-gal (ab 9361), 1:100; rabbit anti-cleaved Caspase-3 (Cell Signaling Technology), 1:250; rabbit anti-cleaved Dcp-1 (Cell Signaling), 1:100; rabbit anti-Sona-Pro28, 1:500; mouse anti-Diap1 (a gift from Dr. Soon Ji Yoo21,)
1:100; mouse anti-Cyc D (Santa Cruz), 1:200; rabbit anti-Dlg63, 1:500; rabbit anti-PH3 (Millipore), 1:200; rat
anti-HA (Roche), 1:150. Secondary antibodies were from Jackson Immunoresearches.
Apoptosis induction by irradiation.
Flies were grown at 25 °C until their progeny reached second to third instar larvae, and were treated with the indicated doses of γ–radiation (1,500 or 4,500 rad). They were allowed to grow for 24 hours after irradiation and dissected at the wandering 3rd instar larvae.BrdU feeding.
The protocol has been modified based on several reports64–66. Embryos of sona > lacZgen-otype were cultured at 25 °C until they reached to the 1st or 2nd instar larvae. Right after irradiation at 4,500 rad,
0.5 mg/ml BrdU were poured evenly on top of the food containing irradiated larvae. After 24 hours of BrdU feed-ing, 3rd instar larvae were dissected in Schneider’s insect culture medium (M3 medium). For control experiments,
unirradiated 1st and 2nd instar larvae were fed in BrdU containing food for 24 hours. The discs were fixed for
20 min in PBTx (phosphate buffered saline, 0.3% Triton X-100) containing 5% paraformaldehyde.
Image acquisitions and analysis.
To quantify the degree of colocalization, the confocal images from two channels were compared using coloc2 analysis package in Fiji software67. To minimize the background signal,the threshold values were automatically set according to the Cotes method. For testing Cotes’ significance, the point spread function (PSF) was set to 50 with the number of iteration of 10. Mander’s Colocalization Coefficient (MCC) was presented within results. The representative 2D histograms were also generated using Fiji software.
References
1. Baehrecke, E. H. How death shapes life during development. Nature Reviews Molecular Cell Biology 3, 779–787 (2002). 2. Elmore, S. Apoptosis: a review of programmed cell death. Toxicologic pathology 35, 495–516 (2007).
3. Xu, D. et al. Genetic control of programmed cell death (apoptosis) in Drosophila. Fly 3, 78–90 (2009).
4. Fan, Y. & Bergmann, A. Apoptosis-induced compensatory proliferation. The Cell is dead. Long live the Cell! Trends in cell biology
18, 467–473 (2008).
5. Kashio, S., Obata, F. & Miura, M. Interplay of cell proliferation and cell death in Drosophila tissue regeneration. Development, growth
& differentiation 56, 368–375 (2014).
6. Bergmann, A. & Steller, H. Apoptosis, stem cells, and tissue regeneration. Science signaling 3, re8 (2010).
7. Ryoo, H. D. & Bergmann, A. The role of apoptosis-induced proliferation for regeneration and cancer. Cold Spring Harbor perspectives
in biology 4, a008797 (2012).
8. Ryoo, H. D., Gorenc, T. & Steller, H. Apoptotic cells can induce compensatory cell proliferation through the JNK and the Wingless signaling pathways. Developmental cell 7, 491–501 (2004).
9. Pérez-Garijo, A., Shlevkov, E. & Morata, G. The role of Dpp and Wg in compensatory proliferation and in the formation of hyperplastic overgrowths caused by apoptotic cells in the Drosophila wing disc. Development 136, 1169–1177 (2009).
10. Milan, M., Campuzano, S. & García-Bellido, A. Developmental parameters of cell death in the wing disc of Drosophila. Proceedings
of the National Academy of Sciences 94, 5691–5696 (1997).
11. Pérez-Garijo, A., Martín, F. A. & Morata, G. Caspase inhibition during apoptosis causes abnormal signalling and developmental aberrations in Drosophila. Development 131, 5591–5598 (2004).
12. Haynie, J. L. & Bryant, P. J. The effects of X-rays on the proliferation dynamics of cells in the imaginal wing disc of Drosophila melanogaster. Wilhelm Roux’s archives of developmental biology 183, 85–100 (1977).
13. Huh, J. R., Guo, M. & Hay, B. A. Compensatory proliferation induced by cell death in the Drosophila wing disc requires activity of the apical cell death caspase Dronc in a nonapoptotic role. Current Biology 14, 1262–1266 (2004).
14. Ryoo, H. D., Bergmann, A., Gonen, H., Ciechanover, A. & Steller, H. Regulation of Drosophila IAP1 degradation and apoptosis by reaper and ubcD1. Nature cell biology 4, 432–438 (2002).
15. Wilson, R. et al. The DIAP1 RING finger mediates ubiquitination of Dronc and is indispensable for regulating apoptosis. Nature cell
biology 4, 445–450 (2002).
16. White, K. et al. Genetic control of programmed cell death in Drosophila. Science 264, 677–683 (1994).
17. Grether, M. E., Abrams, J. M., Agapite, J., White, K. & Steller, H. The head involution defective gene of Drosophila melanogaster functions in programmed cell death. Genes & development 9, 1694–1708 (1995).
18. Chen, P., Nordstrom, W., Gish, B. & Abrams, J. M. grim, a novel cell death gene in Drosophila. Genes & Development 10, 1773–1782 (1996).
19. Wang, S. L., Hawkins, C. J., Yoo, S. J., Müller, H.-A. J. & Hay, B. A. The Drosophila caspase inhibitor DIAP1 is essential for cell survival and is negatively regulated by HID. Cell 98, 453–463 (1999).
20. Goyal, L., McCall, K., Agapite, J., Hartwieg, E. & Steller, H. Induction of apoptosis by Drosophila reaper, hid and grim through inhibition of IAP function. The EMBO journal 19, 589–597 (2000).
21. Yoo, S. J. et al. Hid, Rpr and Grim negatively regulate DIAP1 levels through distinct mechanisms. Nature cell biology 4, 416–424 (2002).
22. Nordstrom, W., Chen, P., Steller, H. & Abrams, J. M. Activation of thereaperGene during Ectopic Cell Killing in Drosophila.
Developmental biology 180, 213–226 (1996).
23. Brodsky, M. H. et al. Drosophila p53 binds a damage response element at the reaper locus. Cell 101, 103–113 (2000).
24. Meier, P., Silke, J., Leevers, S. J. & Evan, G. I. The Drosophila caspase DRONC is regulated by DIAP1. The EMBO journal 19, 598–611 (2000).
25. Huang, J., Wu, S., Barrera, J., Matthews, K. & Pan, D. The Hippo signaling pathway coordinately regulates cell proliferation and apoptosis by inactivating Yorkie, the Drosophila Homolog of YAP. Cell 122, 421–434 (2005).
26. Betz, A., Ryoo, H. D., Steller, H. & Darnell, J. E. STAT92E is a positive regulator of Drosophila inhibitor of apoptosis 1 (DIAP/1) and protects against radiation-induced apoptosis. Proceedings of the National Academy of Sciences 105, 13805–13810 (2008).
27. Wu, S., Liu, Y., Zheng, Y., Dong, J. & Pan, D. The TEAD/TEF family protein Scalloped mediates transcriptional output of the Hippo growth-regulatory pathway. Developmental cell 14, 388–398 (2008).
28. Kim, G.-W. et al. Sol narae (Sona) is a Drosophila ADAMTS involved in Wg signaling. Scientific reports 6, 31863 (2016).
29. Kramerova, I. A. et al. Papilin in development; a pericellular protein with a homology to the ADAMTS metalloproteinases.
Development 127, 5475–5485 (2000).
30. Ismat, A., Cheshire, A. M. & Andrew, D. J. The secreted AdamTS-A metalloprotease is required for collective cell migration.
Development 140, 1981–1993 (2013).
31. Ozdowski, E. F., Mowery, Y. M. & Cronmiller, C. Stall encodes an ADAMTS metalloprotease and interacts genetically with Delta in Drosophila ovarian follicle formation. Genetics 183, 1027–1040 (2009).
32. Kelwick, R., Desanlis, I., Wheeler, G. N. & Edwards, D. R. The ADAMTS (A Disintegrin and Metalloproteinase with Thrombospondin motifs) family. Genome biology 16, 113 (2015).
www.nature.com/scientificreports/
33. Fernandes-Alnemri, T., Litwack, G. & Alnemri, E. S. CPP32, a novel human apoptotic protein with homology to Caenorhabditis elegans cell death protein Ced-3 and mammalian interleukin-1 beta-converting enzyme. Journal of Biological Chemistry 269, 30761–30764 (1994).
34. Fan, Y. & Bergmann, A. The cleaved-Caspase-3 antibody is a marker of Caspase-9-like DRONC activity in Drosophila. Cell Death &
Differentiation 17, 534–539 (2010).
35. Nicholson, D. W. et al. Identification and inhibition of the ICE/CED-3 protease necessary for mammalian apoptosis. Nature 376, 37 (1995).
36. Hay, B. A., Wolff, T. & Rubin, G. M. Expression of baculovirus P35 prevents cell death in Drosophila. Development 120, 2121–2129 (1994).
37. Kassis, J. A., Noll, E., VanSickle, E. P., Odenwald, W. F. & Perrimon, N. Altering the insertional specificity of a Drosophila transposable element. Proceedings of the National Academy of Sciences 89, 1919–1923, https://doi.org/10.1073/pnas.89.5.1919
(1992).
38. Dunn, K. W., Kamocka, M. M. & McDonald, J. H. A practical guide to evaluating colocalization in biological microscopy. American
Journal of Physiology-Cell Physiology 300, C723–C742 (2011).
39. McGuire, S. E., Mao, Z. & Davis, R. L. Spatiotemporal gene expression targeting with the TARGET and gene-switch systems in Drosophila. Sci. STKE 2004, pl6–pl6 (2004).
40. Lin, S.-Y. et al. β-catenin, a novel prognostic marker for breast cancer: its roles in cyclin D1 expression and cancer progression.
Proceedings of the National Academy of Sciences 97, 4262–4266 (2000).
41. Shtutman, M. et al. The cyclin D1 gene is a target of the β-catenin/LEF-1 pathway. Proceedings of the National Academy of Sciences
96, 5522–5527 (1999).
42. Tetsu, O. & McCormick, F. β-Catenin regulates expression of cyclin D1 in colon carcinoma cells. Nature 398, 422–426 (1999). 43. Van de Bor, V., Delanoue, R., Cossard, R. & Silber, J. Truncated products of the vestigial proliferation gene induce apoptosis. Cell
death and differentiation 6, 557 (1999).
44. Baena-Lopez, L. & Garcia-Bellido, A. Control of growth and positional information by the graded vestigial expression pattern in the wing of Drosophilamelanogaster. Proceedings of the National Academy of Sciences 103, 13734–13739 (2006).
45. Delanoue, R. et al. The Drosophila wing differentiation factor vestigial–scalloped is required for cell proliferation and cell survival at the dorso-ventral boundary of the wing imaginal disc. Cell death and differentiation 11, 110 (2004).
46. Romero-Pozuelo, J., Demetriades, C., Schroeder, P. & Teleman, A. A. CycD/Cdk4 and discontinuities in Dpp signaling activate TORC1 in the Drosophila wing disc. Developmental cell 42, 376–387. e375 (2017).
47. Jewell, J. L., Russell, R. C. & Guan, K.-L. Amino acid signalling upstream of mTOR. Nature reviews Molecular cell biology 14, 133 (2013).
48. Lim, S. & Kaldis, P. Cdks, cyclins and CKIs: roles beyond cell cycle regulation. Development 140, 3079–3093 (2013).
49. Datar, S. A., Jacobs, H. W., de la Cruz, A. F. A., Lehner, C. F. & Edgar, B. A. The Drosophila cyclin D–Cdk4 complex promotes cellular growth. The EMBO journal 19, 4543–4554 (2000).
50. Harris, R. E., Setiawan, L., Saul, J. & Hariharan, I. K. Localized epigenetic silencing of a damage-activated WNT enhancer limits regeneration in mature Drosophila imaginal discs. Elife 5, e11588 (2016).
51. Schubiger, M., Sustar, A. & Schubiger, G. Regeneration and transdetermination: the role of wingless and its regulation.
Developmental biology 347, 315–324 (2010).
52. Verghese, S. & Su, T. T. Drosophila Wnt and STAT define apoptosis-resistant epithelial cells for tissue regeneration after irradiation.
PLoS biology 14, e1002536 (2016).
53. Herrera, S. C., Martín, R. & Morata, G. Tissue homeostasis in the wing disc of Drosophila melanogaster: immediate response to massive damage during development. PLoS genetics 9, e1003446 (2013).
54. Abraham, R. et al. Identification of MMP-15 as an anti-apoptotic factor in cancer cells. Journal of Biological Chemistry 280, 34123–34132 (2005).
55. Kveiborg, M. et al. A role for ADAM12 in breast tumor progression and stromal cell apoptosis. Cancer research 65, 4754–4761 (2005).
56. Silver, D. L. et al. The secreted metalloprotease ADAMTS20 is required for melanoblast survival. PLoS genetics 4, e1000003 (2008). 57. Verghese, S., Bedi, S. & Kango-Singh, M. Hippo signalling controls Dronc activity to regulate organ size in Drosophila. Cell Death &
Differentiation 19, 1664–1676 (2012).
58. Demay, Y., Perochon, J., Szuplewski, S., Mignotte, B. & Gaumer, S. The PERK pathway independently triggers apoptosis and a Rac1/ Slpr/JNK/Dilp8 signaling favoring tissue homeostasis in a chronic ER stress Drosophila model. Cell death & disease 5, e1452 (2014). 59. Llense, F. & Martín-Blanco, E. JNK signaling controls border cell cluster integrity and collective cell migration. Current Biology 18,
538–544 (2008).
60. Xu, T. & Rubin, G. M. Analysis of genetic mosaics in developing and adult Drosophila tissues. Development 117, 1223–1237 (1993). 61. Pignoni, F. & Zipursky, S. L. Induction of Drosophila eye development by decapentaplegic. Development 124, 271–278 (1997). 62. Carroll, S. B. & Whyte, J. S. The role of the hairy gene during Drosophila morphogenesis: stripes in imaginal discs. Genes Dev 3,
905–916 (1989).
63. Cho, K.-O., Chern, J., Izaddoost, S. & Choi, K.-W. Novel signaling from the peripodial membrane is essential for eye disc patterning in Drosophila. Cell 103, 331–342 (2000).
64. Ito, K. & Hotta, Y. Proliferation pattern of postembryonic neuroblasts in the brain of Drosophila melanogaster. Developmental
biology 149, 134–148 (1992).
65. Truman, J. W. & Bate, M. Spatial and temporal patterns of neurogenesis in the central nervous system of Drosophila melanogaster.
Developmental biology 125, 145–157 (1988).
66. Jaklevic, B. R. & Su, T. T. Relative contribution of DNA repair, cell cycle checkpoints, and cell death to survival after DNA damage in Drosophila larvae. Current biology 14, 23–32 (2004).
67. Schindelin, J. et al. Fiji: an open-source platform for biological-image analysis. Nature methods 9, 676 (2012).
Acknowledgements
We are grateful to K.-W. Choi, S.-T. Hong and colleagues in our lab for discussion and comments on manuscript. We also thank to D.-G. Cho for irradiating flies, and O.-K. Lee and B.-S. Kim for technical assistance and fly maintenance. We thank S. J. Yoo for Diap1 antibody and J.-K. Chung for Diap1-lacZ fly strain. We acknowledge Bloomington Stock Center, Drosophila Genetic Resource Center and Developmental Studies Hybridoma Bank for fly strains and antibodies. This research was supported by National Research Foundation R1A1A301573 and N01170193, and National Research Council of Science and Technology Grant DRC-14-2-KRISS.
Author Contributions
O.T., Y.-K.B., and K.-O.C. designed experiments, analyzed data and wrote the paper. O.T., J.-H.W., G.-W.K. and J.-H.H. conducted experiments.
Additional Information
Supplementary information accompanies this paper at https://doi.org/10.1038/s41598-018-37557-9. Competing Interests: The authors declare no competing interests.
Publisher’s note: Springer Nature remains neutral with regard to jurisdictional claims in published maps and institutional affiliations.
Open Access This article is licensed under a Creative Commons Attribution 4.0 International License, which permits use, sharing, adaptation, distribution and reproduction in any medium or format, as long as you give appropriate credit to the original author(s) and the source, provide a link to the Cre-ative Commons license, and indicate if changes were made. The images or other third party material in this article are included in the article’s Creative Commons license, unless indicated otherwise in a credit line to the material. If material is not included in the article’s Creative Commons license and your intended use is not per-mitted by statutory regulation or exceeds the perper-mitted use, you will need to obtain permission directly from the copyright holder. To view a copy of this license, visit http://creativecommons.org/licenses/by/4.0/.